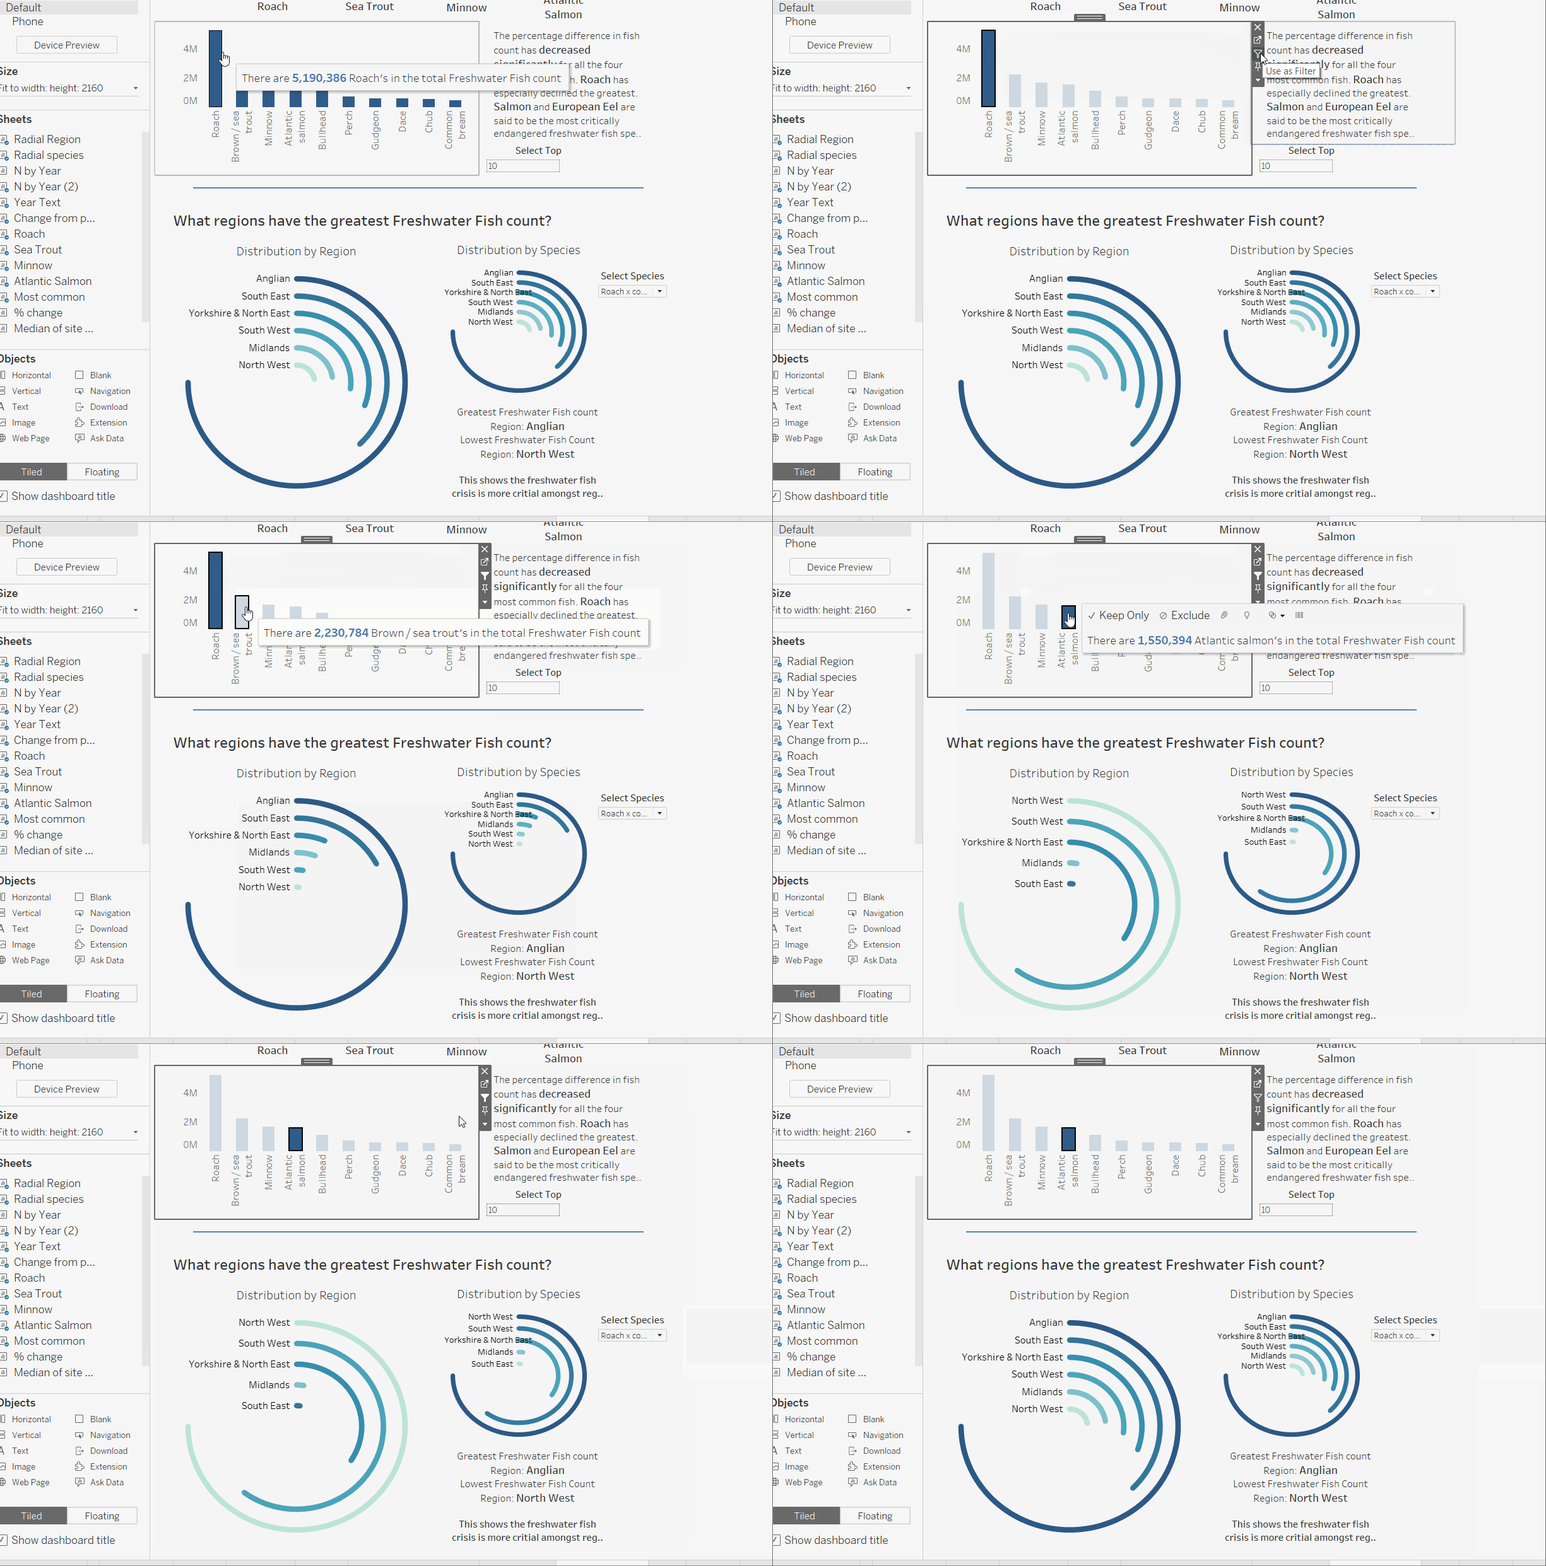
In my final Viz application, I remember being told by Lorna that my dashboard would be slightly more impactful by adding filters that highlight a selected category for all diagrams. At the time, I had no idea how to do this in a simple way without creating various different parameter and adding multiple filters. However, week 3 of the data school introduced us to this simple method.

As you can see, I initial tried to add a species parameter 'Select Species' but this was an extensive list of about 120 names and only applied to the 'Distribution by Species' diagram. It would be much more user friendly to allow users to click the name via the bar, and all diagrams would be filtered according to the species.
