


This week is the Tips Week, so each of the data schoolers are going to post one Tableau tip everyday, that will be 40 tips by the end of the week!
My first tip is to improve your dashboard designs using images to filter the data, or even to show different images based on filters, like you can see in my Bruce Springsteen Viz to filter ratings based on the album cover or in my Education Viz to show the different countries flags when selecting a concrete country.
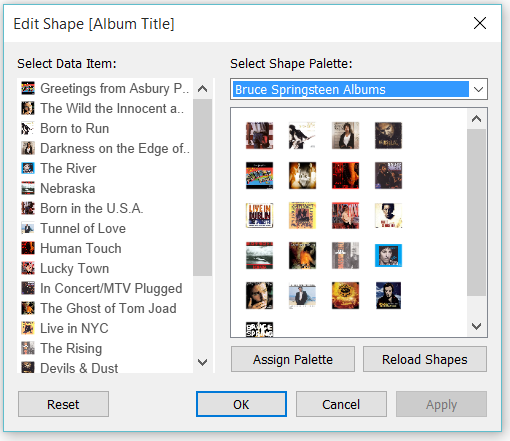
There are two ways to do this, the first one is as easy as copy a folder with the images you want to use to your My Tableau Repository > Shapes Folder, then close Tableau and open it again, and then you select Shape in your marks shelf and click on the shape button you will find an additional shape palette with your images:
Then you can show all the marks in a sheet, and used them as filters using dashboard actions.
In my Education Viz I use a different method to show each country flag when you select a country using the Map Background Image feature. I learn this from the Tableau Community, and the steps to do this are as follows:
- Create two calculated fields for the X and Y axis, both calculated fields have to be =1, so just put “1” in the formula.
- Put the X calculated field in columns and Y in rows, and change the measure to average and change the marks color to transparent to hide it.
- Double click on each axis, and change them to Fixed with start at 0 and end at 1.
- Right click on each axis and uncheck the Show Header option.
- Drag & drop the filter you want to use in the Filter shelf and also the Detail shelf in the Marks Card.
- Click on the Map menu at the top and then Background Images and select the connection you want to use (you will see only one if you are using just one dataset).
- Now browse to the first image you want to use and set the right and top fields to 1.
- Click on the Options tab on that same window, click on Always Show Entire Image and then on the Add button, here you will have to select when do you want that concrete image to be shown, so first select the field you drag & drop in step 4 and then the concrete value on the new window. For example, if I want to show the UK flag, first select country and then select the value “United Kingdom” (if that’s how it’s spell in your dataset).
- Click Ok, and in the Background Images window make sure that in the Valid column it says “Yes”.
- Repeat steps 8 and 9 to add all the images you want.
- When you add all the images, click Ok in the Brackground Image window and check that it’s working correctly, now you can add that sheet to your dashboard and the image shown will change with your filter.
Here you can see how I used this tip and download the workbook if you need to.