At DS, when Andy say's "Who wants [insert a tableau feature]?", you know what it means: blogs topics! And I was given re-ordering an chart view with a parameter. This blog serves as a guide and intro on how to reorder any chart with a parameter action. The workbook and mock data can be found on my Tableau Public.
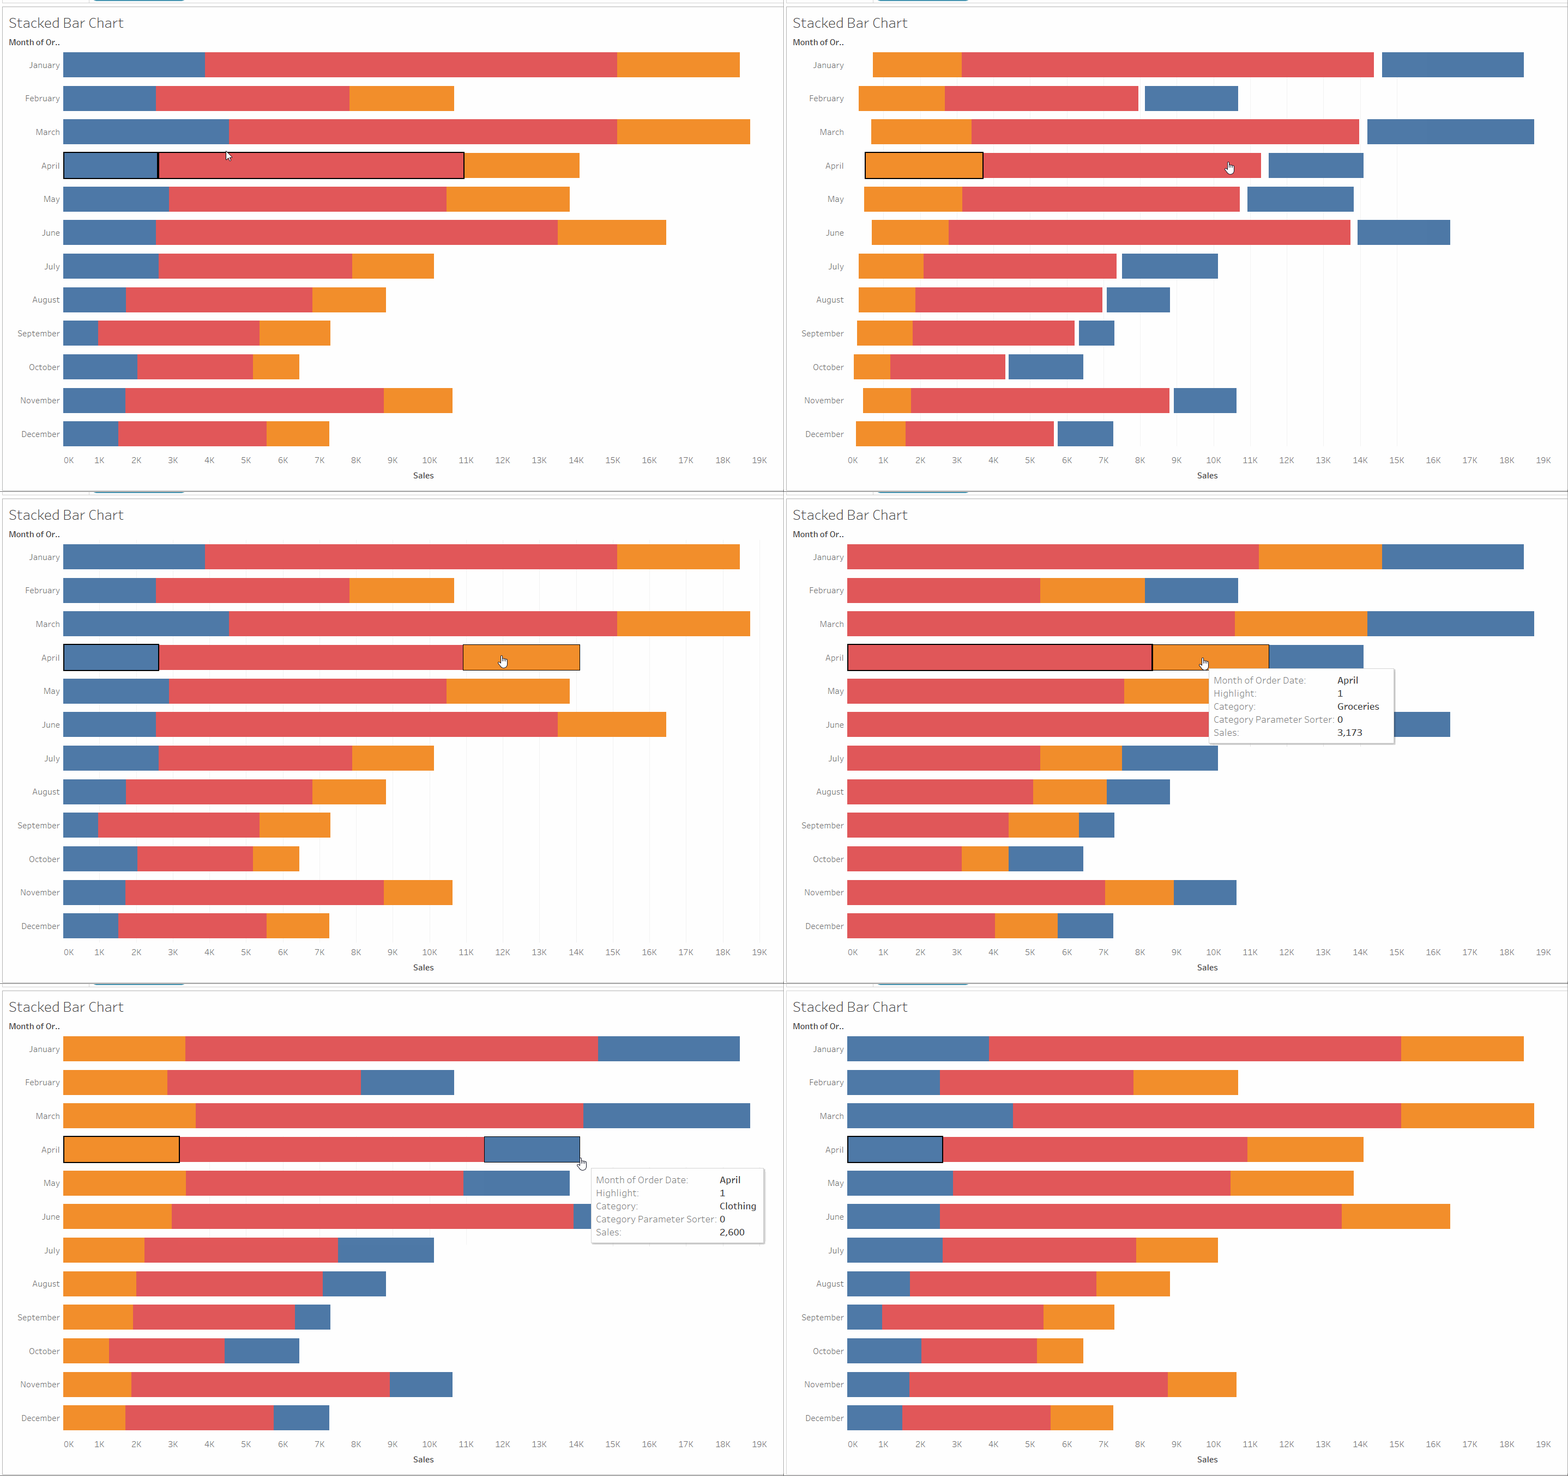
The word "parameter" may evoke imaginations of mathematics classes in secondary school. But the reality of parameters in Tableau are nothing further from that imagination. They can be very fun (view the feature image for reference - I had a lot of fun clicking the bright colours).
Parameters can do a lot, but when unconnected to anything are just a variable. In coding terms, I guess it would be like assigning x = 5 or "frog" or FALSE but then never using it again in the rest of the code. What's the point in a useless variable? When running the code below, nothing will output.
Or, indeed, a parameter unconnected to anything in your workbook? But we need to start with creating a parameter. The above is basically the same as the below but the functionality in Tableau is quite different. A parameter can be called in calculated fields, reference lines, and filters. And in this example, we will be using it to re-order a chart.
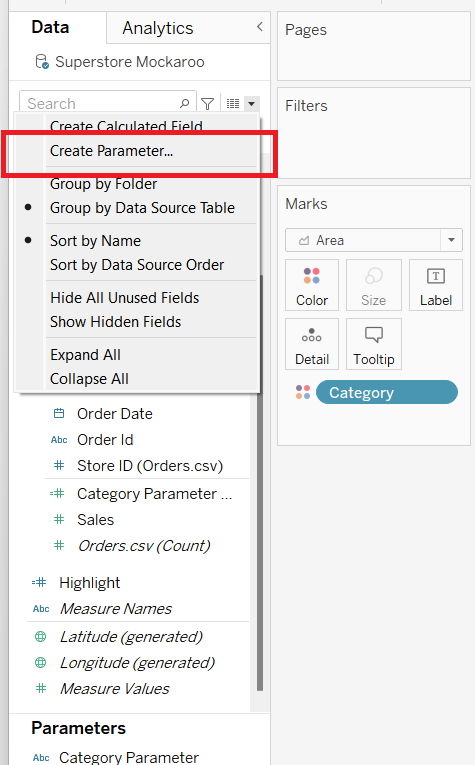
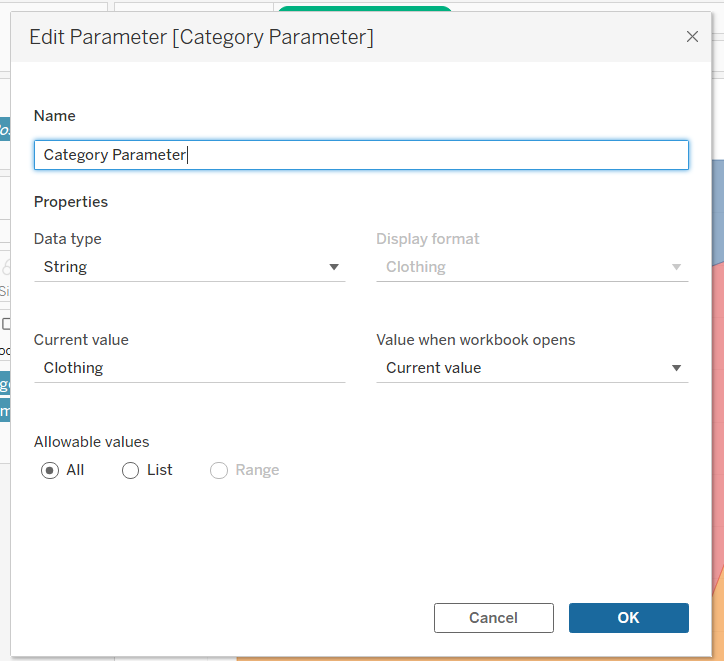
After creating a parameter on the category, it must be called upon in some way to be useful. For sorting, the parameter is plugged into a calculated field.

There are two ways in which this calculation can be configured. The first is a simple IF statement.
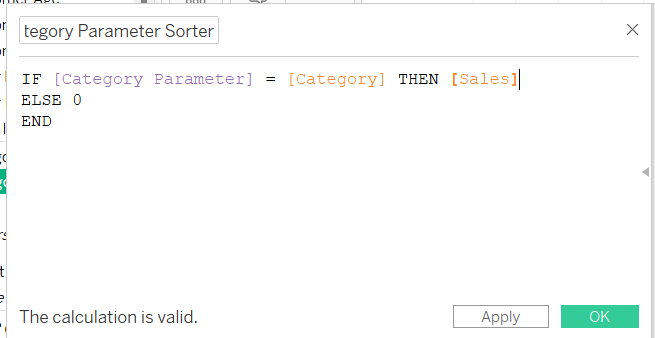
In plain English, if the parameter created is equal to the category selected then the calculated field will return the sum of the sales for that category; if a different category is selected then 0 will be returned.
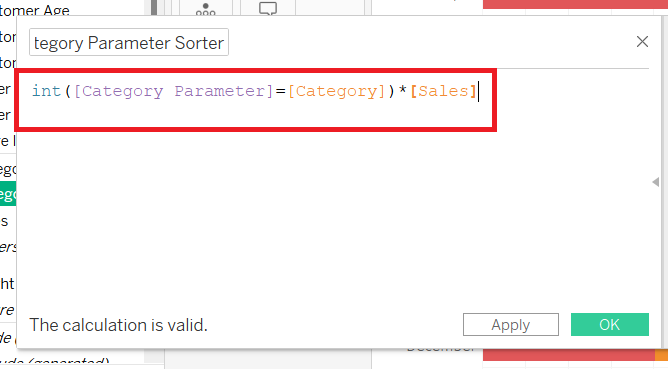
In the second configuration, the parameter = category part will return true or false, or, in computer terms, 1 or 0. Either the parameter equals the selected category (true) or it doesn't (false). When wrapping that equation in the function INT, it forces the result to be a 1 or 0 (instead of true or false). Then * Sales will multiply the sales by 1 or 0, returning the sum sales for the selected category and 0 for the categories not selected.
To allow this sorting to interact to the view, the category field will need to be sorted by the calculated field just created.
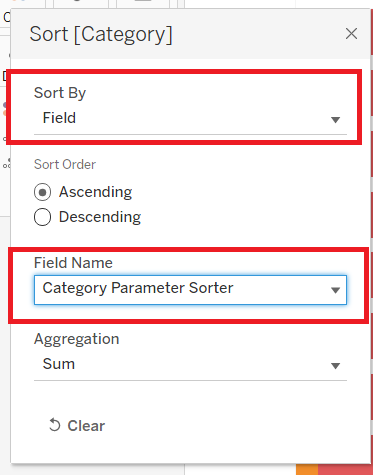
At this point, some bars may move, but that's the full extent of interaction that will happen. That's because the parameter will only ever be equal to "Clothing", and so the attached calculated field will not change, meaning the sort order will also remain unchanged. In order to make this sorting dynamic on selection, a parameter action is necessary. This must be created in the worksheet tab (as we are building a worksheet).
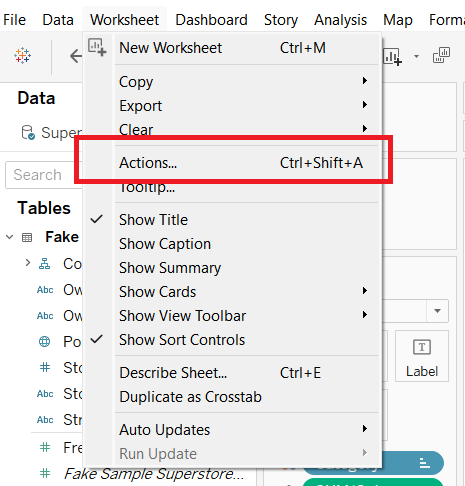
Adding a new action will give the option of a parameter action.
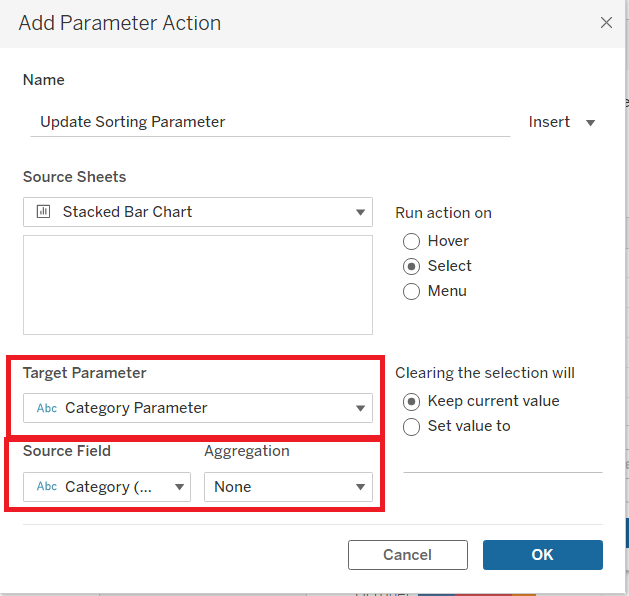
Finally, the sorting changes on selection. However, there is one more stylistic change that can be made. On selection, the other categories are greyed out. A highlight tool can be added to stop this from happening and allow for a clearer view. A fellow DS32 member has very helpfully written a blog on this very process.
Finally, sorting a bar chart with a parameter action.
In the workbook I have supplied (at the start), you will see a second sheet. I have made the chart: you can try to follow the steps above to make a sorting parameter action on this chart. Make sure you name the parameters, calculated fields and actions a different name to the ones I have supplied, and something sensible i.e. "area chart sort parameter" etc. Then you can to have as much fun as I did in the feature image, clicking the area segments to change the sort.
TLDR: A guide to making a sorting parameter action with a bar chart in tableau.
