


It's day two of Dashboard Week, and I am feeling much calmer than yesterday. For one, my hot water was working this morning, which is something I will not be taking for granted. And, despite my train being delayed, I managed to get to the office 10 minutes earlier than usual. But most importantly, sometime during my slumber, I foster a little more resolve to take on the challenges asked of us. Nothing like a hot shower and good night sleep to get those analytical ideas flowing.
These are just three tips and takeaways. A longer blog on the specific issues I encountered with Mockaroo will be up on this blog shortly.
Scope and Planning
This time, I wanted my time plan and scope in full view while working. One of my short-comings yesterday was that I didn't adequately read and comprehend the task and all it's smaller tasks.
So I kept the listed tasks and requirements with my plan on a word doc on the side of my screen. It's almost inevitable to have some unknown variables or difficulties that will cause a task to take longer than expected. Nevertheless, accountability on timings is also easier to be held against if it's in clear view.
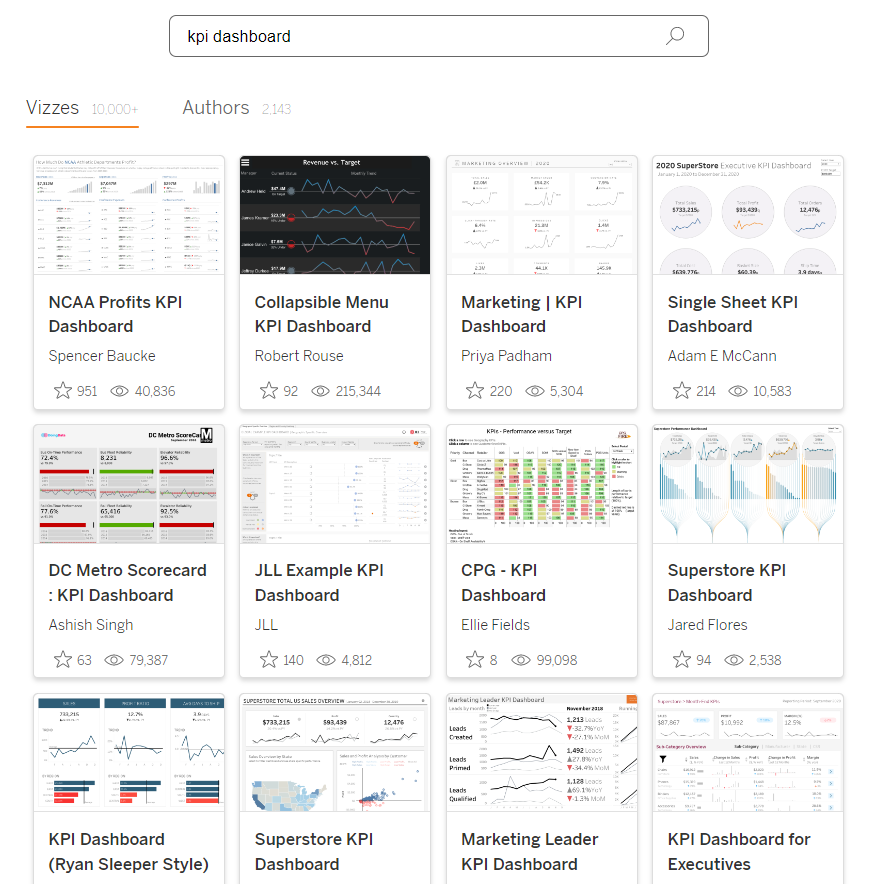
What is a KPI Dashboard?
The task today and yesterday asked for a KPI dashboard. Something I didn't ask myself in yesterday's task was 'what is a KPI dashboard' and instead created a dashboard made entirely of BANs. But today, I remedied that oversight and actually asked Tableau Public to answer.
Given this fresh view of KPI dashboards, my final dashboard (or report if you want to be Microsoft Power BI friendly) was drafted with a better vision.
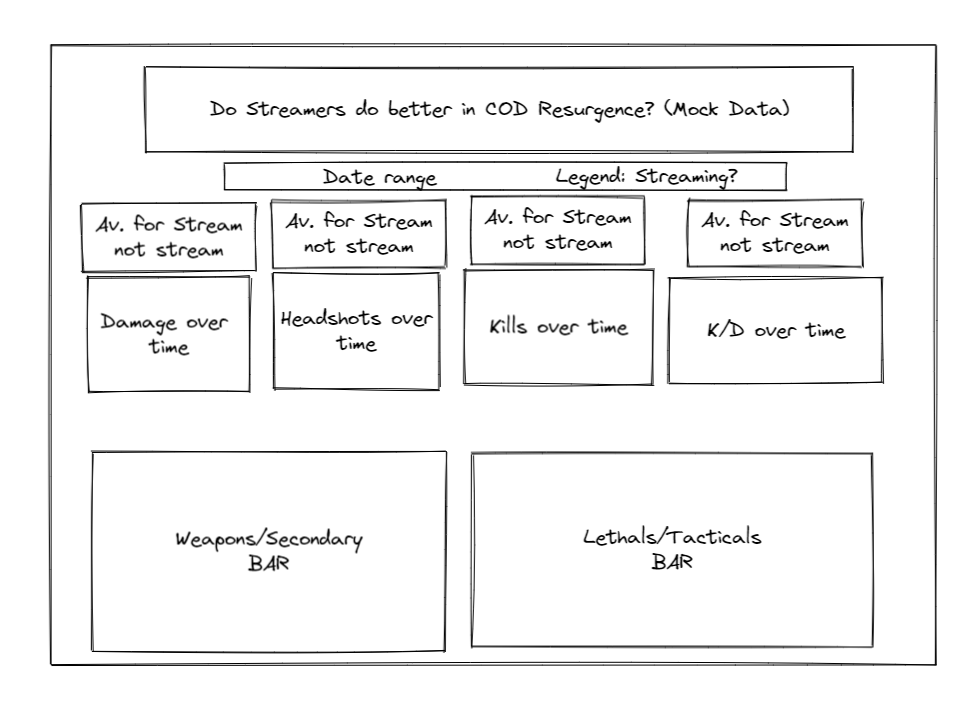
Although I didn't adhere to the sketch, it was helpful to plan and design properly before taking my hand to Power BI.
Mockaroo and saving files/schemas
I encountered countless issues with Mockaroo, all stemming from my ineptitude at using a Ruby centered tool. I wanted my data to make some sense and so created formula specific fields, formulas on formulas, distributions, faux random number to create some other randomness. Because of the complexity, I mistakenly navigated away or refreshed my page too many times I care to admit, before finally saving my schema. Looking at my final Mockaroo configuration below, you can imagine how annoying it was to keep remaking this due to my own user-error.
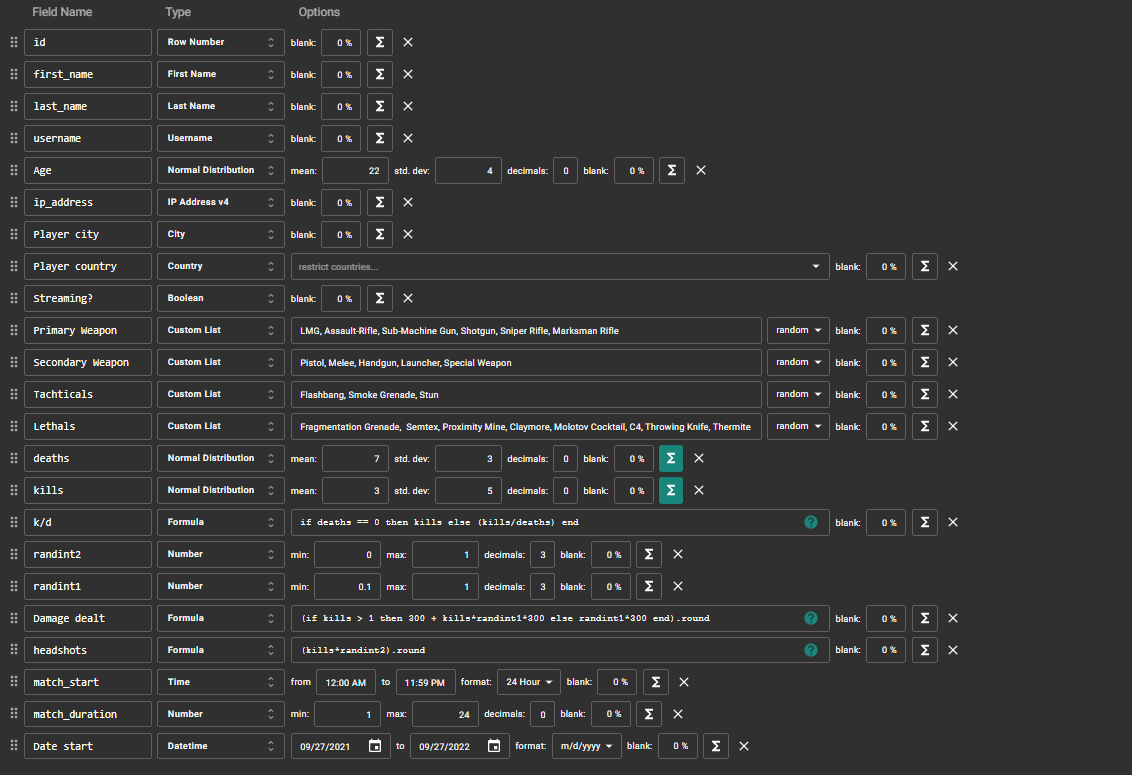
You may notice two teal sum icons: these are the formulas I created on the normal distributions to ensure no negative results. Needless to say, it was arduous and time consuming. But, I did gain a new appreciation for Ruby and a reminder to save my progress.
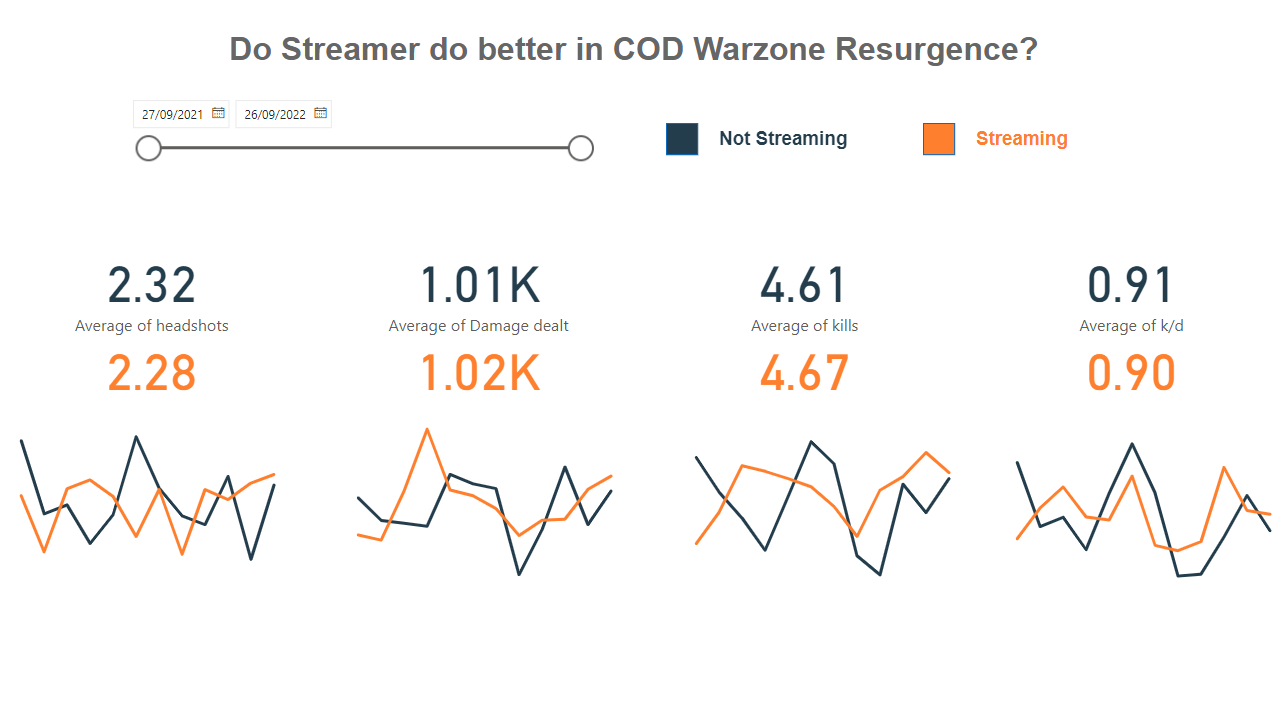
All that's left now, is to present! Wish me luck.