


A question I often face when making a dashboard in Tableau is "How do I best do X?" It could be sorting a percentage of total bar chart on a particular part of the total. It could be making a dynamic difference-from a selected sum. And the answer is often either a LOD or a table calculation. The warning always issued, however, is 'beware of LODs in big datasets'. This is because LODs will calculate on every row, whereas, table calculations will occur on the view, regardless of how many rows a dataset may have.
If like me, you are wondering how to traverse this issue going forward, the following examples may inspire you that LODs can be imagined as table calculations.
Example - Dynamic difference-from bar chart
To create the core chart, drag and drop profit on columns and sub-categories on rows. Both methods utilize a parameter, so let's create that first. 1. Name the parameter something meaningful. 2. Select the data type as string. 3. Select list in allowable values and 4. Add values from the sub-categories field in the drop down. And finally click OK.

Then we will need to link this parameter to the view through a calculated field and drag this new calculated field to the colour.
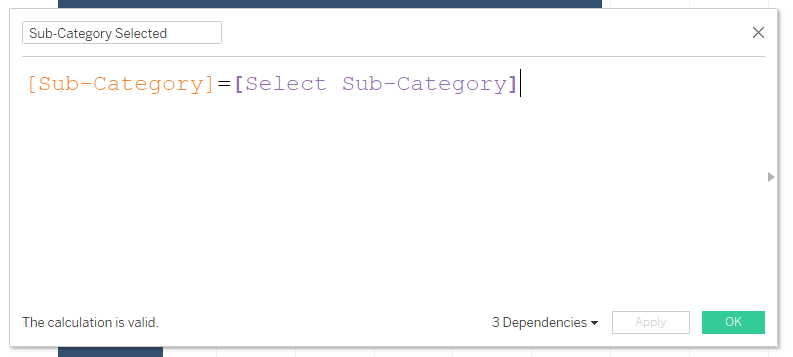
And finally, this parameter will need to change if a different sub-category is clicked. This can be done with an action in the worksheet tab.
LOD Method
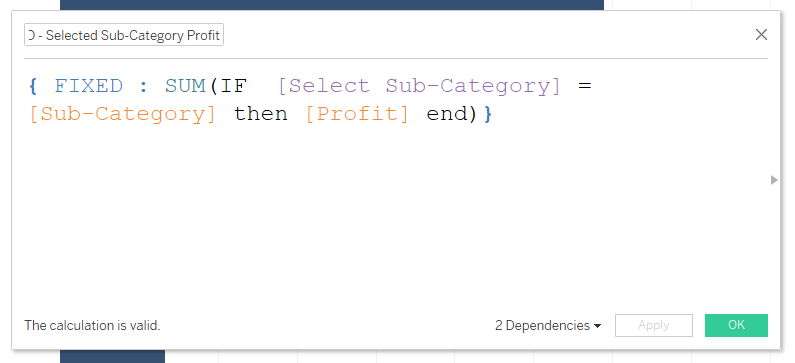
Two calculated field will be needed. The first will be to fix the sum profit of the selected sub-category to all the sub-categories.
Then to calculate the difference from this fixed total.
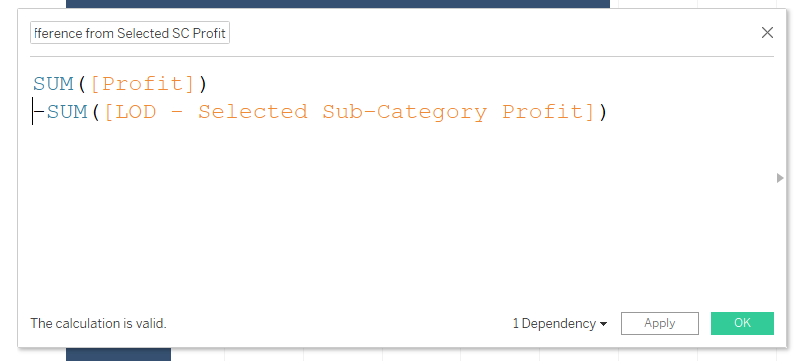
And finally drag the 'LOD - difference from selected SC Profit' calculation into the columns and voila!
Table Calculation Method
I would recommend duplicating the sheet and dragging the LOD off the columns to start the table calculation method. This is because the duplicated sheet will have a duplicated chart and action, saving you the precious seconds spent doing better more useful things.
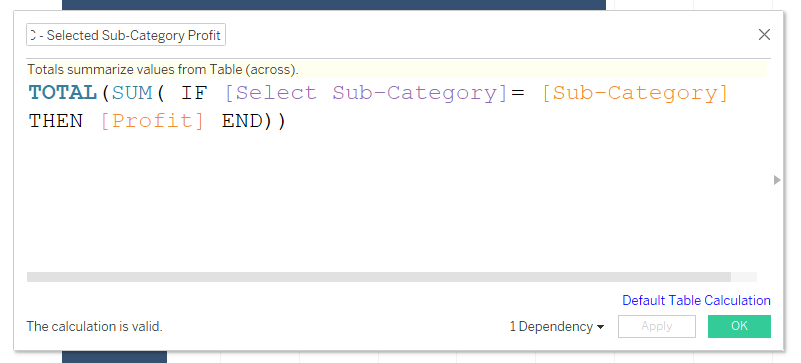
The table calculation to fix the sum profit of the selected sub-category to all the sub-categories is achieved by using 'TOTAL'.
And again, to calculate the difference from this total, a difference calculation must be created.
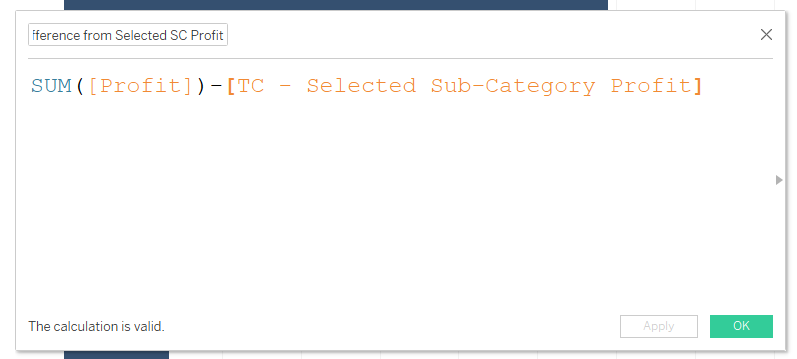
And finally, drag that 'TC - difference from selected SC Profit' calculation into the columns and voila again!

Gone are the days of slow performance due to overloaded LODs when a table calculation can suffice.
Follow this link [coming soon] for a second LOD to TC example.