Tableau Next is one of Tableau's newest platforms, centered around integration with Salesforce and its other products. It include features related to AI and LLMs to provide services previously unavailable to its users, in a platform familiar to Tableau's ecosystem. It has similar functionalities to another of Tableau's products in Tableau Cloud in its ability to create, host, and display data and data visualizations. However, its primary functionality revolves around Salesforce, which is what its functions were designed to focus on.
This blog will provide a brief overview of Tableau Next's Semantic Layer. The Semantic Layer is where Semantic Models live, where you can determine how your data is described and related. Its the backbone of any dashboard, and Tableau Next has some nice functionality with how you can define your Semantic Model.
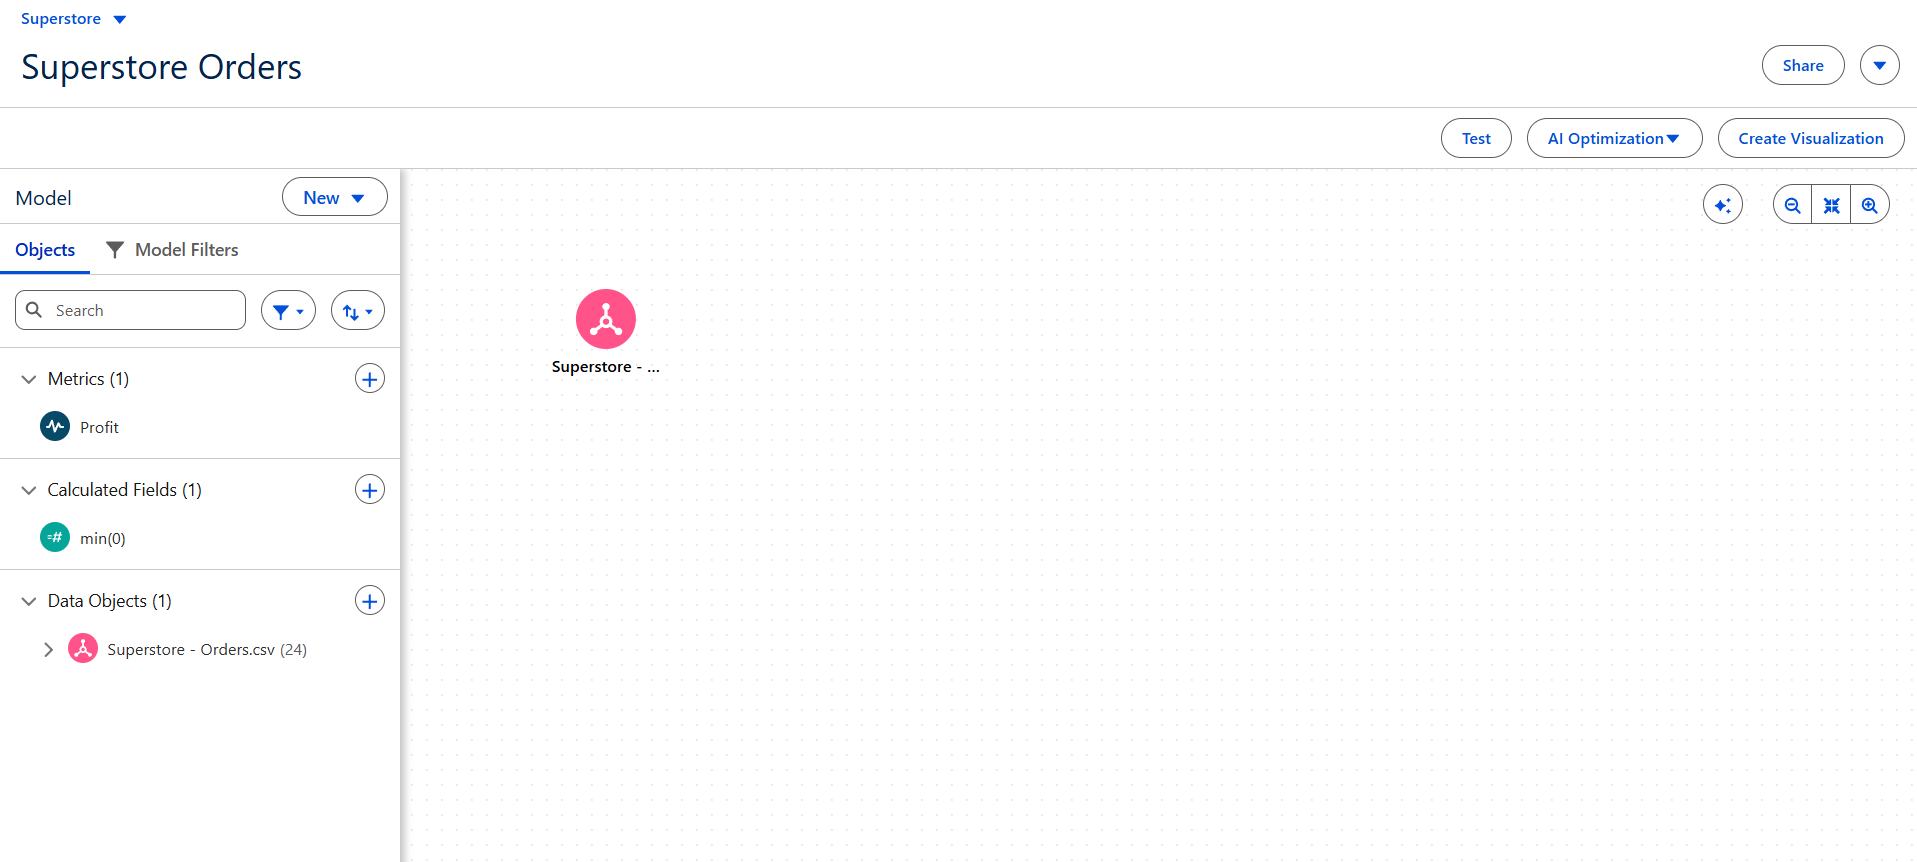
In the Semantic Layer, you can:
- Define Relationships - Similar to Tableau Desktop with defining joining fields.
- Create Calculated Fields - Same as Tableau Desktop with additional functionality to define aggregation and more.
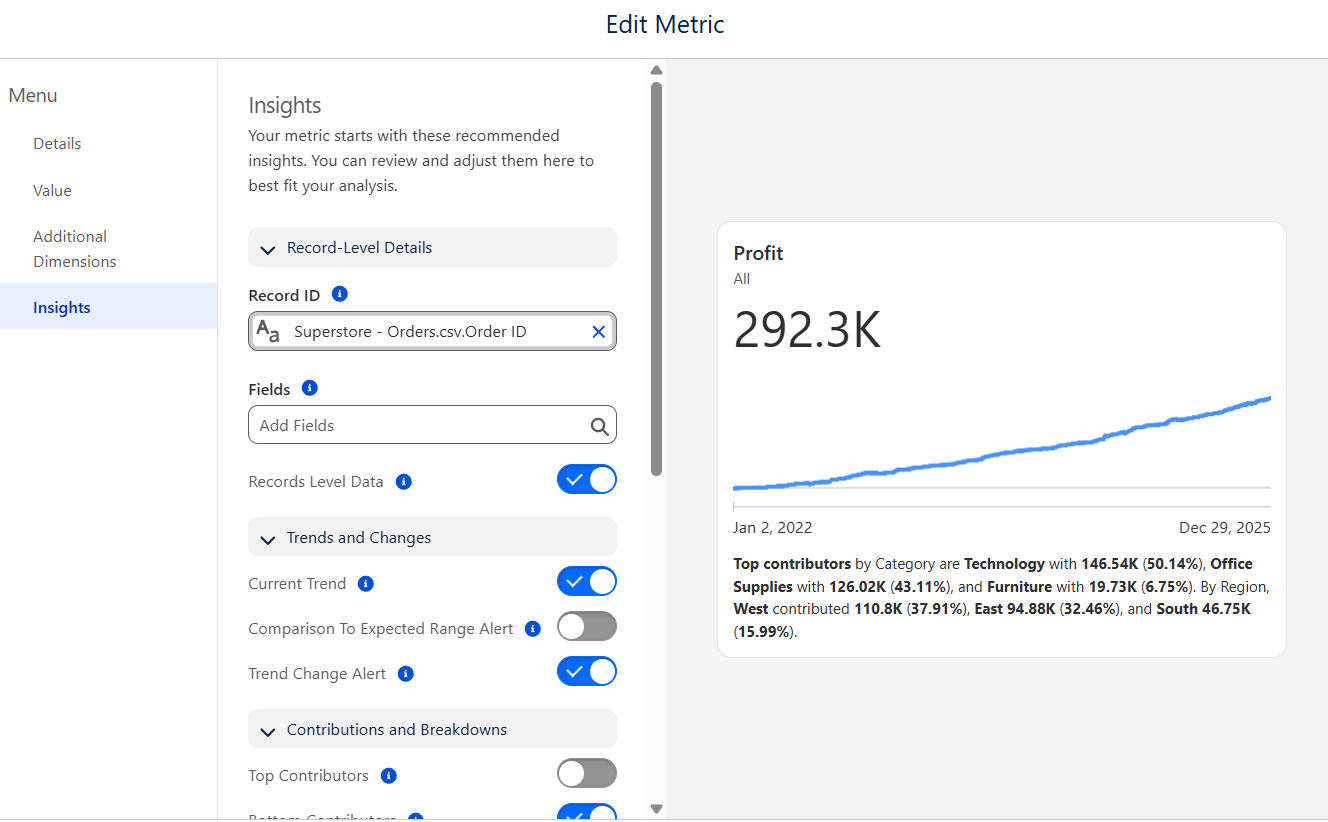
- Design Metrics - KPIs that are a part of the model and can be set up to alert on changes.
- Selecting and Renaming Fields - Keep only what you need from your data sources.
- Adding Logical Views - Create unions and joins to bring in as a single table.
- And more as updates continue to come!
Within your workspace, you can even create multiple Semantic Models based on your different data sources. This can allow for specific data models to be defined based on the dashboard that you are making.
Metrics are also a big part of what the Semantic Layer can do. These are a form of chart or KPI as would be more familiarly know to most dashboard users. However, they aren't linked to a specific dashboard or chart, and can be used to derive insights. Lots of options can be used to define your Metric, starting with your measure and time axis to create it from. Make sure to check them out!