


In week six at the Data School, we started covering Alteryx for the first time. Alteryx is another data preparation software that is older than Tableau Prep. It's designed specifically for data preparation with over 250 different tools that can be used to clean, manipulate, edit or do whatever other operations you need to do to the data.
To help build up and maintain your skills, there's plenty of challenges available to do. Last time when we covered Python vs Prep, we used Preppin' Data for the challenge to prepare a set of data ending with a set of requirements. This time, we'll be using an Alteryx Weekly Challenge, provided by Alteryx themselves. We'll be taking a look at Challenge #459: Fun Facts About LEGO® Sets! Part 1. You can find the package workbook as well as the original data files in the post.
To start, we'll begin by looking at our requirements and figuring out what steps we need to take to get from our input to our output. For our input, we have a table of each LEGO set and their properties, and another table containing theme ids and the name of the themes themselves. The outputs we need have us answering the following questions:
- Determine which LEGO set contains the largest number of parts.
- Determine which LEGO theme has the largest number of sets.
- Calculate the average number of parts per set for each year. Use integer as the data type for this task.
So then from these outputs, we can get the following steps to reach them from our input.
My steps for Challenge #459's solution:
- Load in the files into the program.
- Join the files together on the theme id from the set table to id from the theme table.
- For the first question, sort by the number of parts descending.
- Take the top 1 result from the table and output the results.
- For the second question, aggregate on the theme to count the distinct number of sets (from the set number).
- Sort on the distinct count of sets descending.
- Take the top 1 result from the table and output the results.
- And for the final question, aggregate on the year to count the distinct number of sets (from the set number), sum the number of parts and average the number of parts.
- Sort on the year ascending and output the results.
And now that we have our steps, we can implement them into both Tableau Prep and Alteryx.
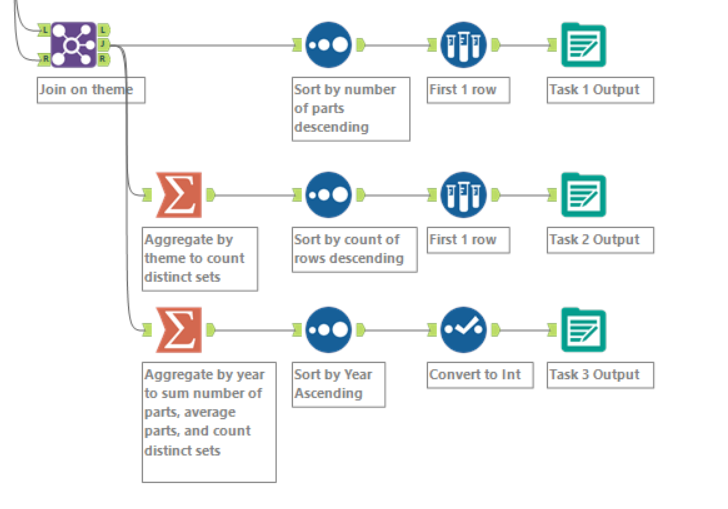
As this challenge was designed for Alteryx, it was decently nice to implement based on the plan that was made. Since there is a specific Alteryx packaged workbook to use, the data was already available in the workbook without any additional work needed on my end. This was the same with the solution, having the answer also available in the workbook to compare to.
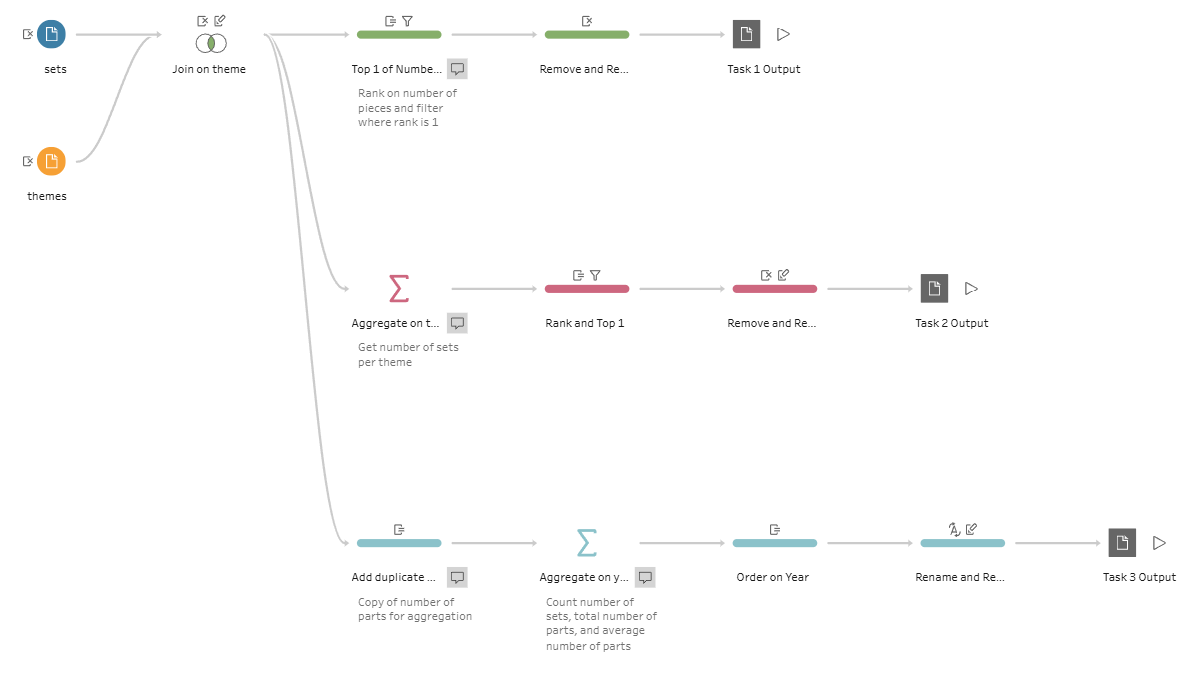
In Tableau Prep, the steps were similarly easy to implement, especially after I had done it in Alteryx. It gave me a foundation for how to actually create the steps within the tools, but having its own differences.
For the differences that I noticed between the two applications, the most clear was how much easier it was to sort by a field in a table in Alteryx. Since we needed to take the top one for two of the outputs, Tableau Prep had me creating a ranking on the field I wanted to sort by, then filter to only keep where the rank was equal to one. This was especially clear with the third output as I needed to retain the order. I couldn't remove the field that I needed to have for the ranking to order by, instead needing to hide it.
Within Alteryx, there was specific steps for what I needed to do: sorting by a field and taking a top N rows, which had nice tools to do exactly what I needed. In addition, I could use a field multiple times for a single aggregation step, while in Tableau Prep, I needed to create a duplicate field to make each aggregation. However, Alteryx was less convenient when it came to changing data types, renaming, removing, and reordering fields as Tableau Prep has that as an option to be done in each step while Alteryx needs a separate step for that action.
Overall, both tools have their own benefits. Alteryx is specifically designed for data preparation and is able to handle more specific circumstances. On the other hand, Tableau Prep can have a more intuitive usage when dealing with fields overall and has the ability to preview the current state of the data in Tableau.