


If you have a dashboard you need to optimise for performance and need some help on where to begin, or if you are developing a new dashboard and know performance is a priority from the start, guessing which aspects are causing a performance bottleneck is inefficient.
Instead, you can use Tableau’s built-in tools to provide a foundation for performance optimisation. The Workbook Optimiser can help you catch easy optimisation wins before publishing, whilst the Performance Recorder can provide more specific details required to troubleshoot deeper performance issues.
The Workbook Optimiser
The Workbook Optimiser is an evaluation tool that identifies whether a workbook follows standard performance best practices. It runs an algorithm against the underlying metadata of your workbook to scan for common issues such as hidden layout containers, unused fields, or overly complex calculations.
Anything that processes slowly in Tableau Desktop will also process slowly in Tableau Cloud/Server, making the Optimiser an excellent starting point to determine where your workbook requires attention before you release it to end users.
It is important to keep in mind that the Optimiser relies on an algorithm and does not understand the business context of your dashboard. It may flag elements that are non-negotiable for your team to remove. The results provide a great starting point of where in your workbook to look at for optimisation, but your own judgement is needed to weigh potential performance gains against the functionality your users need.
Running the Workbook Optimiser
The steps to run this tool depend on whether you are using Tableau Desktop or working in a web browser.
Tableau Desktop:
- Navigate to the top application menu
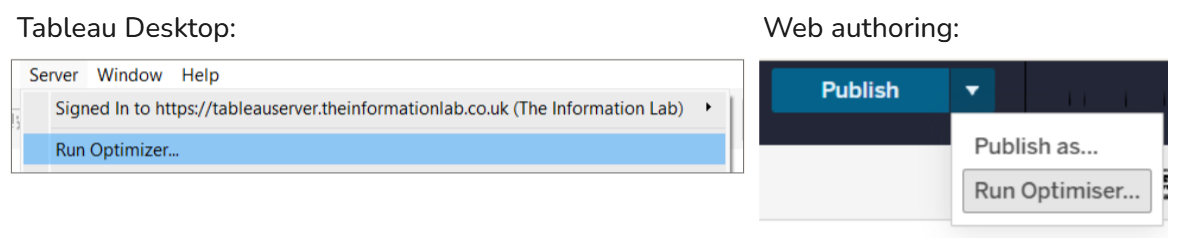
- Select Server > Run Optimiser
Tableau Cloud/Server (Web Authoring):
- Open the workbook in edit mode
- Navigate to the top application menu
- Select Publish > Run Optimiser
Interpreting Optimiser Results
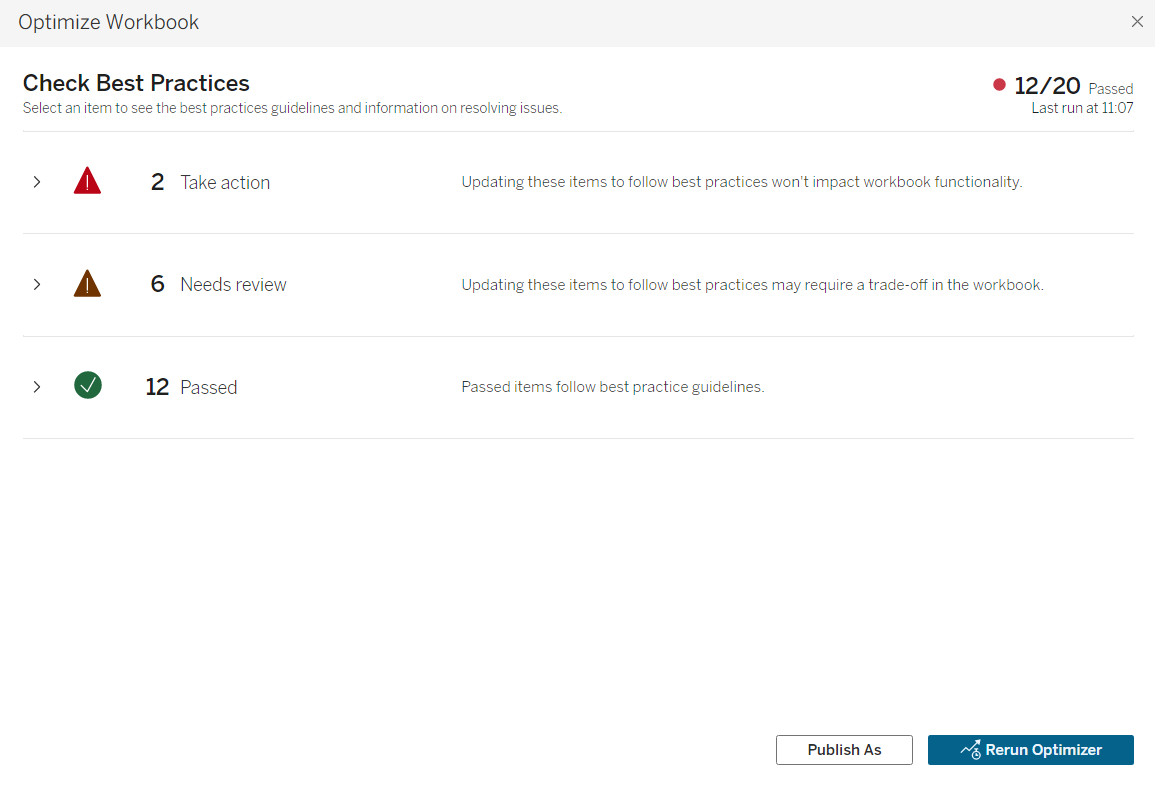
Once the Optimiser runs, a window pops up which categorises its findings into three distinct buckets to help you prioritise your next steps. You can expand each category using the dropdown arrows to see the specific details.
Take Action
These are objective improvements that will reduce processing time without altering how the dashboard functions for the end user e.g. deleting unused fields. Some rules in this category feature an Autofix button, allowing Tableau to resolve the issue automatically.
Needs Review
These suggestions require architectural decisions and human judgement. For example, it might suggest breaking a large dashboard into multiple smaller ones or altering a calculation. You must weigh the performance gain against the resulting change in user experience.
Passed and Ignored
This section confirms the parts of your workbook that currently meet best practices. It also houses any rules you have manually dismissed. If a flagged item in a previous category must remain exactly as it is for your team, you can click the Ignore rule button to mute that recommendation.
The Performance Recorder
After resolving initial performance flags from the Workbook Optimiser, you might find your dashboard is still running slowly. In this case, the Performance Recorder can provide more detailed data required for troubleshooting. This feature acts as a diagnostic stopwatch, logging the exact time Tableau spends on different background processes as you interact with a dashboard.
You can implement this tool in different ways, for example:
- Proactive recording: Taking a reading on your first complete dashboard draft to highlight issues and resolving them before you release the dashboard to users
- Reactive recording: Taking an existing slow dashboard and running a recording to gather targeted data to optimise it effectively
Running a Performance Recording in Tableau Desktop
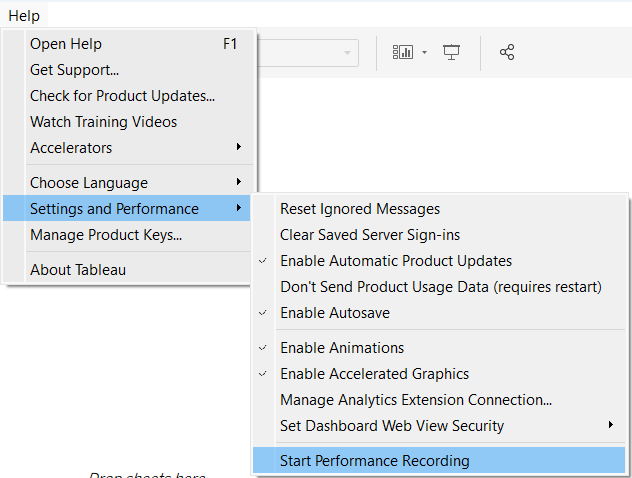
- Navigate to the top menu and select Help > Settings and Performance > Start Performance Recording
- Interact with the dashboard to simulate a normal user experience. Click on filters, adjust parameters, navigate between tabs, and interact with the visualisations.
- Once you have recorded enough actions, navigate back to Help > Settings and Performance > Stop Performance Recording.
As soon as you click stop, Tableau will automatically generate and open a temporary workbook containing a breakdown of the performance metrics. Save this file as you normally would if you want to keep a record for optimisation purposes.
Running a Performance Recording in Tableau Cloud
Taking a performance reading in Cloud requires a slightly different set of steps. A prerequisite is that a Site Administrator must enable the Record workbook performance metrics option within the site settings, as this is typically turned off by default. Once that is enabled:
- Open the target dashboard in the standard view mode. If you look at the web browser address bar, Tableau appends a session ID to the end of the URL (for example, ?:iid=1 or &:iid=1)
- To start recording, insert the command :record_performance=yes& immediately before that session ID. The modified URL should look similar to ...?:record_performance=yes&:iid=1
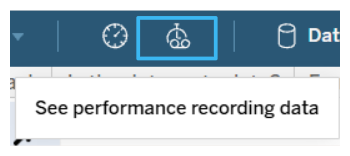
- Press Enter to reload the view. Tableau is now recording in the background (should see stopwatch icon appear, as pictured below)
- Interact with the dashboard normally
- Once finished, click the new stopwatch icon (labeled Performance) that appears in the view toolbar
- Tableau will generate an up-to-the-minute snapshot of the performance data in a new tab
This output is a less detailed version compared to Desktop, providing a Performance Summary aimed at optimising front-end metrics.
Common Performance Events
When you open your generated performance recording workbook, you will see a list of processes that Tableau was running in the background. To understand the results in both the Performance Summary and the Detailed Views, you first need to understand what these event names mean.
Tableau categorises backend work into specific event types. While this is not an exhaustive list, the following are common events you can encounter during a performance analysis.
Interpreting the Performance Summary
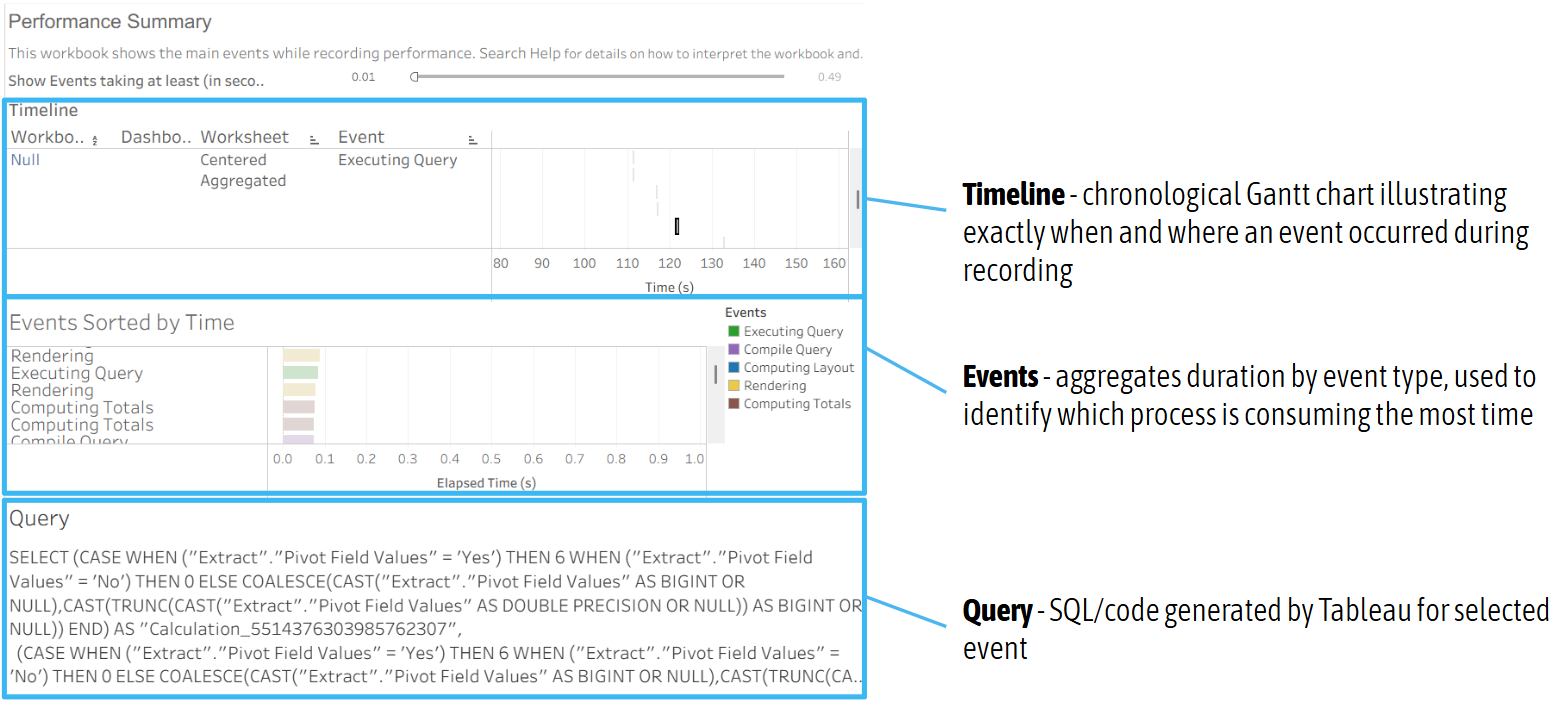
Both Desktop and Cloud/Server generate a Performance Summary view. This dashboard provides an overview of the most time-consuming events.
The Timeline
This is a chronological Gantt chart at the top of the dashboard. It shows you exactly when an event started, how long it lasted, and how it overlapped with other processes.
The Events View
Located below the timeline, this section aggregates total duration by event type and is colour-coded. This allows you to easily look for the longest bars and identify which event type took the most time.
The Query View
Clicking any bar in the timeline view will populate this section, revealing the exact SQL or Hyper code Tableau was executing at that specific moment.
Detailed Views (Desktop Only)
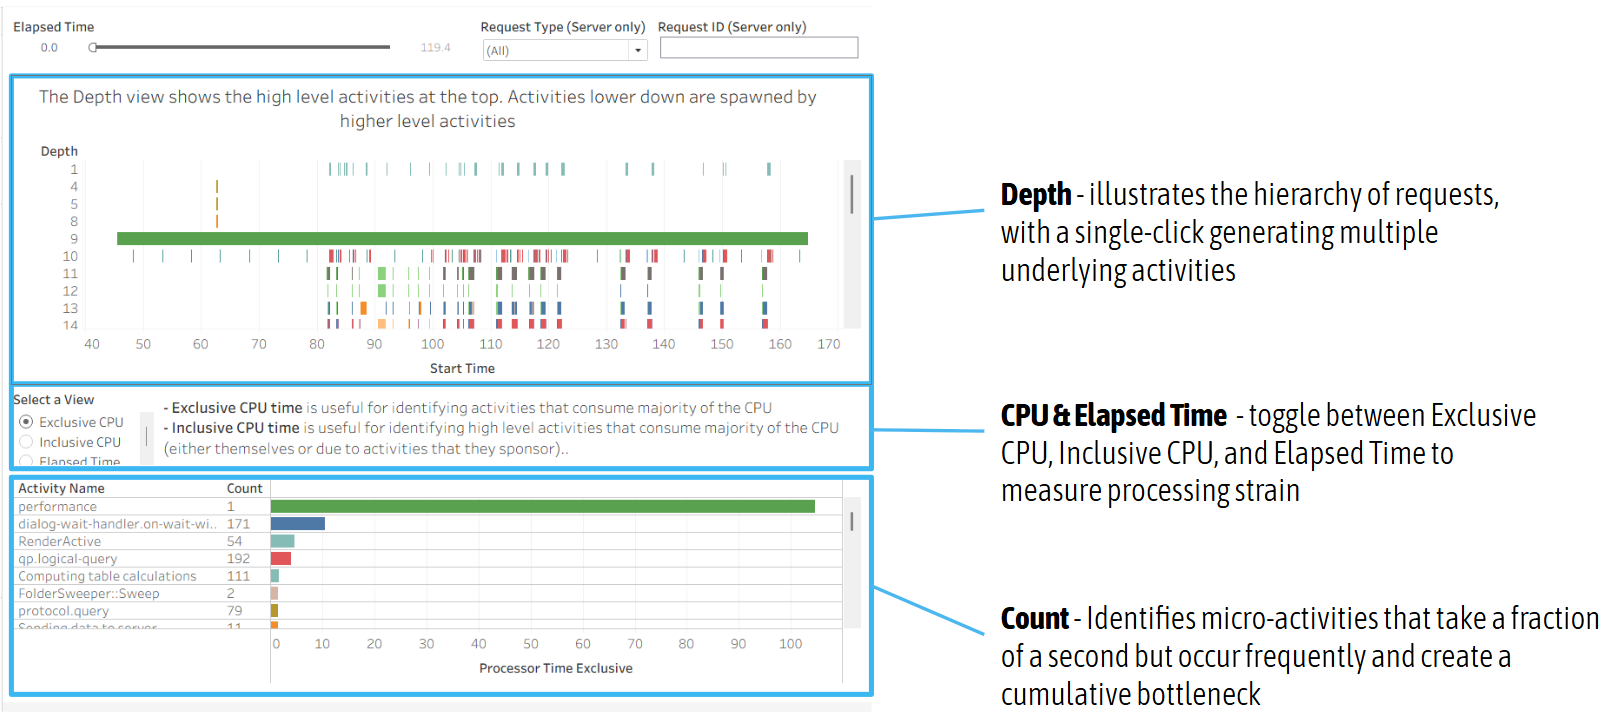
The Desktop performance output includes an additional tab named Detailed Views. This tab provides a detailed look at the backend processing for more advanced troubleshooting.
The Depth Chart
A single user action, such as clicking a filter, requires Tableau to execute a hierarchy of dependent tasks. The initial user request registers at the highest level as a parent task. To fulfil this request, Tableau must execute multiple sub-tasks beneath it, such as loading worksheets, compiling queries, and computing layouts. Many of these sub-tasks will trigger their own subsequent processes. The y-axis displays this nested relationship, while the x-axis tracks execution time. By locating a long bar at the top of the hierarchy and scanning below it, you can investigate underlying tasks responsible for the delays.
CPU Metrics and Elapsed Time
Hovering over any bar in the Depth chart highlights its corresponding row in the CPU and Elapsed time views located toward the bottom of the dashboard. These metrics reveal whether the processor was actively or just waiting.
- Elapsed Time: The total real-world time a task took from start to finish
- Inclusive CPU: The total processing power consumed by a main task, including all the smaller sub-tasks required to complete it
- Exclusive CPU: The processing power consumed strictly by that specific individual task alone, excluding effort spent on the sub-tasks beneath it
You can compare Elapsed Time to CPU time to find the root cause. If the Elapsed Time is 10 seconds but the CPU time is only 1 second, Tableau was just sitting idle waiting for a network or database. If both metrics are high, the Tableau processor is actively struggling with complex calculations or visual designs.
The Count View
Located at the bottom of the dashboard, the Count view tracks how many times an event occurred. Sometimes a dashboard is slow not because one single query takes 10 seconds, but because a minor calculation taking 0.1 seconds is forced to run 100 times. This view allows you to identify these repetitive bottlenecks.
Summary
Applying performance best practices during development requires consistent validation, and these built-in tools provide information helpful to keeping performance on track. By establishing a routine of running the Workbook Optimiser on your initial drafts, you can eliminate easy mistakes before they become ingrained in your design. When deeper performance issues persist, running a performance recording provides the detailed information to help you understand where the Tableau engine is struggling. Using these two tools can help you to understand how to maintain performance without sacrificing the functionality your users require.