


Filters can act as a double-edged sword in terms of performance. On one hand, they can be used to limit the volume of data passed to the view. Using filters ensures Tableau only queries and renders the exact subset of data required, and processing less data results in faster querying and rendering. On the other hand, ineffective filter design, particularly with filters lower down in the order of operations or simply having too many filters, can slow down performance.
The Filter Order of Operations
Understanding the order of operations for filters helps you know exactly when to filter data. Applying a filter at the wrong tier forces the database to process more data than necessary. The filter execution order is as follows:
- Extract Filters: These execute only when generating a Hyper file. They can be used to physically restrict what data is pulled from the database into the extract, reducing the overall file size.
- Data Source Filters: These apply across the entire live connection/extract. They are appended to every query sent to the underlying data source.
- Context Filters: Context filters force Tableau to apply a specific filter before any standard dimension or measure filters.
- Dimension and Set Filters: These apply standard WHERE clauses to the query based on categorical data.
- Measure Filters: These apply a HAVING clause, filtering data after it has been aggregated at the level of detail of the view.
- Table Calculation Filters: These are processed locally by the Tableau rendering engine. They do not change the underlying backend query, instead simply hiding data from the visual on the screen.
Understanding this order can help you to control the logical sequence of filtering to compute answers accurately and simplify backend queries.
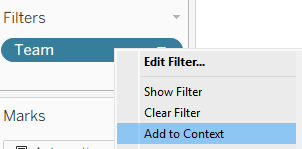
For example, consider a scenario where you want to display the Top 10 team members by sales within a specific 'Team'. Standard dimension filters and Top N filters compute independently. If you leave both as standard filters, Tableau evaluates the Top 10 globally across the entire dataset, and then only displays the players from that global Top 10 who happen to belong to the selected team. By right-clicking the 'Team' filter and selecting "Add to Context", you force the database to evaluate the team filter first. The Top 10 filter is then evaluated against a much smaller subset of data, returning the correct players for that specific team and executing the query faster.
Rendering Filter Controls
While filters limit data in the final visualisation, the interactive dropdown menus provided to the end user generate their own query load. When a dashboard opens, Tableau must scan the dataset to return a distinct list of every possible option for that field. The database executes these distinct queries simply to determine what text to display in the UI.
Providing a dashboard with multiple interactive quick filters means the database is heavily scanned before the user even begins interacting with the data.
Filter Control Performance Tiers
The specific UI control type you choose dictates how heavily the database is queried.
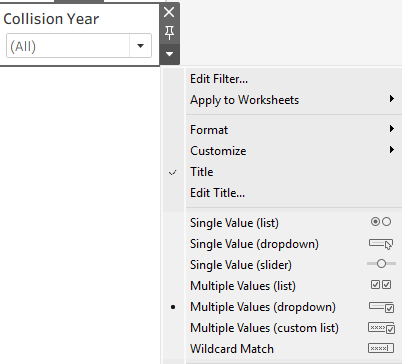
- Fastest Controls (No UI queries): Custom Value List, Wildcard Match, Relative Date Filters, and Browse Period Date Filters. These do not query the database upon load because the user inputs the criteria manually or relies on relative system time.
- Medium Controls (Min/Max queries): Measure Filters and Ranged Date Filters. Tableau only queries the database for the absolute minimum and maximum values to render the endpoints of the slider.
- Slowest Controls (Full distinct queries): Multiple Value List, Single Value List, Compact List, and discrete sliders. The engine must scan the dataset, find every unique field value, and render the menu.
Filter Configuration
To reduce query execution time, you can configure your filters as effectively as possible to maximise performance.
Limit "Show Only Relevant Values"
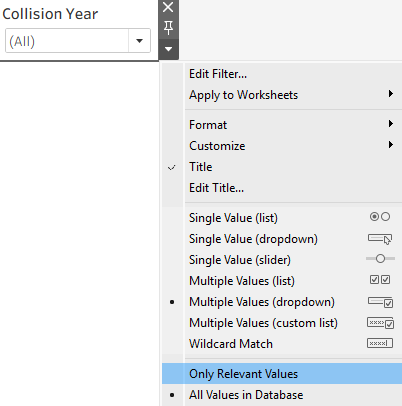
By default, Tableau filters show all values in the database. You can change this setting to "Show Only Relevant Values", which restricts the options in one filter based on the selections made in another.
Every time a user interacts with a filter, Tableau must execute a new query to update the option lists of all other filters set to show relevant values. This cascading query behaviour compounds quickly and can slow down rendering speed. Instead, you could use natural hierarchies (e.g. filtering on Country before filtering on City) to guide the user.
Batch Queries with the Apply Button
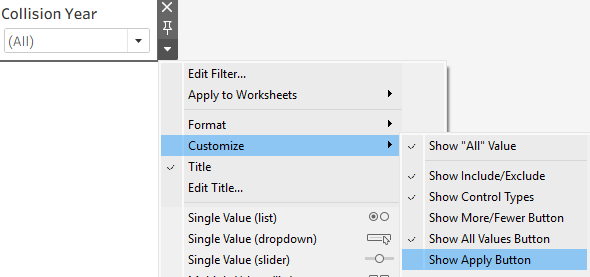
When users make multiple selections in a standard checkbox filter, Tableau sends a separate query to the database for every single click. Using the Apply button pauses the query execution until the user has finished making their selections. This batches the requests into a single query to the data source.
Favour Ranges Over Itemised Lists
When you provide a user with a dropdown list of specific numbers, Tableau generates an IN array containing every selected value. The database must evaluate every single row against this long list. Very large lists can even force the database to write a temporary table to process the filter.
Using a continuous range filter (such as a slider set to values greater than 500) generates a much simpler query. Tableau passes a BETWEEN operator (or simple greater-than/less-than logic) to the database. Relational databases use native indexing to evaluate these operators highly efficiently.
Continuous Dates vs Discrete Dates
Continuous date filters (relative and range-of-date filters) are generally faster than discrete date filters. Continuous dates allow the database to use its native indexing to point to a specific timeframe.
Discrete date filters require the database to evaluate individual date parts. Specific date functions like MY() and MDY() require heavy processing. If your database table is partitioned by date, and the specific DATEPART value you are filtering is not part of the partition key, the database is forced to scan every single partition.
To optimise discrete dates, materialise the specific date part. If you are using a Hyper extract, create a calculated field that implements the DATEPART function and ensure it is materialised into the extract as a physical column. This allows the Tableau engine to index the column directly.
Parameters
You can replace standard quick filters with parameters to further reduce query load. Parameters replace quick filters by passing a single value into a calculated field.
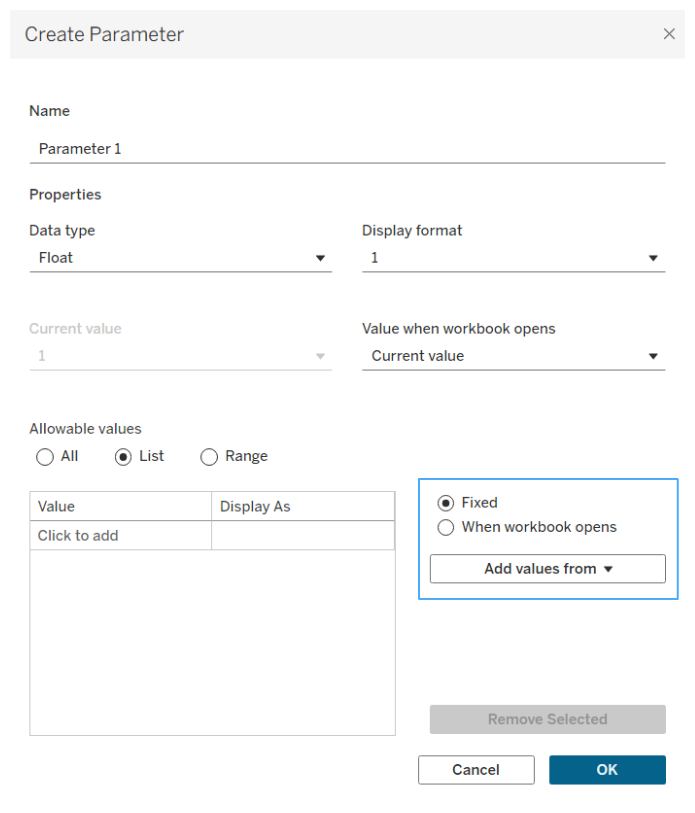
A static parameter uses a manually typed list of options. Because the list is hardcoded into the workbook, zero queries are sent to the database to populate the dropdown menu. A dynamic parameter loads its options from a database field. While this does require a query, it executes exactly once when the workbook is opened. The results are cached, preventing any secondary UI queries during the user session.
The limitation of a parameter is that it can only pass a single value at a time, preventing multi-select functionality, but can be a performant alternative for single-select filtering.
Conclusion
Effective filter design requires balancing necessary user functionality with performance. While filters are necessary to restrict data volumes, relying heavily on discrete dropdown menus and showing relevant values can increase dashboard loading times. By understanding the query pipeline, promoting filters to context when logically necessary, and favouring continuous sliders or parameters over discrete lists, you can reduce the processing times and improve the overall user experience.