


Valorant is a first person shooter game by Riot Games, for this blog I will show you how I used a publicly available API to retrieve the game data, which I can transform and clean to potentially create a dashboard which allows users to understand character selection to optimise their in-game activity.

The API source is available from here: https://dash.valorant-api.com/endpoints/agents
You can also explore a list of other publicly available APIs here: https://github.com/public-apis/public-apis#science--math
Steps of the process
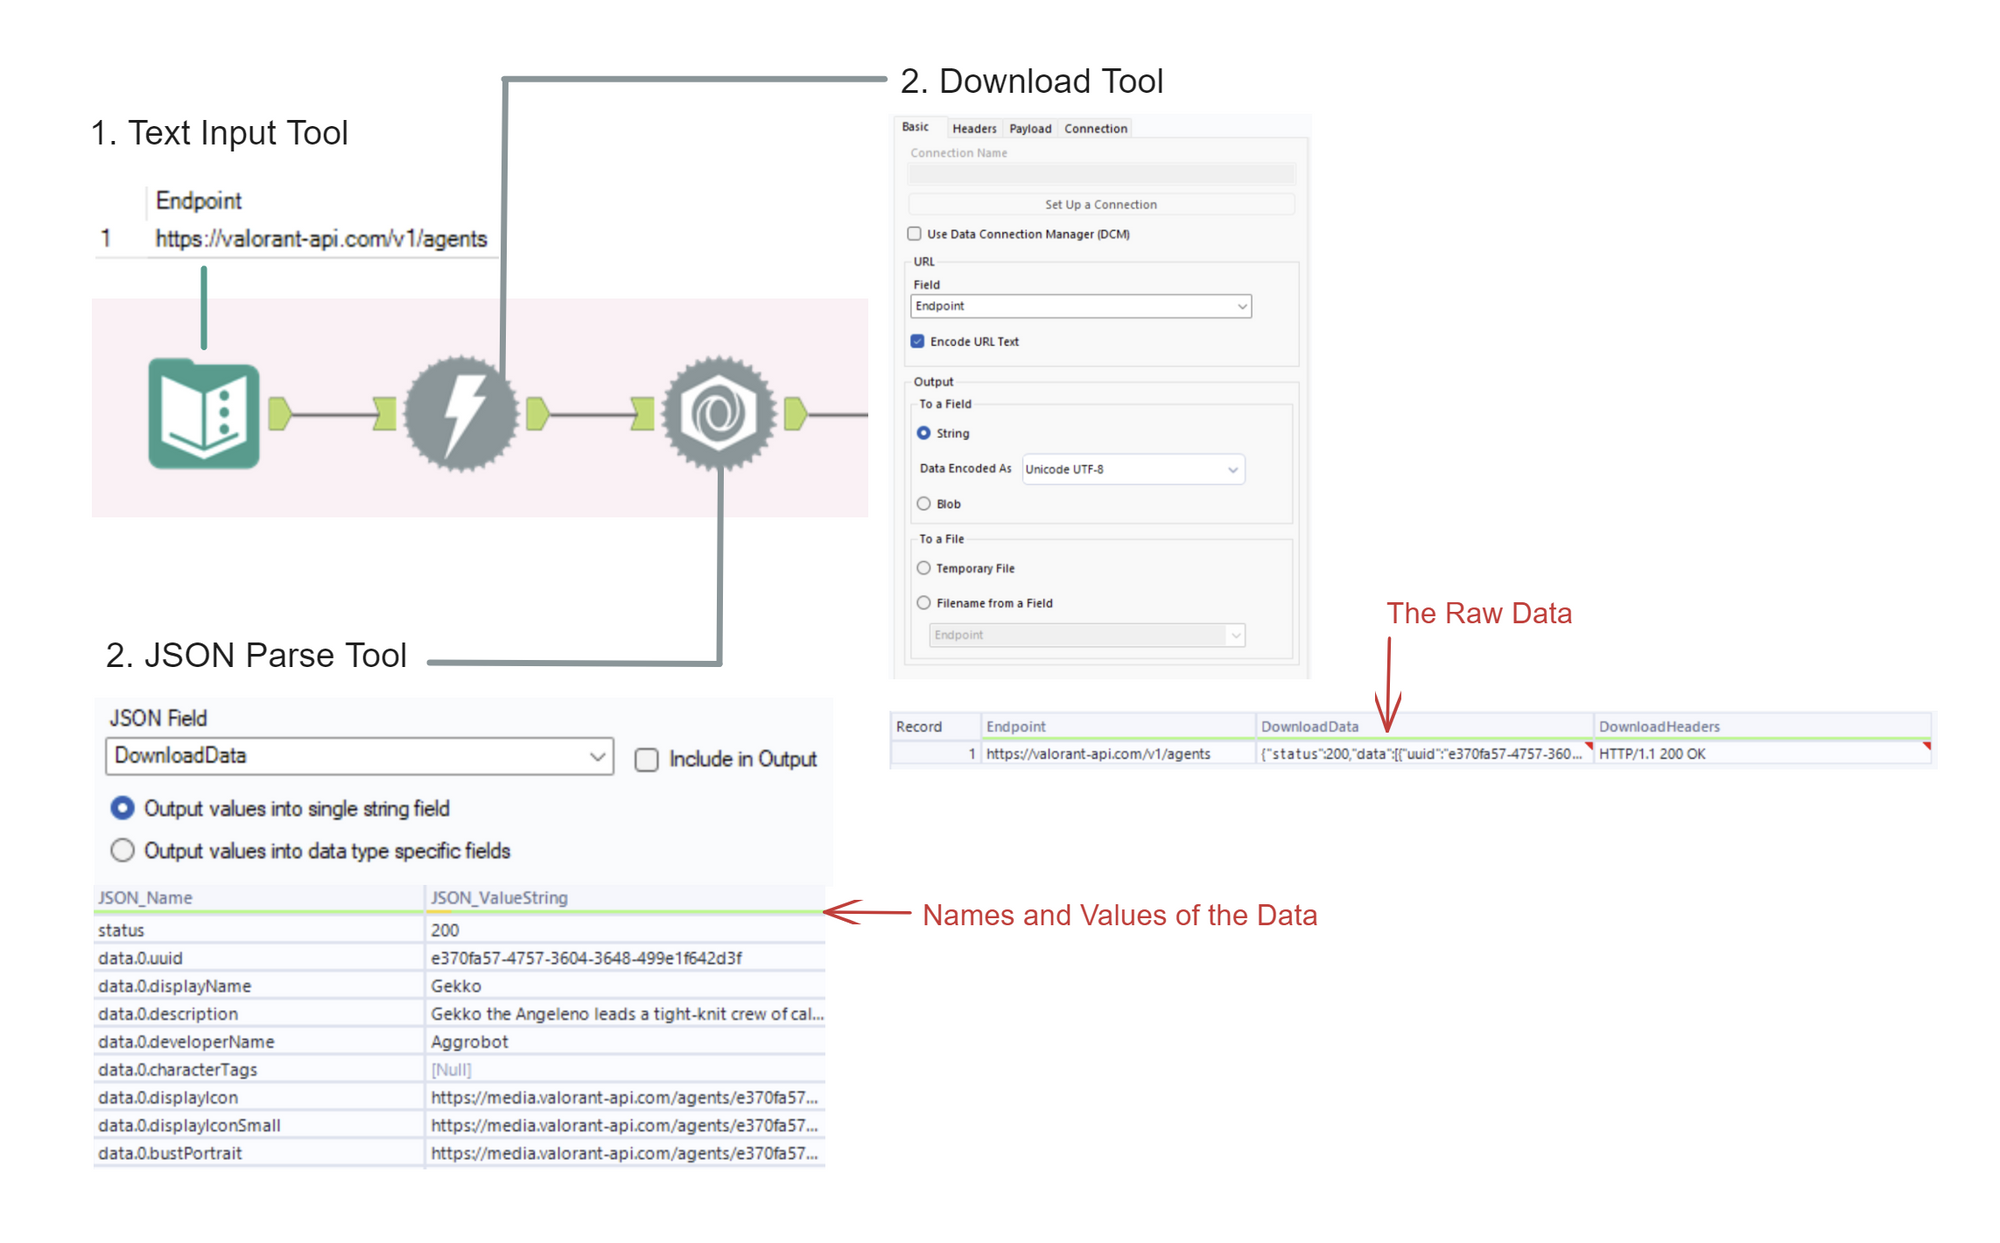
- Use a text input tool and insert your API (https://valorant-api.com/v1/agents), name this field 'Endpoint'
- Connect a download tool, untick use data connection manager, choose Endpoint as the field, and click string for the output.
- Next, add a JSON Parse tool, this will change the downloaded data from the JSON format to two columns of Name and Value.
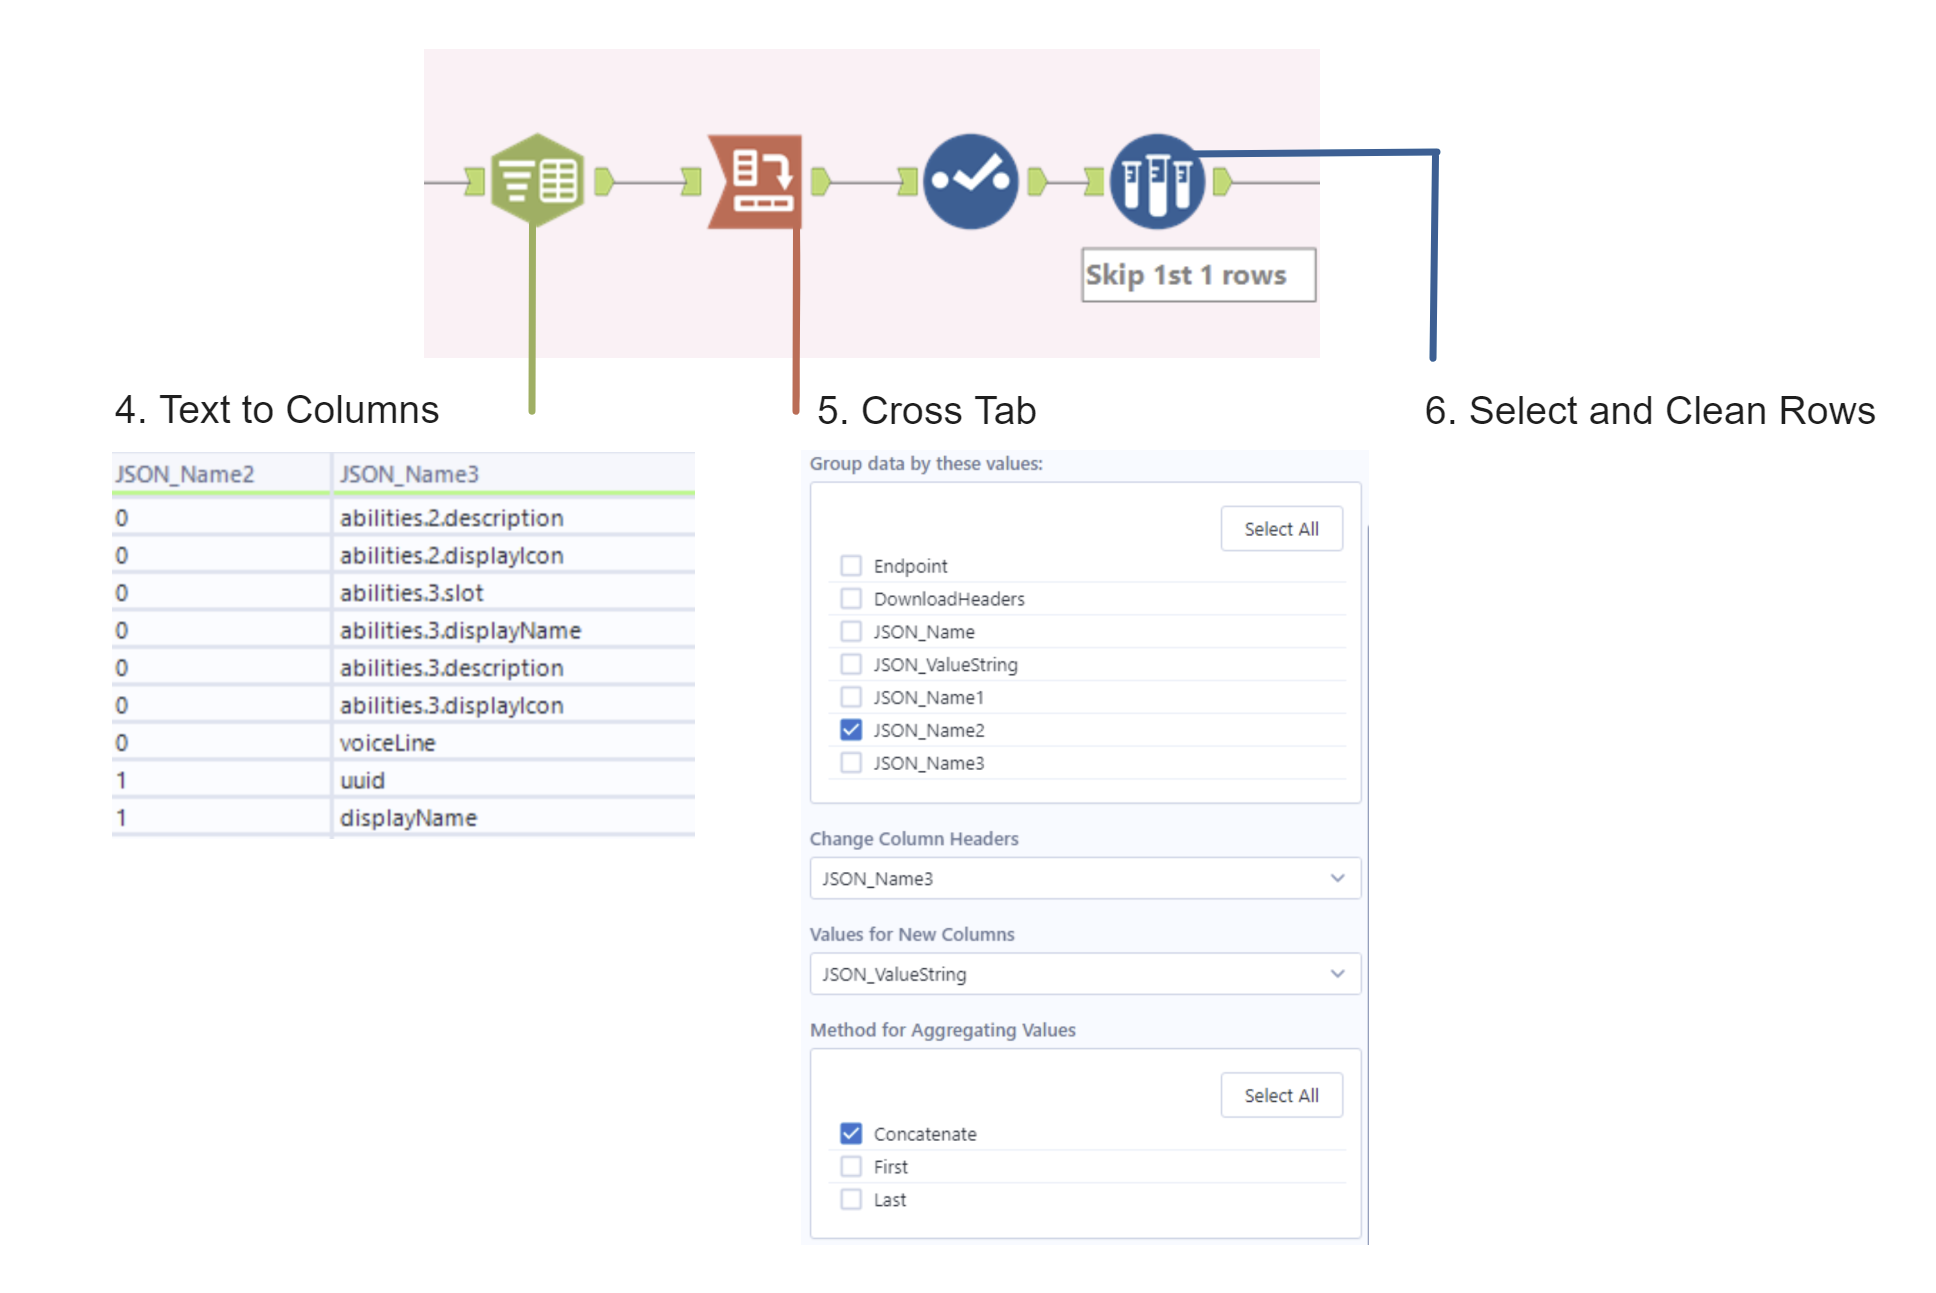
4. Use text to columns to split the JSON_name field, so that it can be used in the crosstab to turn the names into column headers.
5. Use the cross tab tool, and choose the field to group by, here I can see the numbers in JSON_Name_2 is grouping my fields by the different characters. Additionally I chose JSON_Name_3 to name the column headers and keeping the JSON_value field for the value of these new columns.
6. Next I selected the new fields I wanted to keep, as well as removing any blank rows.
7. As there are up to 5 abilities for each Valorant character, the columns were split into Ability-1_Name, Ability-1_Description, and Ability-1_Icon for each of the 5 abilities. This is a total of 15 columns, therefore to condense this I want just four Columns: Ability Number, Ability Name, Ability Description and Ability Icon. This can be achieved by using the Cross Tab Tool.
After this, the dataset is ready for an Output tool, and can be used to create a dashboard!