


Humans love patterns.
At night we stare up at the stars and see constellations and in the day we stare up at the clouds and see anything from a dinosaur to your sister's bad perm. This pattern-seeking behavioural phenomenon is a natural part of our brain's behaviour and learning. Think about how hard it is to figure out where a letter is in the alphabet without having to sing through the order.
Despite how disordered the world may be, there are actually patterns everywhere shown through the golden ratio. The golden ratio relates to a mathematical pattern known as the Fibonacci sequence, it creates a logarithmic spiral which you can see in seashells, plants, galaxies and so much more.

How does this relate to data?
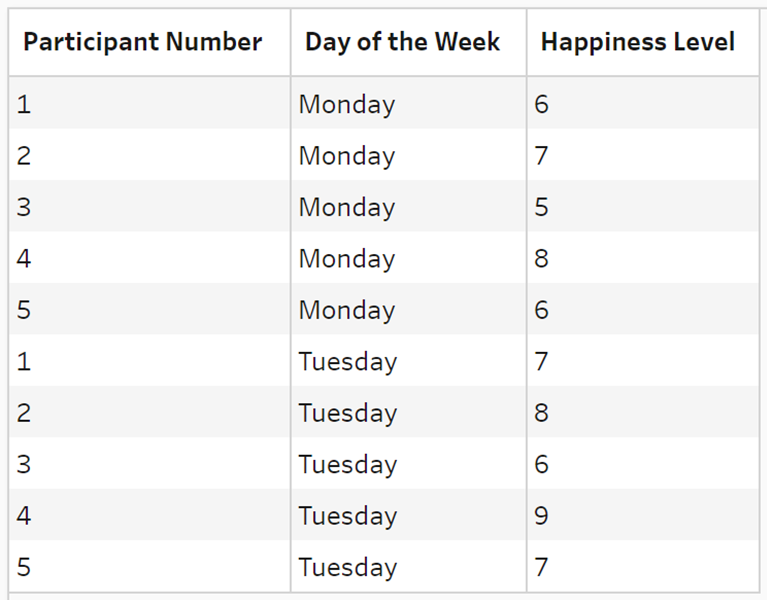
Well, data is collected information that can reflect anything from our experience of the world. Therefore, when we initially look at data, similarly to how I mentioned the world in it's physical form, we think it's too complex and disordered. However, we know there are patterns within data that we can analyse to discover something insightful. Can you try and find these patterns easily from looking at a raw excel table?
Go on have an attempt below.
Okay, your brain may be hurtin' a little, right? How long did it take you as well? Trying to find a pattern or insight without any other sensory cues increases the cognitive load which is the amount of information our working memory can process at a given time. This means our brain is using more biological resources to process the information, and as a result it is much harder to get to the answer.
Try again now, and find a pattern in the data, however, now it is represented visually.
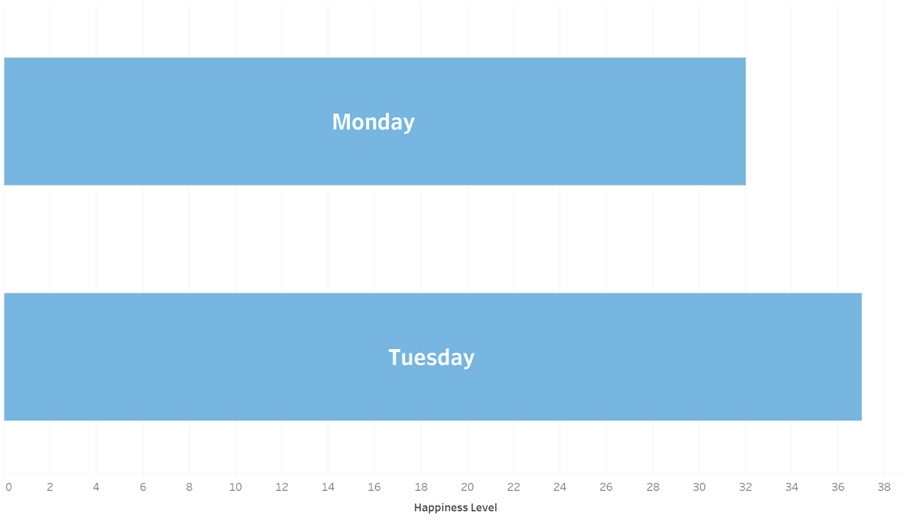
Look at you, speedy. That was so much better right? Your brain is processing the visual cues much faster (this is through progressing through visual neural layers without feedback loops - feed-forward). It rapidly identifies significant patterns and can filter out the noise of what information is not important. Ultimately, there is less information to process which significantly decreases the cognitive load and biological resources within your brain to get to the insight.
The use of data visualisation takes advantage of our intrinsic ability to spot patterns, combined with visual elements of the brain. When multiple regions of the brain are working together, information is processed in parallel for faster cognitive processing.
Now think about how many quick business decisions you can make using data visualisation as opposed to just looking at raw tables of data!
I hope I have convinced you why data visualisation is quintessential to analysing data with the power of science.
~ Numa