


Spatial analytics is important for data that represents location or geographical points. Tableau and Alteryx have spatial tools within the software to allow for analytical preparation and visualisation of spatial data.
Use Cases of Spatial Data
- Robots in Amazon warehouses need spatial mapping to prevent bumping into each other.
- Selecting store locations, by considering factors of footfall, population demographics etc.
- Crime analysis of where crime is committed can aid the deployment of emergency services.
Example of Using Spatial Analytics: Bus Routes
In Alteryx
Alteryx was originally a spatial company, and has powerful spatial processing. Below you can see the variety of spatial tools within the interface. This blog will walk you through how to visualise bus routes within Alteryx.

First bring in your input of the bus routes file, ensure to add a select tool to change the data types of the fields.
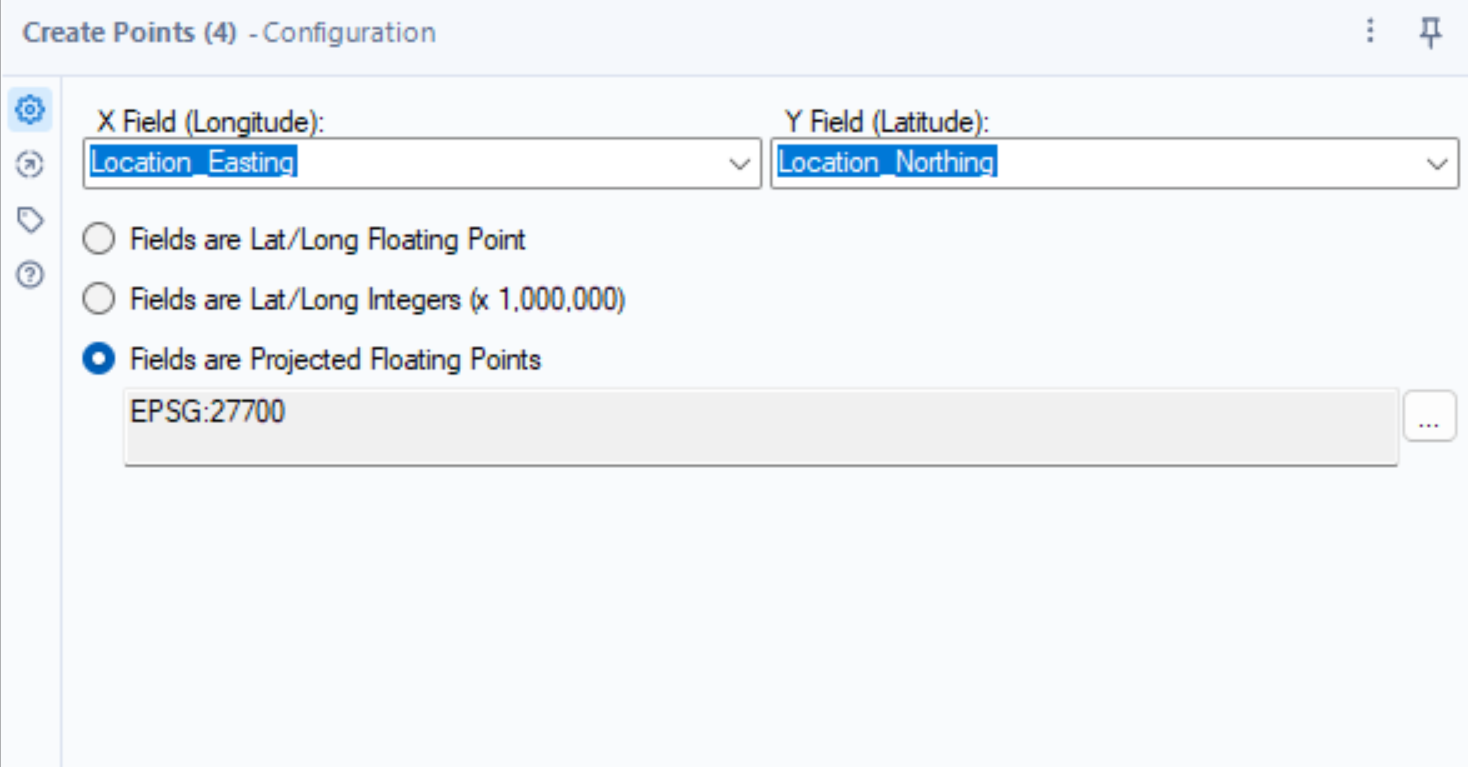
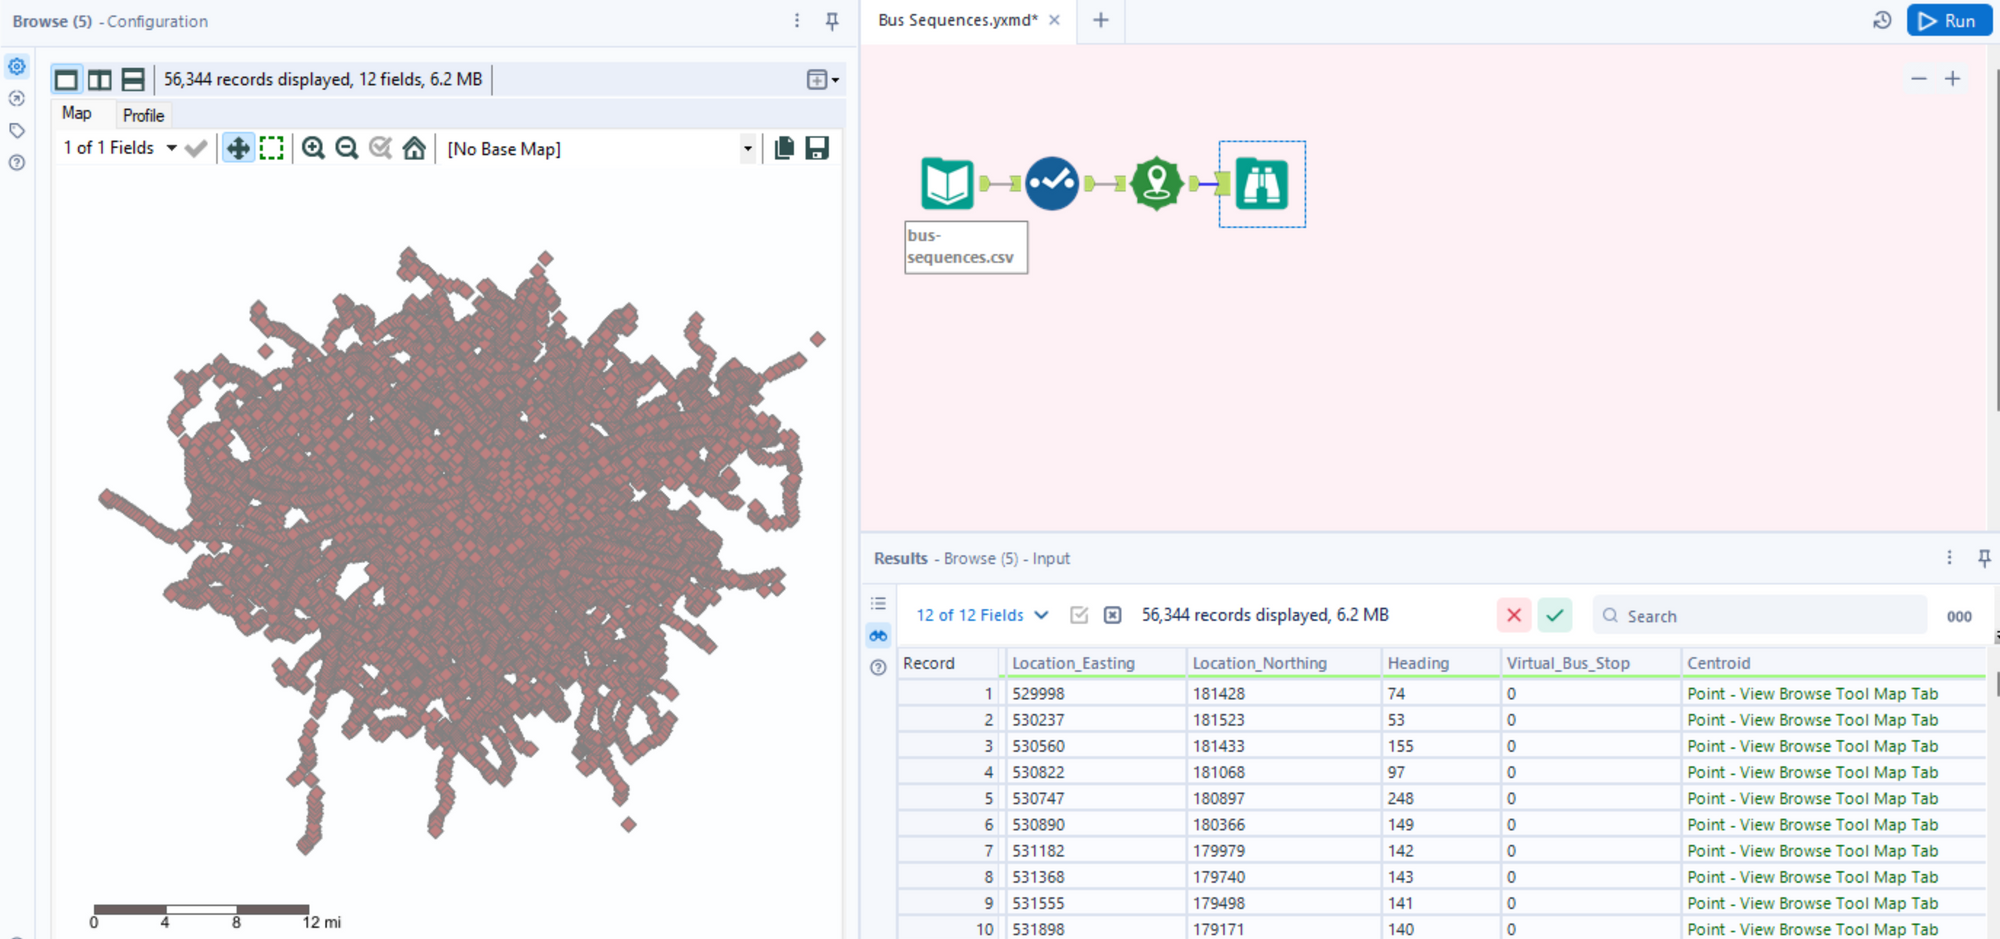
Next use the create points tool, and input the respective fields into the x and y fields. Connect the browse tool to have a look at the spatial data.
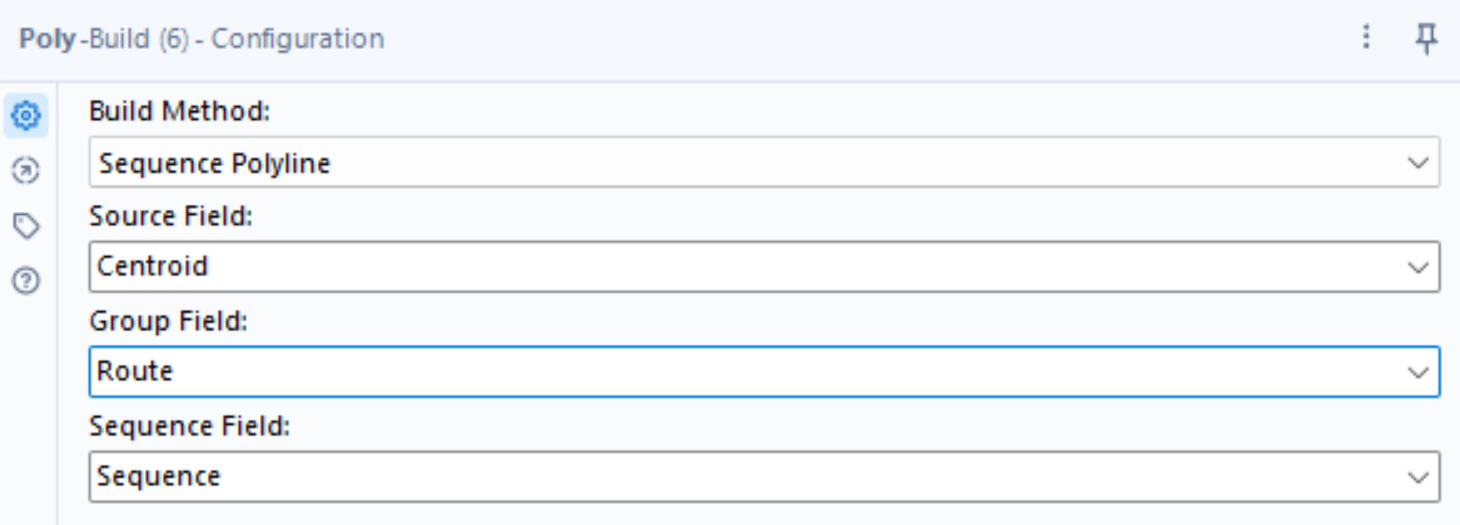
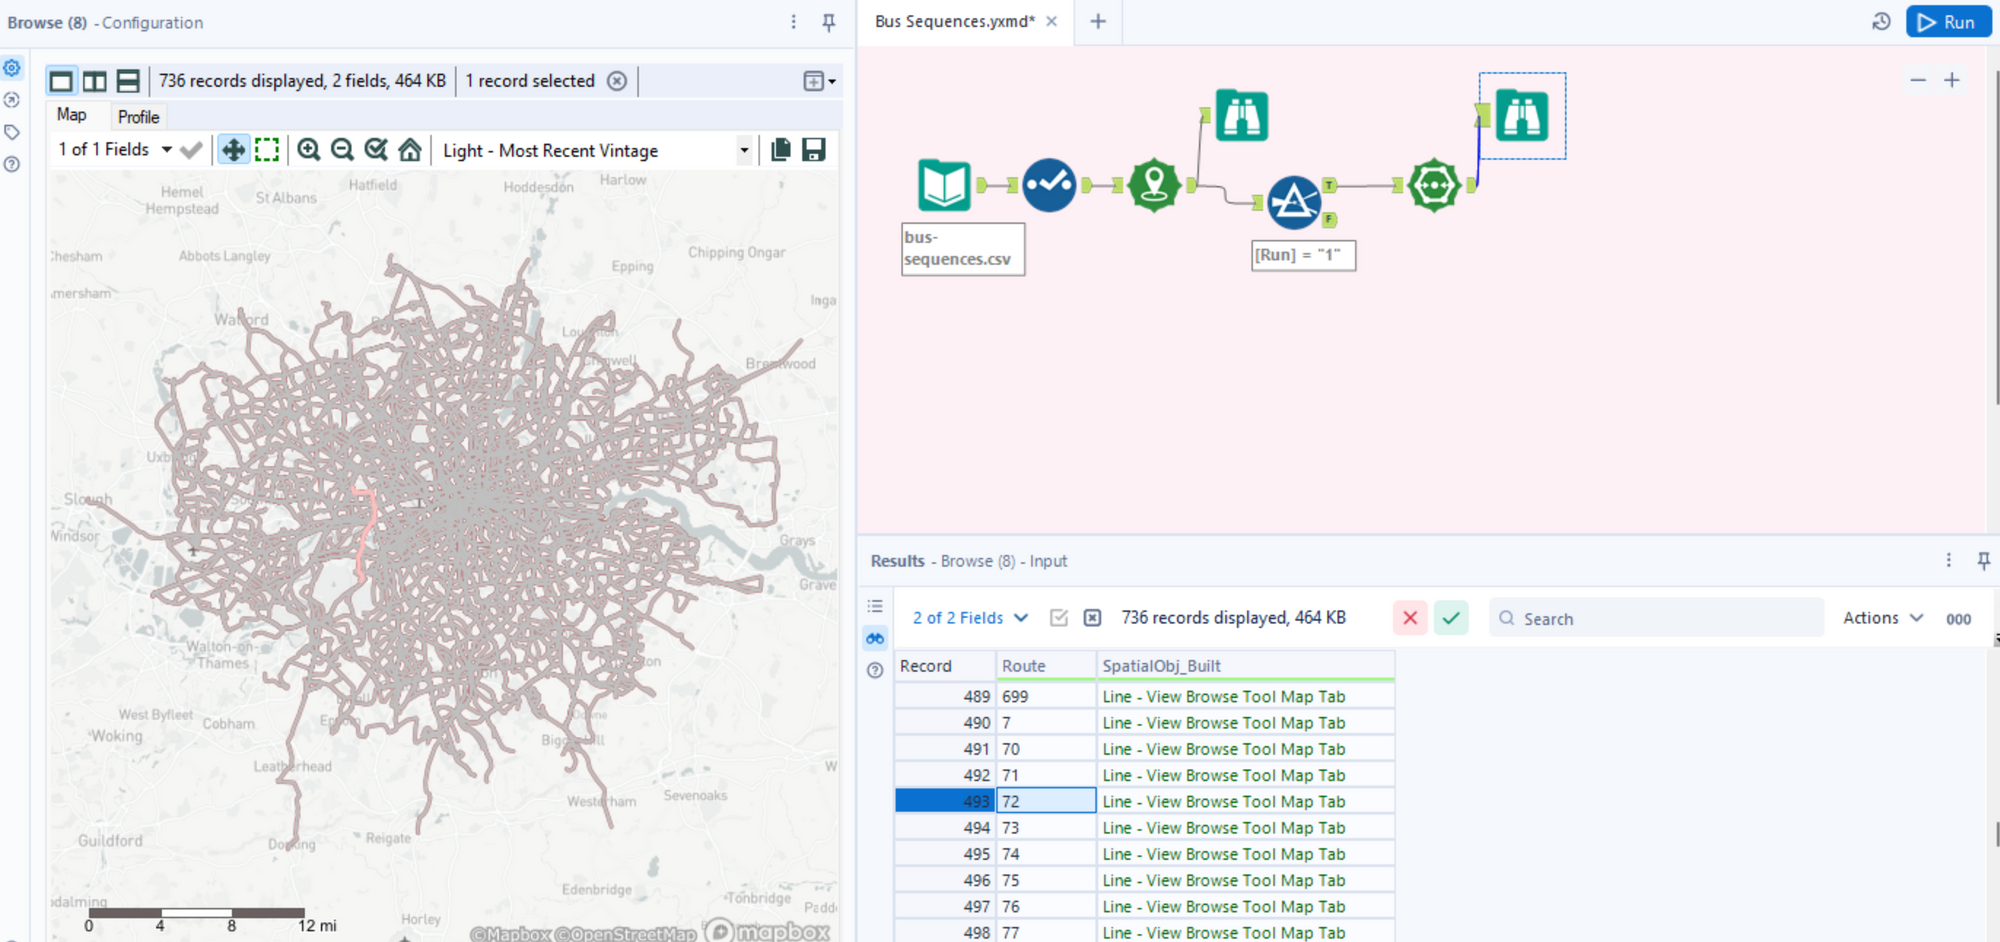
Add a Poly-Build tool, this allows you to connect the points with a line for each route along the sequence of bus stops.
You can now create an output as a hyper file so it is suitable for Tableau. Once you have imported it into Tableau, you can double click the SpatialObj measure. Then Add route onto colour, and ta-dah that is your spatial visualisation of the London Bus Routes.
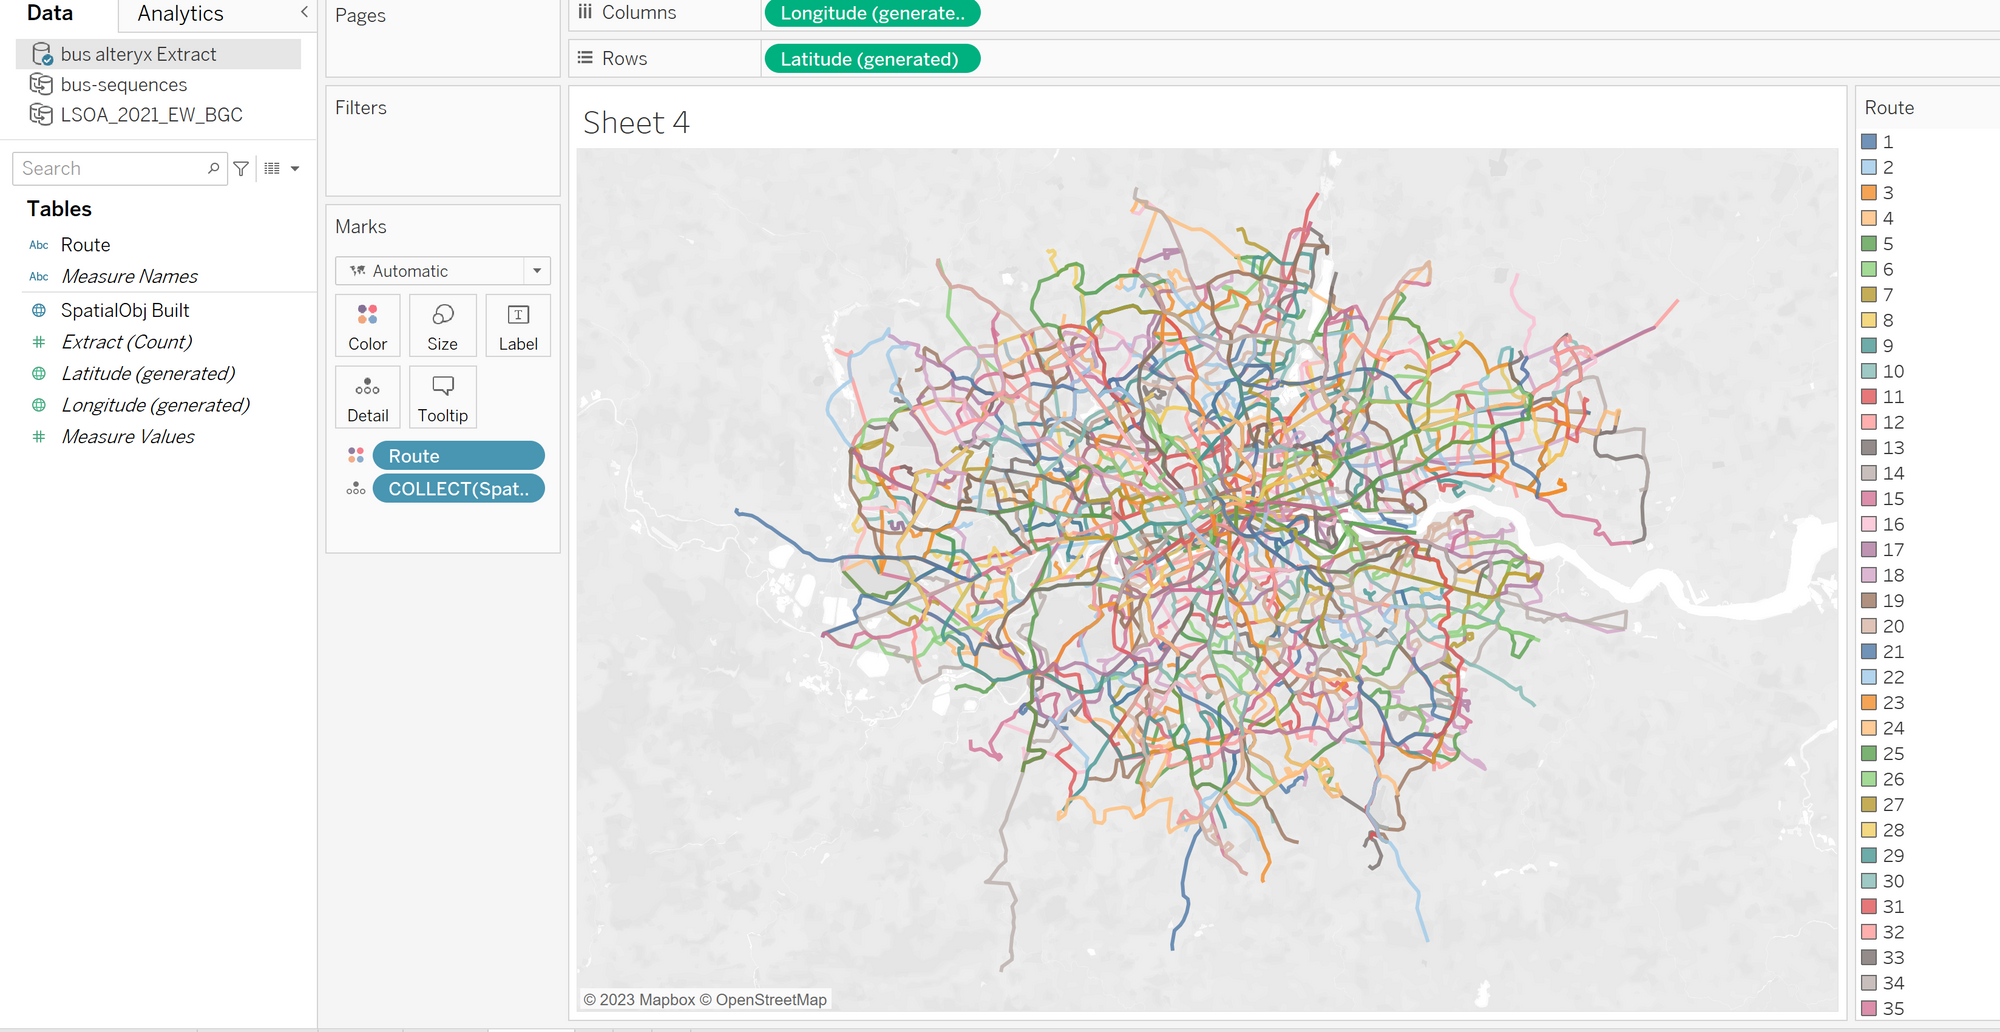
Here is my completed dashboard from this visualisation project, check it out here: