


This is the start of a blog series providing you with tips for calculations within the Power BI interface and advice for using DAX to make the most of your data!
Setting the scene:
To show you how to work this out, I'll be using the sample superstore dataset which you can access here (https://www.kaggle.com/datasets/vivek468/superstore-dataset-final)
This is an American dataset, so remember to change the order date type to date with locale type as the United States.
Explore the data:
A great way to understand the logic of what DAX functions to use is to try and find the answer by just using the table visualisation and filters within Power BI to get a feel of how to work it out.
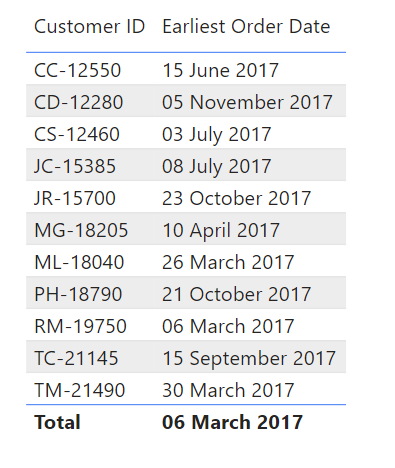
Here I built a table that has all the customer IDs and order dates.
Next, I changed the order date summary to the earliest date, this will showcase the date of the first order for each customer.
After that, I used the filter panel to only show the earliest dates that are after the 1st of January in the current year. In this example the dataset is old, so we will use 2017 as the 'current' year.
Here we can see all the rows of new customers in 2017.
DAX Code:
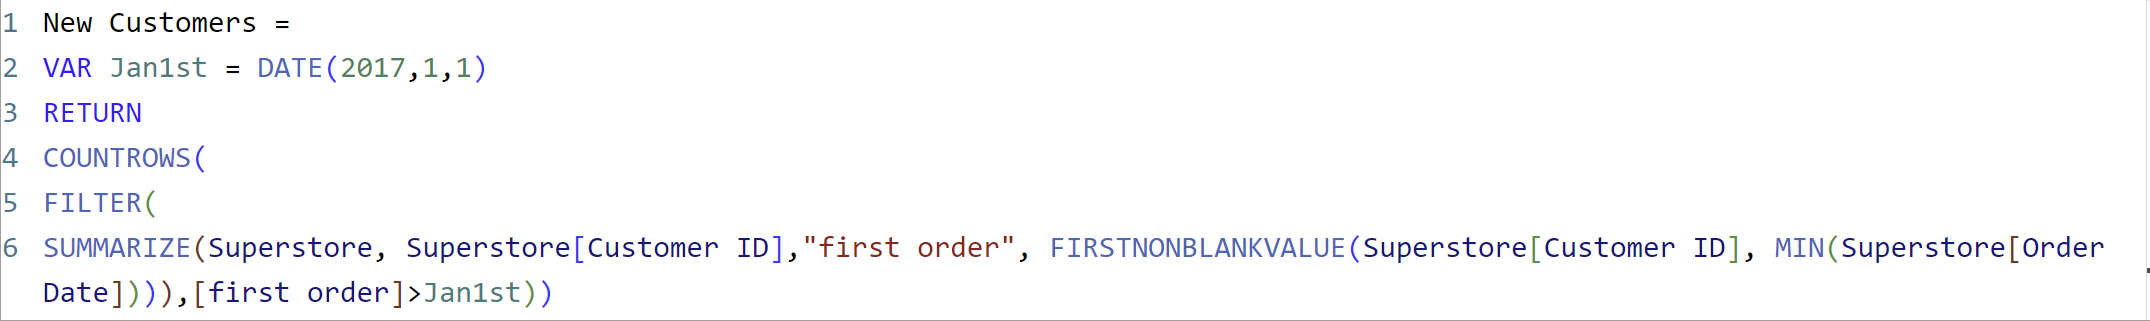
this is the DAX code. Let me walk through each part, following how we explored the data.
New Customers =
VAR Jan1st = DATE(YEAR(TODAY()),1,1)
RETURN
COUNTROWS(
FILTER(
SUMMARIZE(Superstore,Superstore[Customer ID],"first order", FIRSTNONBLANKVALUE(Superstore[Customer ID], MIN(Superstore[Order Date]))),[first order]>Jan1st))
- The summarize function allows us to recreate the table visualisation we built. Here we are referencing the Superstore table, and then bringing in the Customer ID column, we will call this table "first order", next we need to say what we want to work out which is to find the first value (not blank) of the earliest order date. So, use the function FIRSTNONBLANKVALUE on the Customer ID column, where we want the first order date, we can use the minimum function here.
- Next, we filtered this table to only show the dates of the first purchase within 2017. We can specify this date using a variable function - VAR. We type VAR and then state the variable we want to refer to, here we are calling it Jan1st which equals the DATE, with the year of today (or in this case 2017), on the 1st of the 1st month.
- After this, we type RETURN, to write the DAX logic.
- What we want to ultimately achieve is to count the rows, so we use the COUNTROWS function first.
- Next, we don't want to count all the rows, we want to filter down to the table we built. So, we use the FILTER function, followed by the summary table from step 1.
- Lastly, for the filter function, we want to state the expression of how to filter our summary table, which is for the MIN(order date) to be greater than the date we mentioned in the variable, which we can now simply write as Jan1st.
- Pull this calculation into a card visualisation, and you can instantly see that there were 11 new customers in 2017 in this dataset!
Thank you for taking part in this challenge! The beauty of DAX is that there may be different ways to get to the same answer, so do let me know what DAX expression you would use personally.
For any further questions, feel free to get in contact on LinkedIn: https://www.linkedin.com/in/numabegum/