


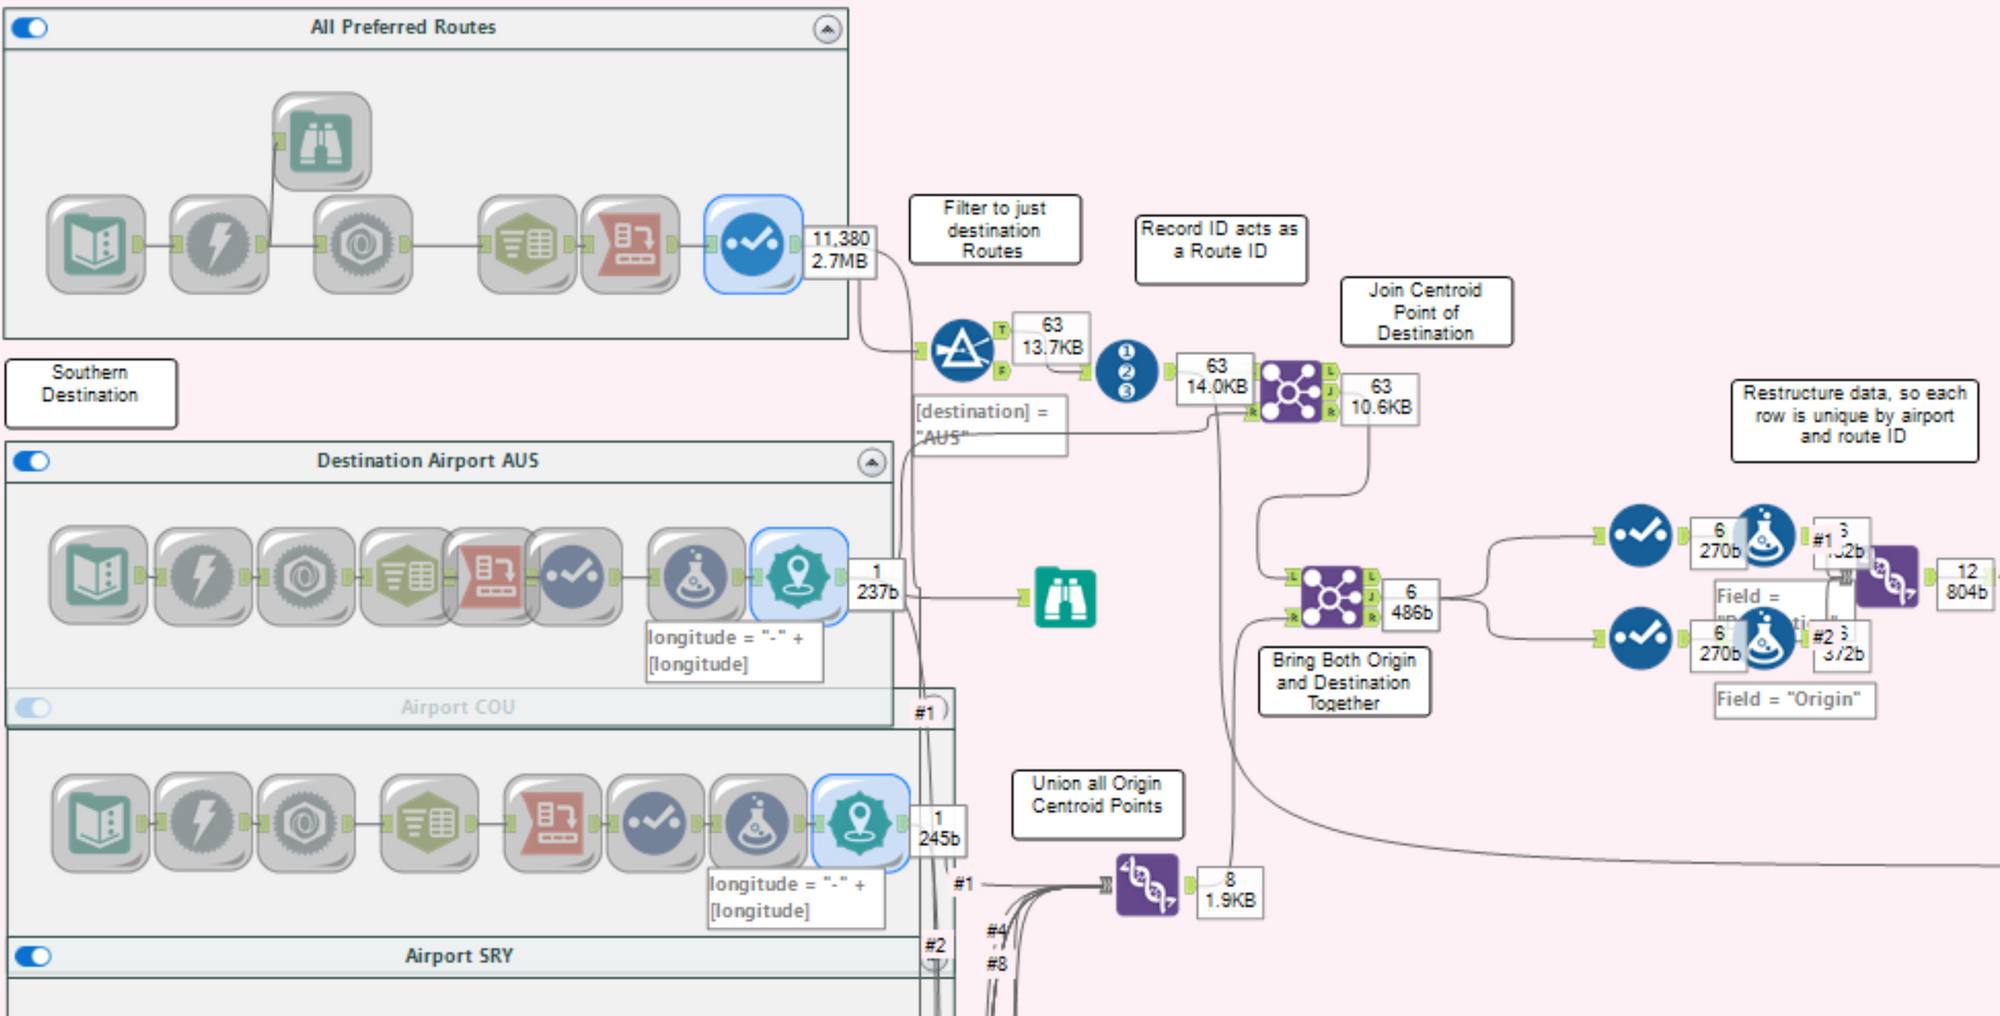
That's right, it's an Alteryx day for DS41! That means we can only do our analysis and presentation within Alteryx and Alteryx server.
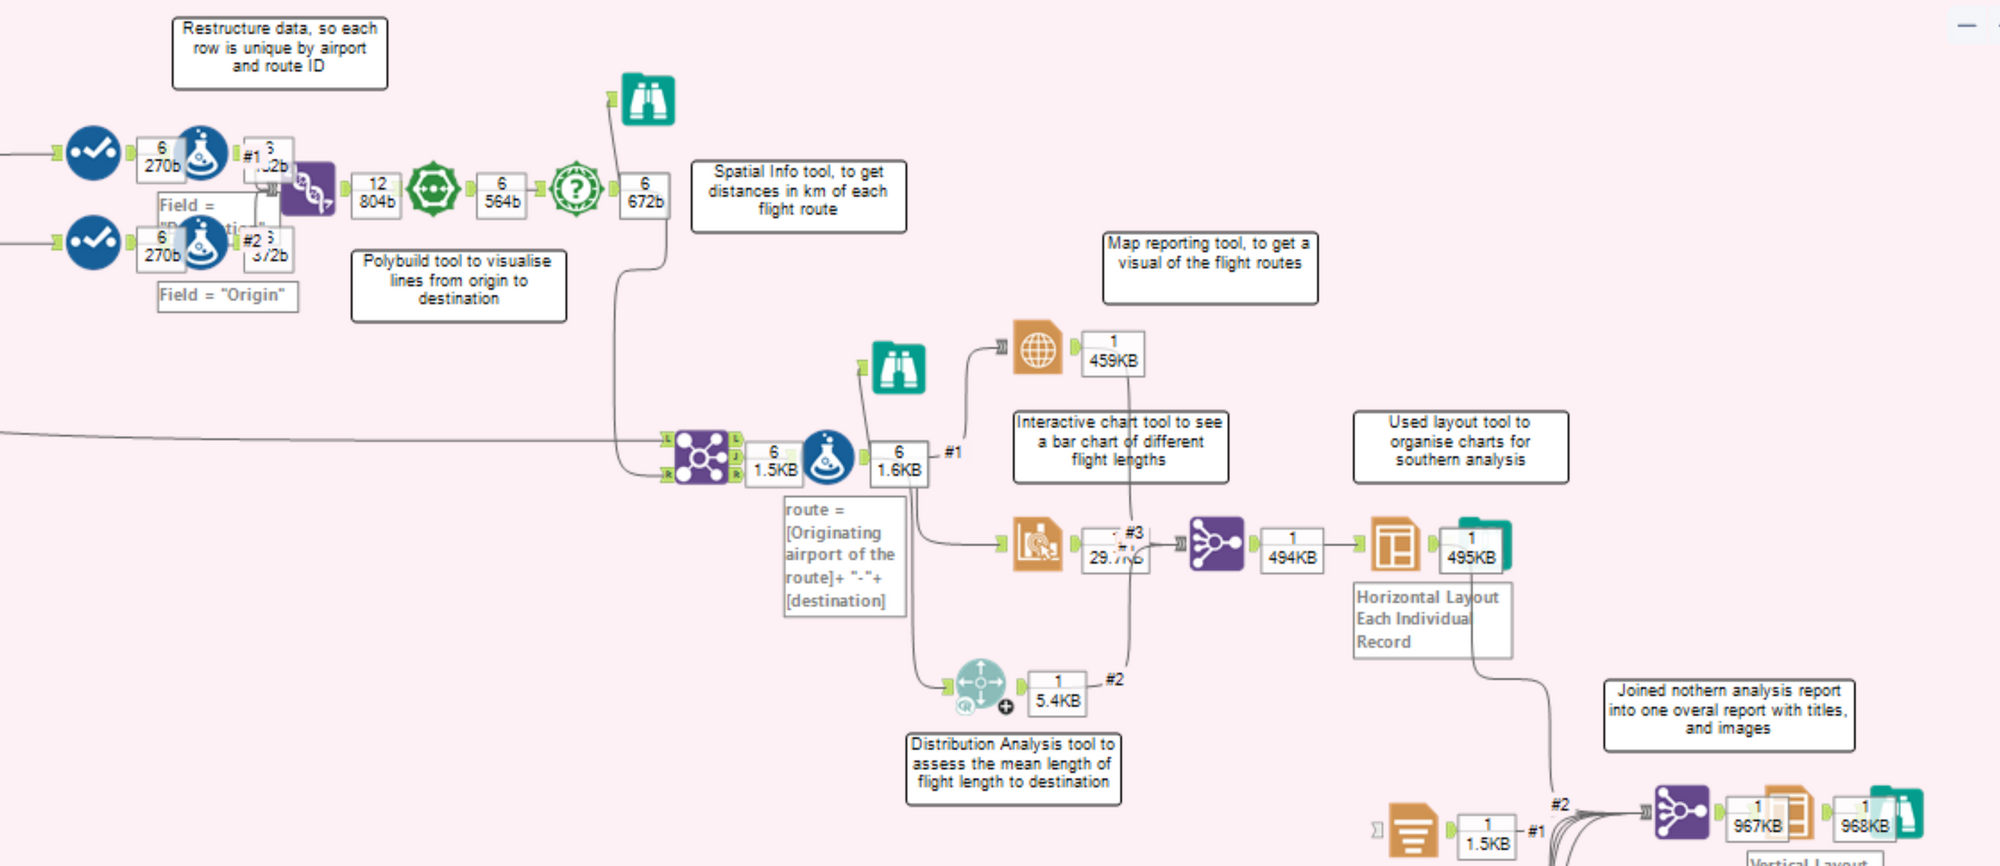
We were tasked to connect to this aviation API (https://docs.aviationapi.com/?ref=thedataschool.co.uk#) which meant using spatial tools for US flight analysis and then reporting tools to present back with in Alteryx server.
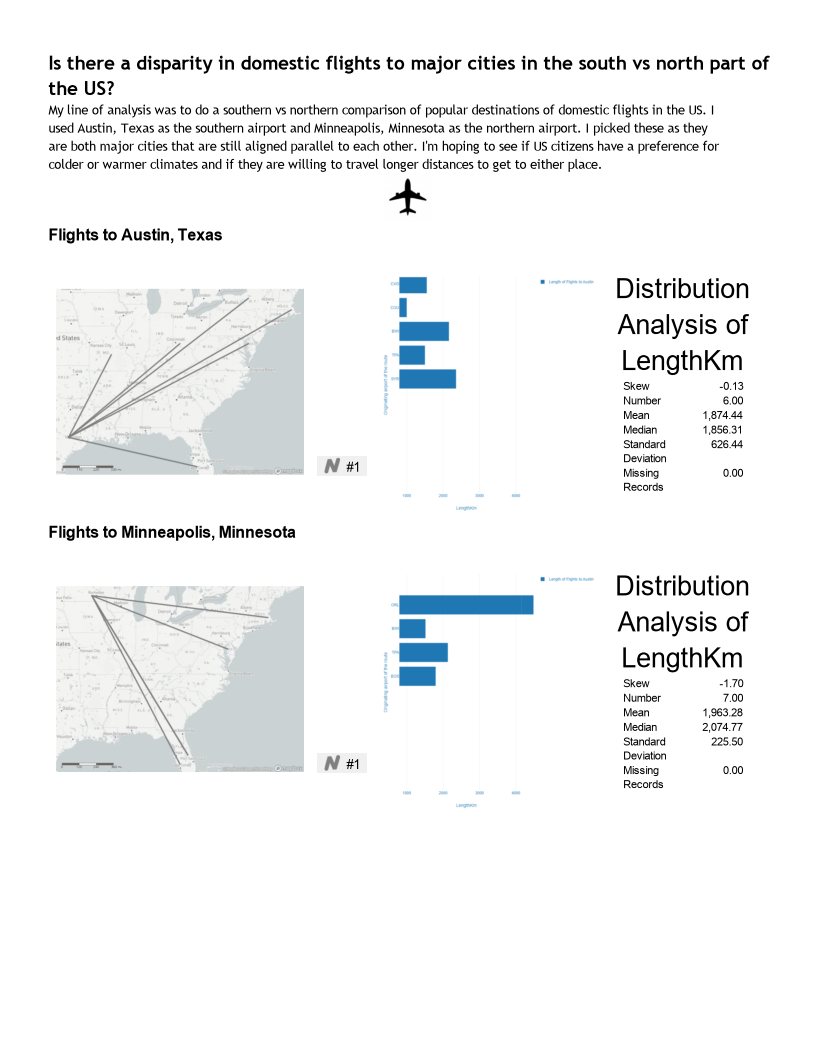
My line of analysis was to do a southern vs northern comparison of popular US destinations for domestic flights. I used Austin, Texas as the southern airport and Minneapolis as the northern airport. I picked these as they are both major cities that are still aligned parallel to each other. I'm hoping to see if US citizens have a preference for colder or warmer climates and if they are willing to travel longer distances to get to either place.
Here is the finished report:
What I wish I could do next
- Bring in all the origin airports, the reason I decided not to do this was as we were all continuously using the API all day there were many internal server errors that prevented accessing the data
- The airport API had a parameter for only one airport data to be pulled through, what I would do next to automate the process of bringing in all the data is to create a text input of all the airport codes and append it onto the initial API URL, to be able to bring in every API in one workflow.
- I want to be able to have a stronger analysis, this may mean supplementing the data or using different statistical tools within Alteryx so I come to a more compelling conclusion