Data Modeling – What and why we need to know?
Generally, data modeling can be defined as a process of diagramming data flows. Tableau defines data modeling as a diagram how it should query data in the connected database. When we use data source that has already been prepared for analysis, Tableau will instantly create the structure of the data model as the tables are added to the canvas in the data source page. However, our data often comes from different sources and required to be combined. In this case, Tableau allows us to create data model by using relationship, join and union.
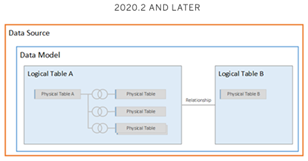
Layers Of The Data Model
Tableau data model has two layers:
1). Logical layer (added in Tableau 2020.2 and later)
When we try to combine data from multiple tables, Tableau automatically a relationship between them based on existing key constraints and matching fields to define the relationship. If Tableau is unable to create that relationship (for instance because different column name – Date and Order Date), red exclamation mark will appear indicating that we need to select the relationship manually. Combining data in the logical layer is called relationship (or noodles). Tables at this layer are not merged in the data source, the remain distinct and maintain their native level of detail. Therefore, logical tables act like containers for merged physical tables. A logical table can contain single or multiple physical tables merged through joins and union.
2). Physical layer
Previously, Tableau data model consisted of a single, physical layer where we can combine multiple tables using join and union. Tables are merged into a single, flattened table.

So, what is the different between relationship and join (also union)? This post and the next one will discuss about this point.
Data Model – Relationship
For example, we want to create a relationship between sales data containing product ID and product database containing product description.


Without me doing anything, Tableau automatically detects that these two columns are related. However, it is worth checking if it is the right columns that Tableau selects.

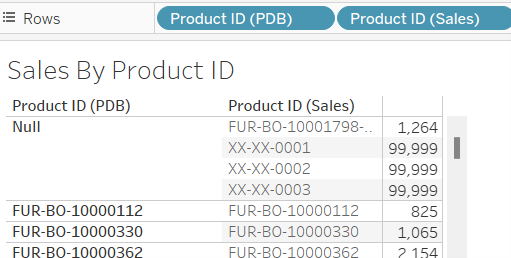
When we visualize the sales by product ID from the product table, it shows 8,432 null values. It indicates something wrong with the relationship.

If we take a look closer, there are sold products that don’t have corresponding ID in the database.

The easy analogy would be as follows

Honestly, it is little bit confusing for me as I think what actually is going on behind the scenes. After some digging, according to the documentation, Tableau relationship uses join in the backend, however, the type of join (inner, left, right or outer join) is automatically selected by Tableau based on the fields being used in the visualization. The highlighted point is that the relationship preserves the native level of detail in the data. Personally, I think this bit unpredictable as I don’t have control over it. My takeaway point is always inspect the related tables and ask yourself questions, does the relationship make sense (for instance, many null values).
I will continue the next post with the Join.
Source: Data Modeling with Tableau by Kirk Munroe
