Dashboard week – Day 1
The day was filled with quite a lot of excitement – especially because we had to start from scratch at 16:00 – but hey, fun times!
Today we were handed data on Andy’s recent trip to Rome with several restaurant ratings over several days in which it seemed he only had Gelatos, beer and pizza. Sounds like the perfect holiday. I decided to investigate whether Andy can be seen as a sceptical tourist when his ratings are compared to that of Tripadvisor. Lo-and-behold – it seems the man can be classified as a slightly sceptical tourist…
Creating filter-dependent images
There is a very nice step-by-step guide posted by Shawn Wallwork on how to go about this and it can be found here.
The idea is that every time a filter is applied for a certain restaurant; a different image will appear. I created my own images which I saved for every restaurant which updates when a restaurant is selected. The interactive dashboard can be found here.

Creating a chart for your background images
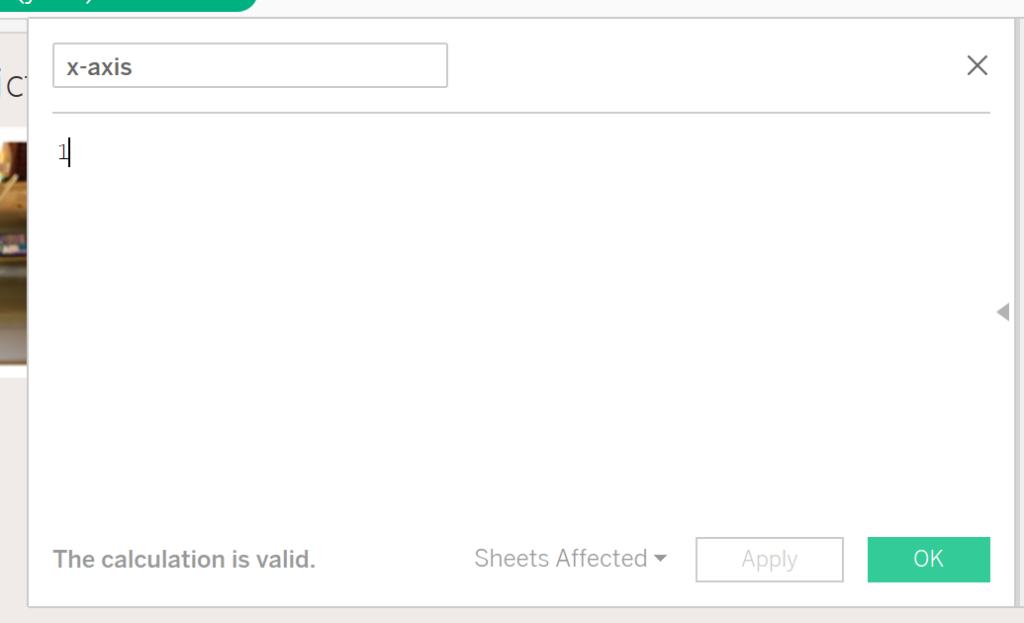
Create two calculated fields – the x-axiz and y-axis – each with a value of 1.

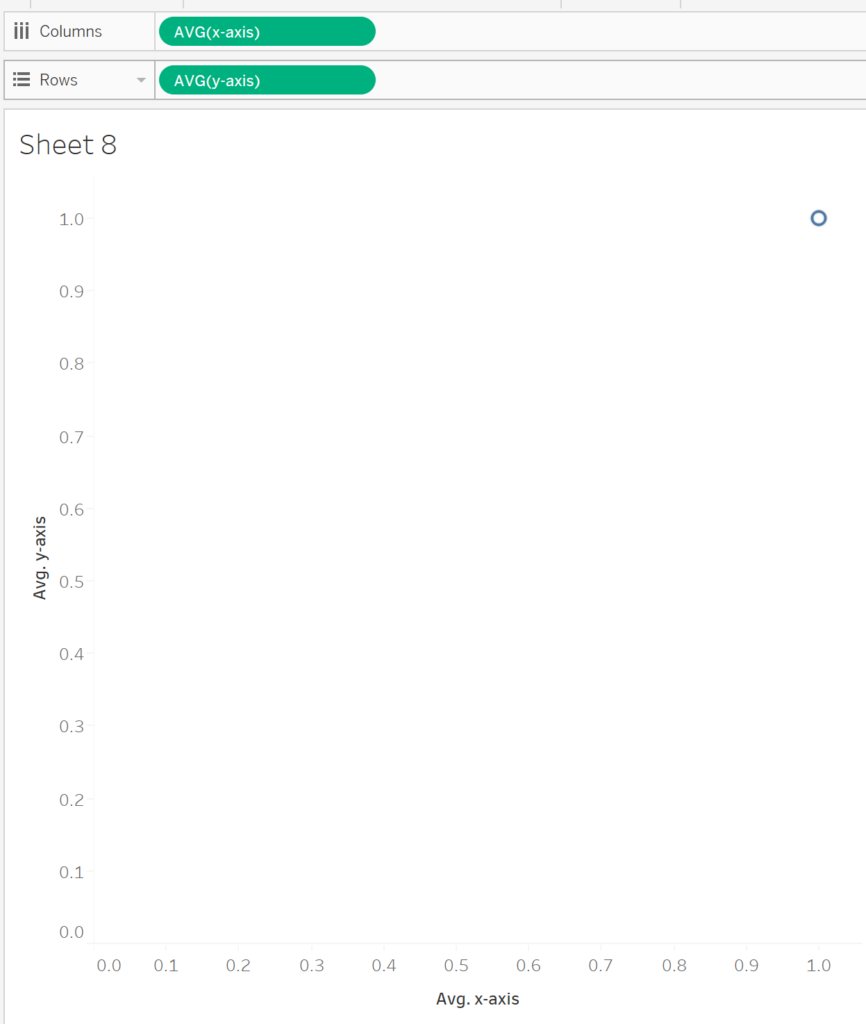
Create a chart by placing the average of the created calculated fields of the X-axis and Y-axis on the columns and row panes of the view, respectively, and set the mark colour as transparent. Finally, fix both the axes between 0 and 1.

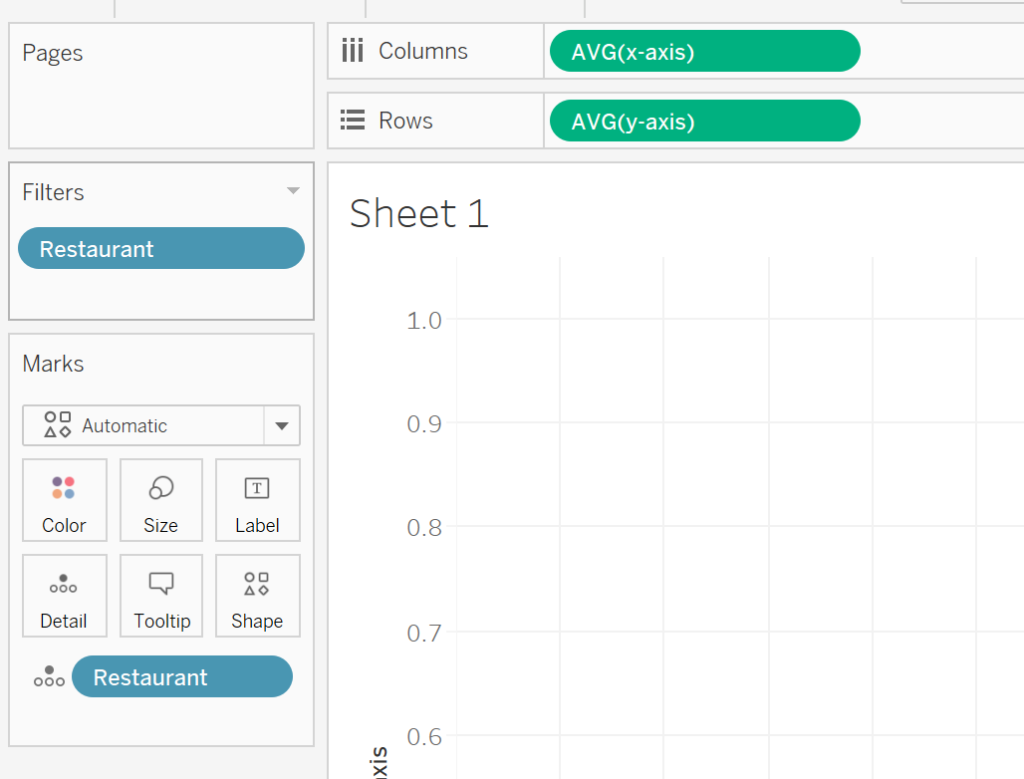
Place the controlling dimension on both the filter shelf and also add it to the detail pane of the marks card.

Adding images to the sheet
Adding images to the sheet is done by selecting the Maps –> Background images –> Sheet 1 –> Add Image… Browse to your image.

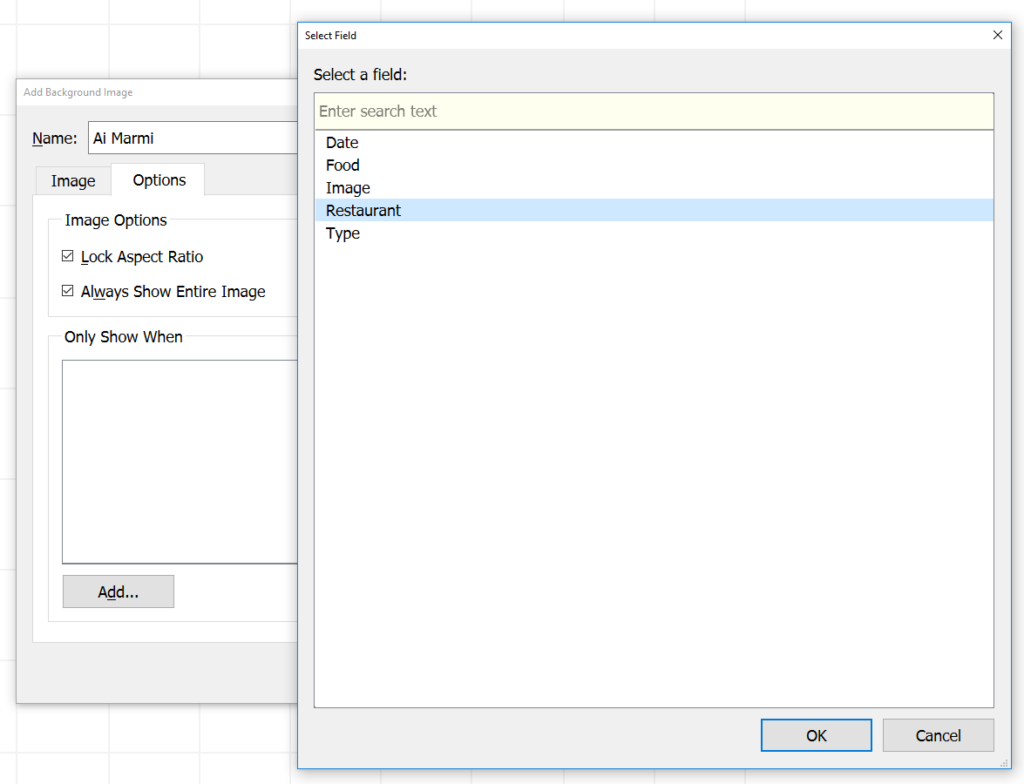
Set your Right and Top fields to 1 and leave the others as 0. Switch to your Options tab and select ‘Always show entire image’. Finally, in the ‘Only show when’ box, select Add. Select your dependent field – for this example it is the Restaurant field – and click OK. You will be prompted to specify which value in the dimension the image should be linked to.

Repeat the steps until all your images are linked to the correct values within your dimension and click OK once you have added and linked all your images. Finally hide the headers for the axes.
Conclusion
This dynamic method of changing a background image dependent on a filter makes it a wonderful way to interpret an interactive dashboard.
I hope you found this as interesting as I did!
Featured image: https://stocksnap.io/photo/SV7QT4MPGF
