


Tableau offers several types of filters that allow users to apply conditions to include or exclude records for various analytical purposes. In this blog, we will focus on context filters, which are a crucial type of filter. We will explore its applications and delve into some examples to better understand its significance in data analysis.
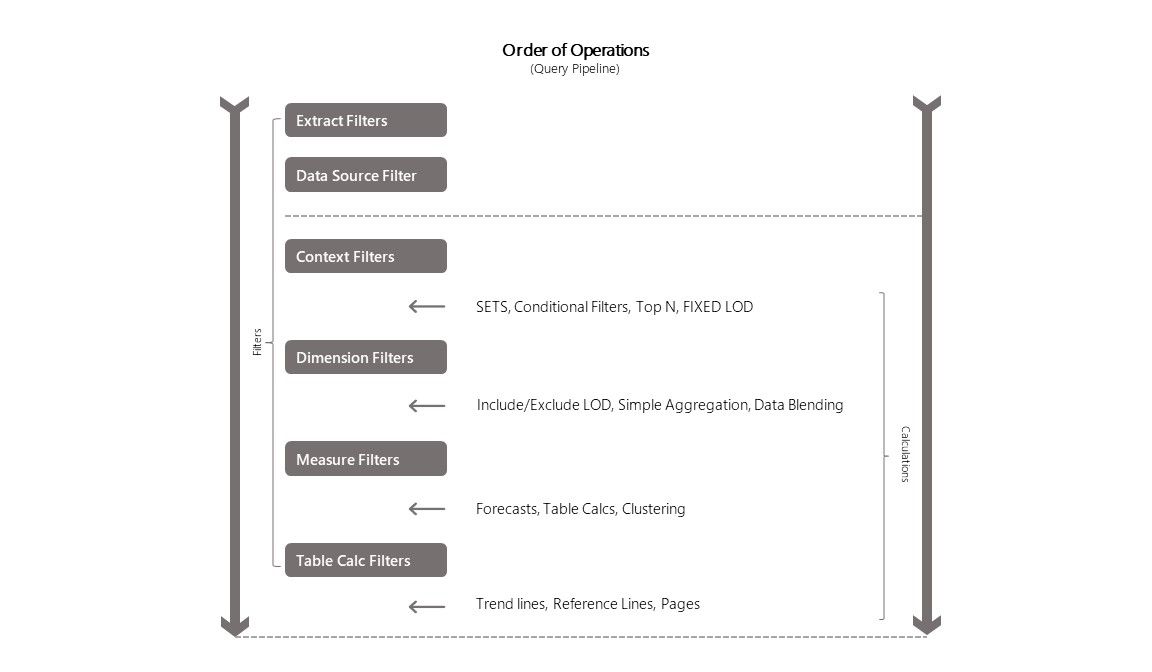
To understand the significance of context filters, it is essential to comprehend the order of operations in Tableau. As shown in the figure below, Tableau follows a specific sequence of operations to achieve the desired calculation outcomes. Initially, Extract and Data source filters are applied at a high level in the data source. Likewise, Context filters function as high-level filters at the worksheet level, enabling their application before dimension and measure filters. This arrangement has the potential to enhance the performance and accuracy of your visualizations by ensuring specific filters are prioritized and processed effectively.
Let's explore the impact of context filters on visualizations through some examples. In this instance, we will utilize the default Superstore dataset provided by Tableau.
Scenario
We aim to identify the Top 10 States in terms of sales, with the flexibility to apply filters based on four different Regions.
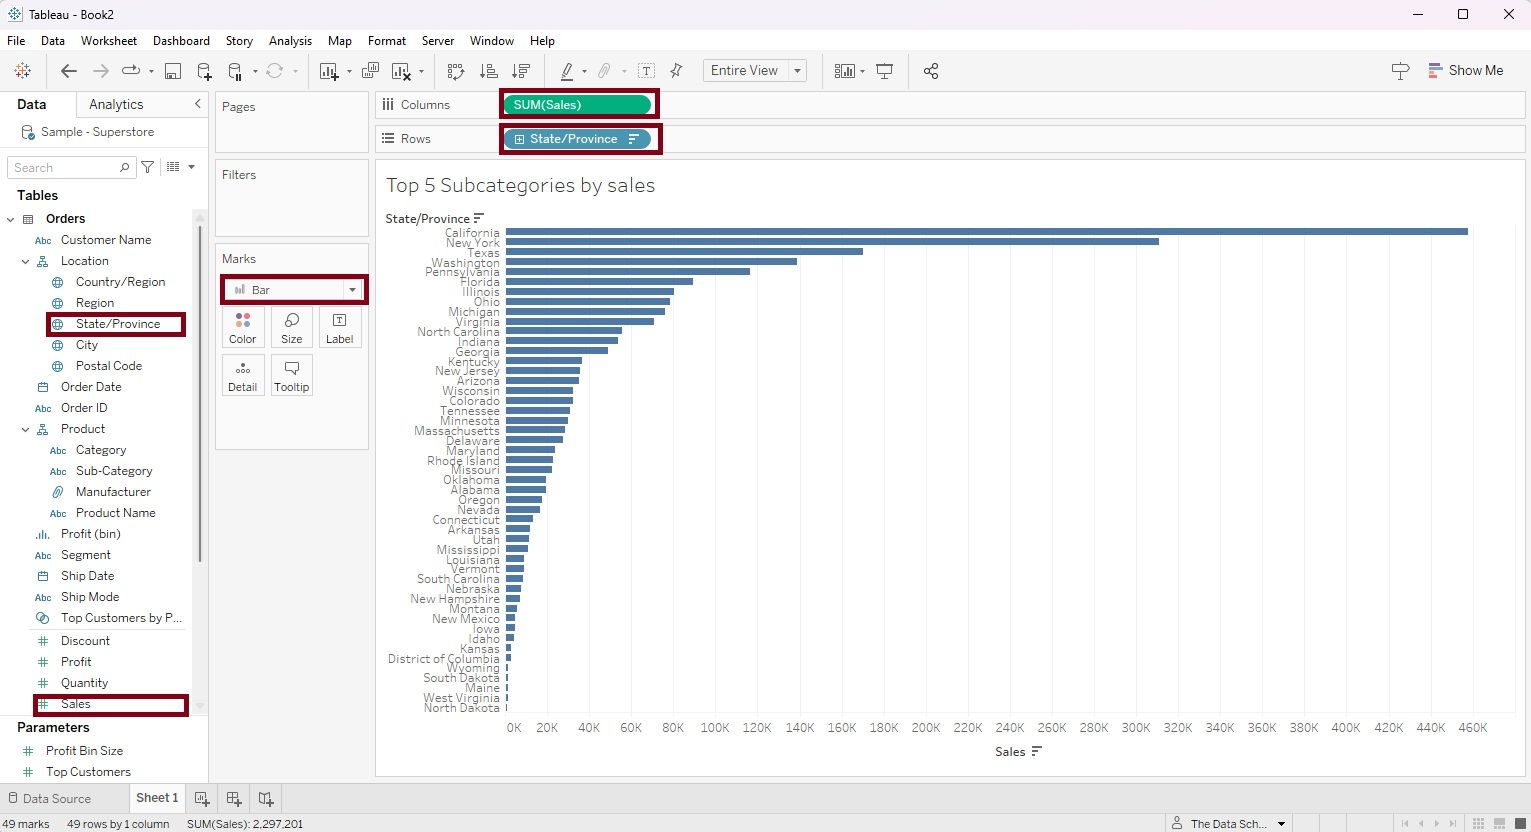
Step 1: Place the dimension 'State/Province' onto the Rows shelf and the measure Sales onto the Columns shelf. Choose a bar chart as the visualization type. By following these steps, you will generate the following chart."
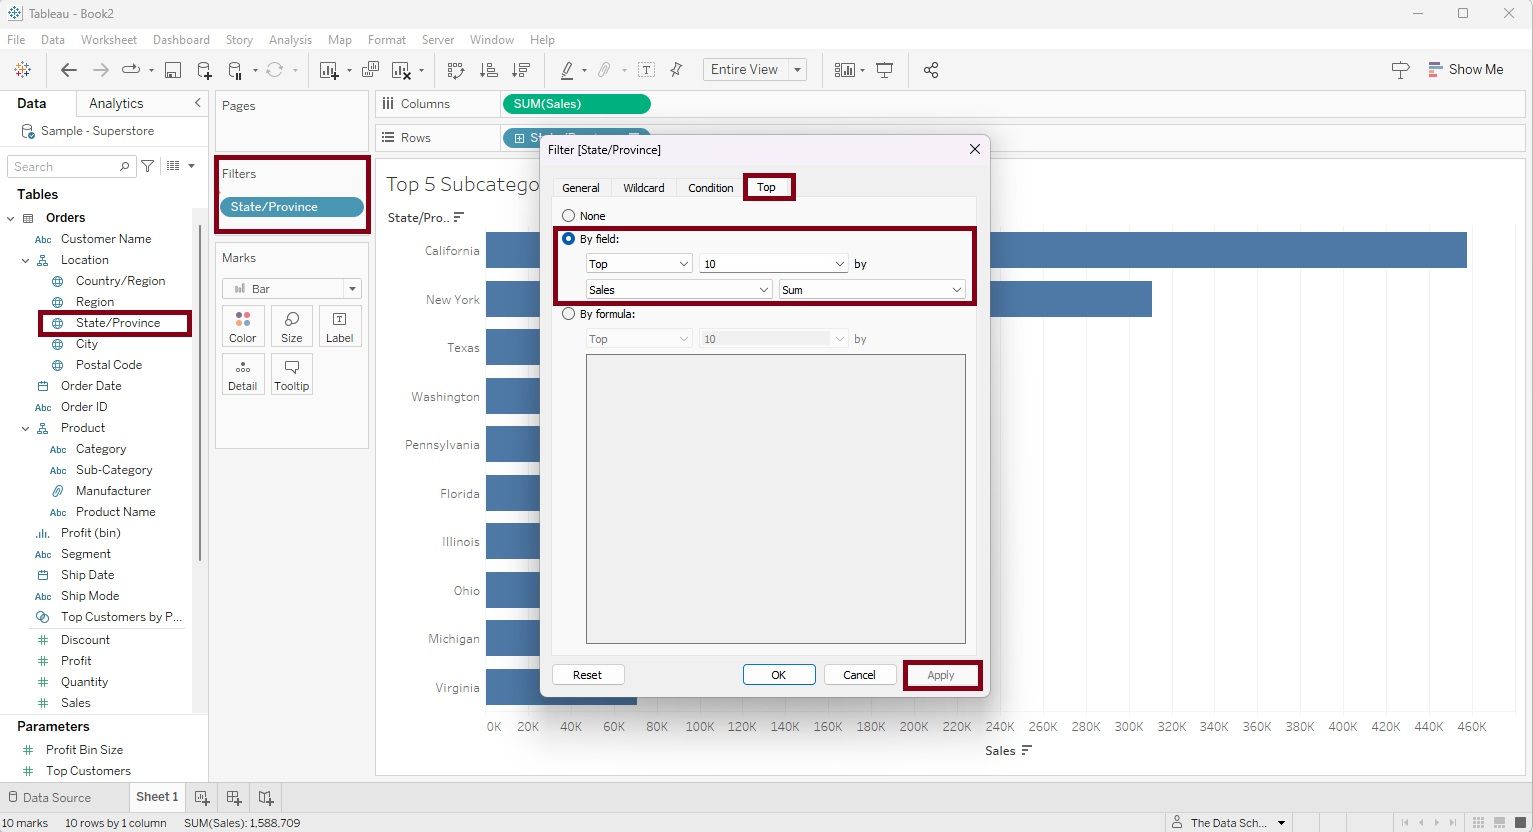
Step 2: Drag the dimension 'State/Province' again into the filter shelve. A filter dialog box will appear. Select the 'Top' menu on the top right. Select 'By Field' radio button, and within the 'By Field' category select 'Top' in the menu, enter number '10' based on 'Sum' of 'Sales' as shown in the figure below, then click 'Apply'.
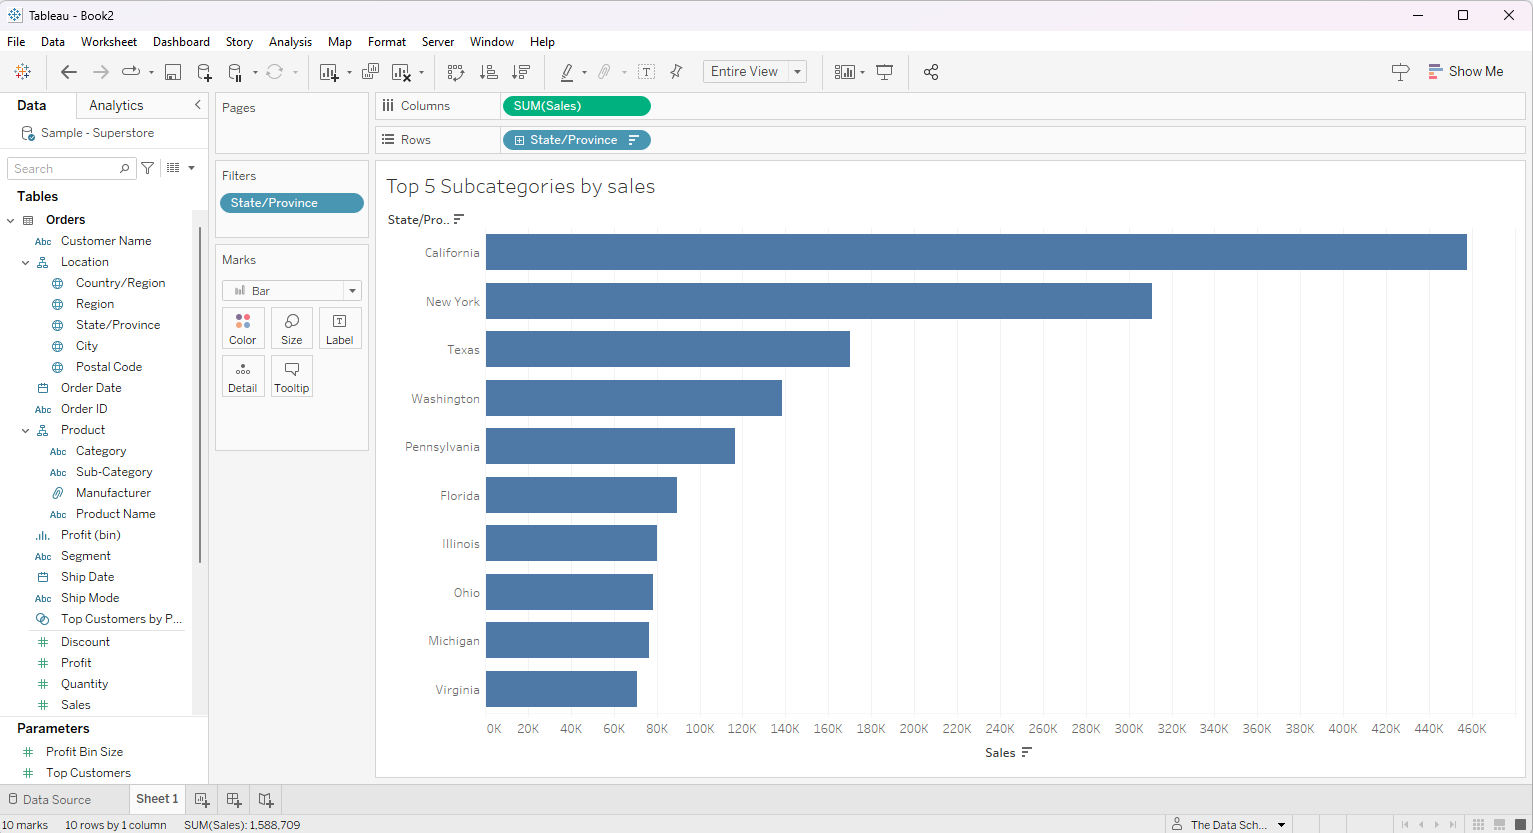
The outcome of applying this filter will be the Top 10 States ranked by sales, as demonstrated in the figure below.
Step 3: Next, our objective is to obtain the Top 10 States in terms of sales for different regions in the USA. To achieve this, we'll drag the dimension 'Region' into the Filter Shelves. A filter dialog box will appear, where we can select the 'Central' region and then click on 'Apply'.
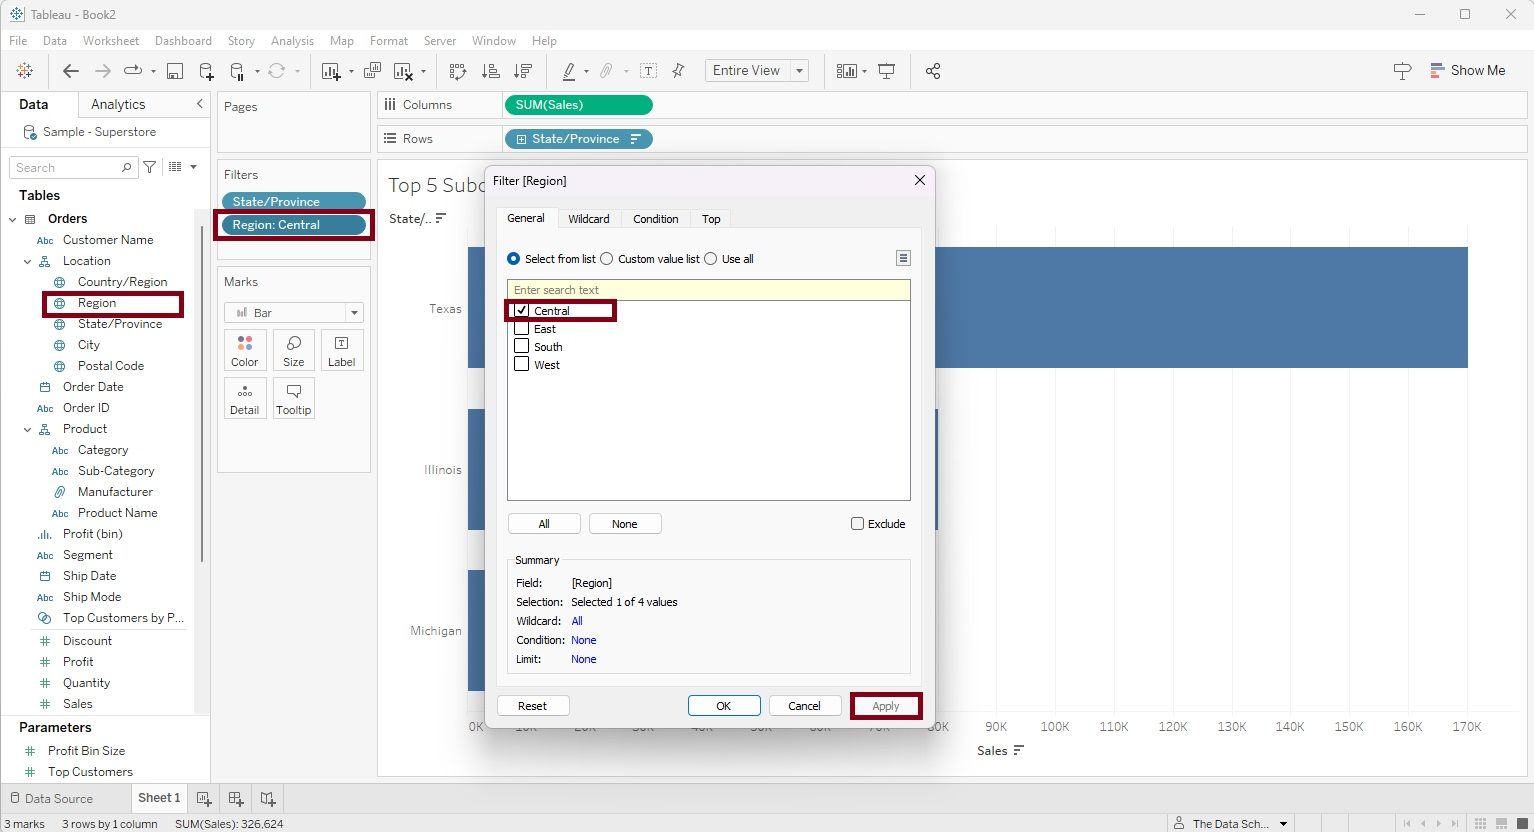
As a result of applying the 'Central' region filter, the visualization displays only three states in the Central region. However, this outcome is not as expected.
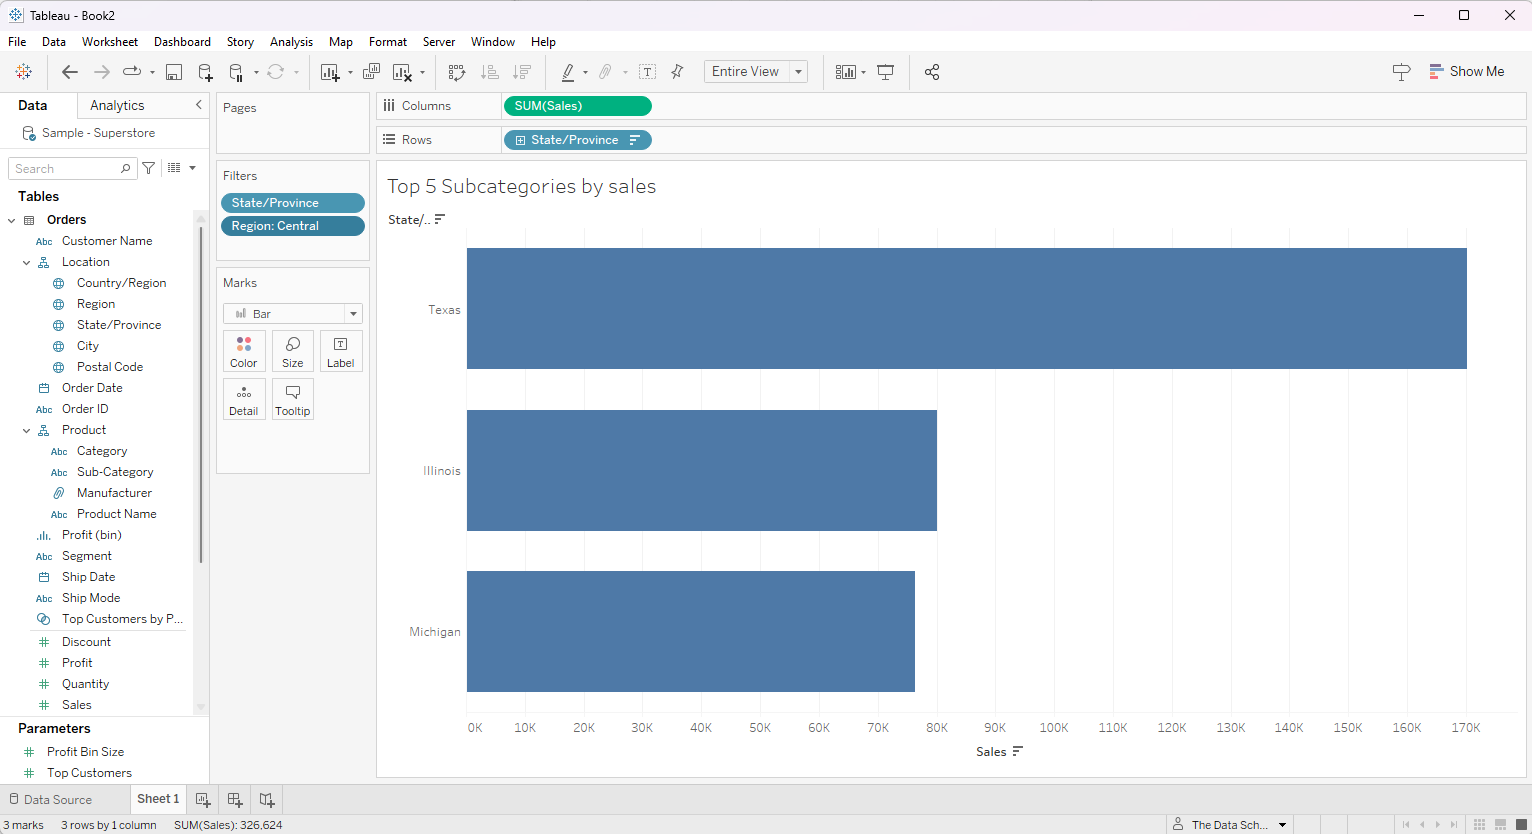
What is the issue here?
The 'Region' filter in Tableau is a dimensional filter, whereas the earlier applied Top 10 States in Sales is a measure-based filter using Top N calculation. In Tableau's order of operations, the Top N calculation is performed before applying dimensional filters. Therefore, in this scenario, the Top 10 States in sales are determined first, and subsequently, the 'Region' filter is applied. As a result, the visualization will display only the 3 States in the 'Central' Region that belong to top 10 states in sales across the entire USA.
What's the solution for our desired result?
Ideally, the 'Region' filter should be applied first, and then the Top 10 calculation should be based on the filtered regions. However, due to the order of operations in Tableau, this sequence is not followed. To address this, we can convert the 'Region' filter into a Context Filter, which will ensure it is applied before the Top N calculation.
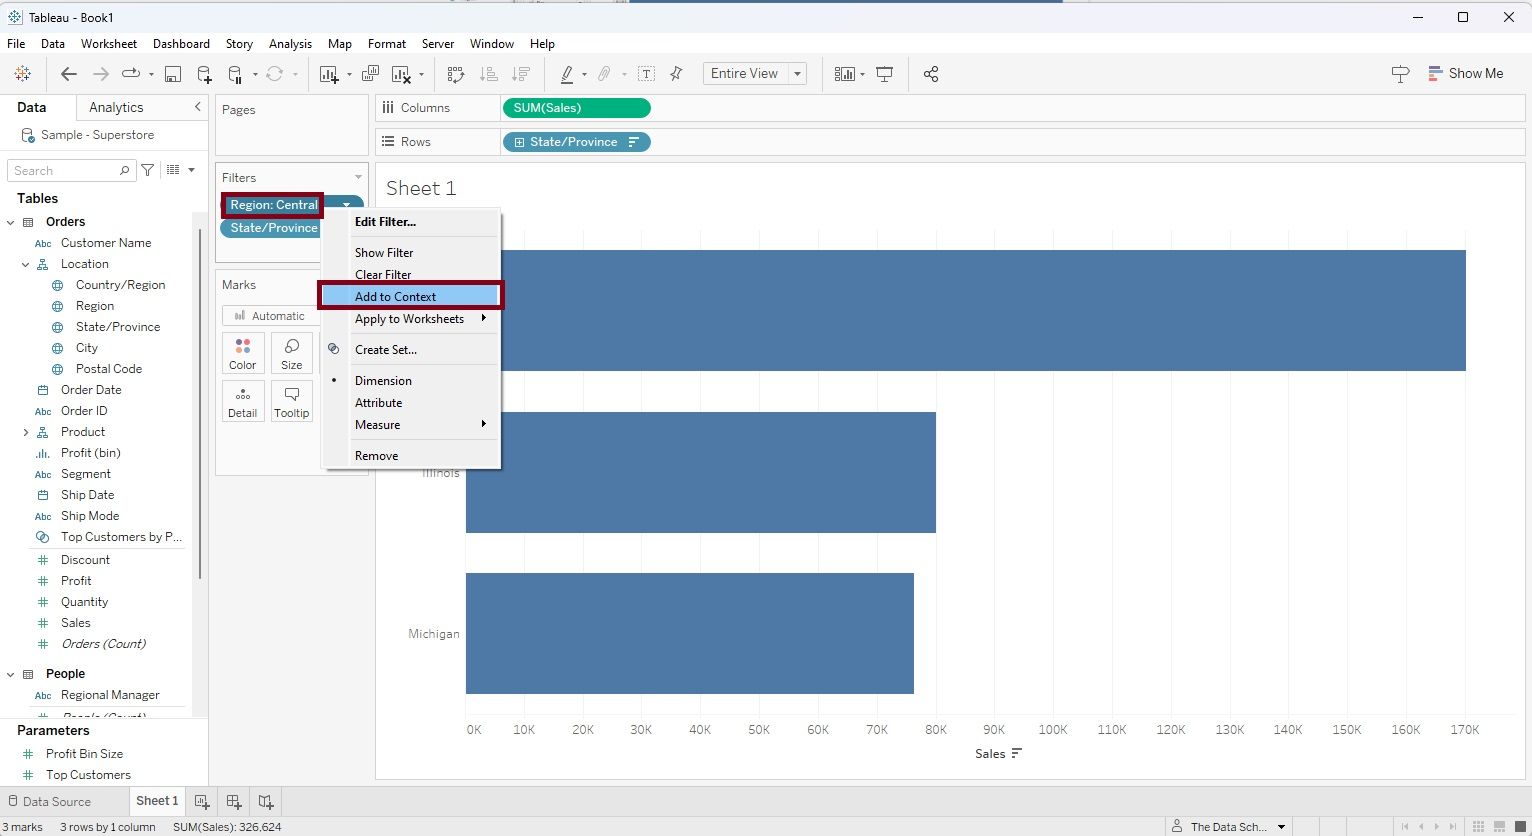
To make this change, follow these steps:
- Right-click on the 'Region' filter, and a context menu will appear.
- Select 'Add to Context' from the menu. This action will transform the 'Region' filter into a Context Filter, ensuring it takes precedence over the Top N calculation.
By applying a context filter, the figure below displays our desired outcome: the Top 10 States ranked by sales, categorized by regions in the USA. You can observe that the filter has transformed from a blue pill to gray, indicating the presence of a context filter.
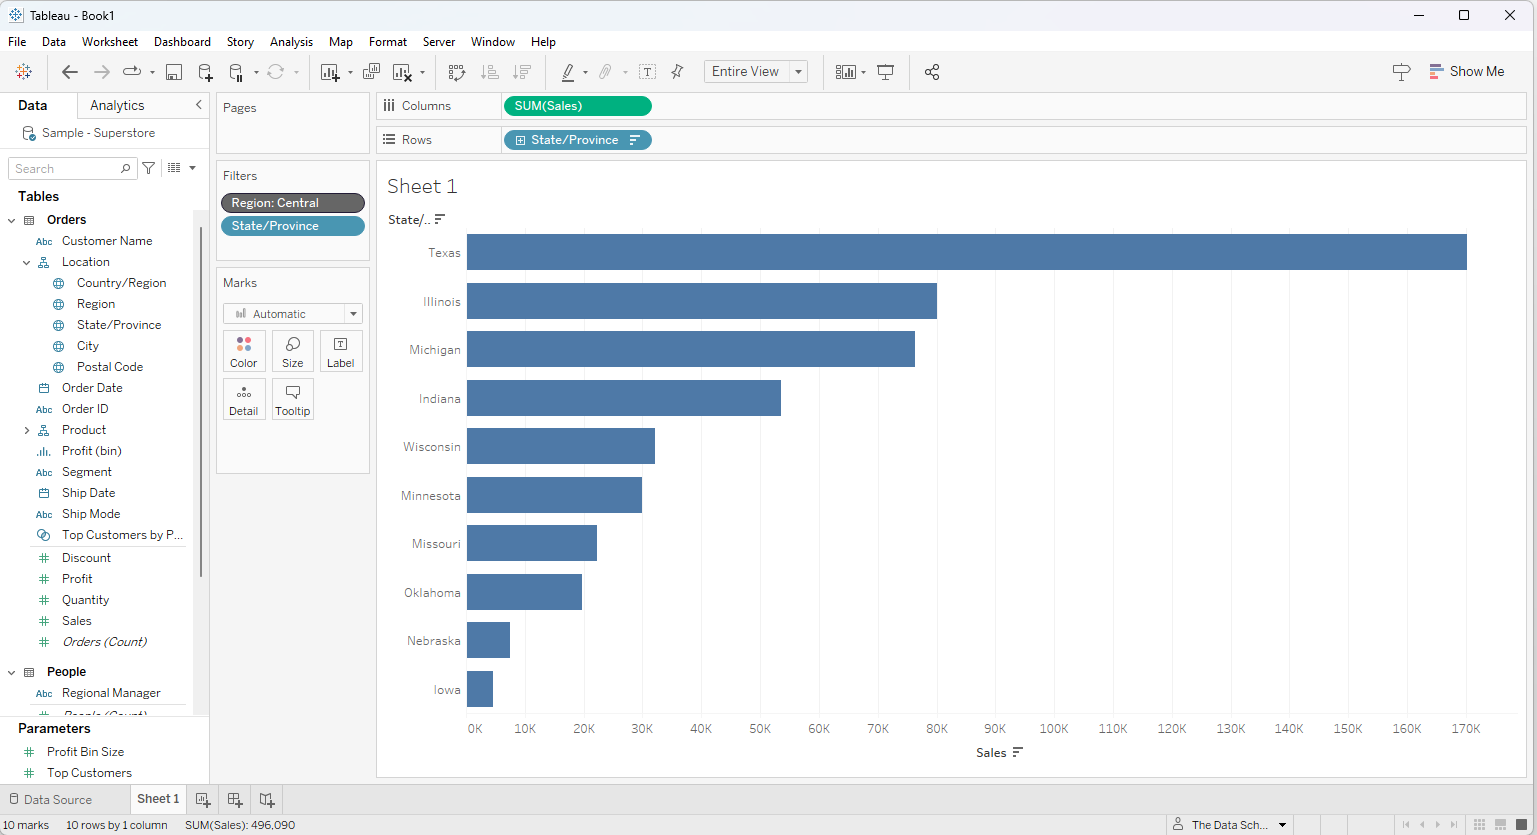
This example illustrates that context filters serve as high-level filters at the worksheet level, enabling users to influence the order of operations by applying filters before calculations. This approach helps produce the desired results by controlling how data is filtered and processed in Tableau.