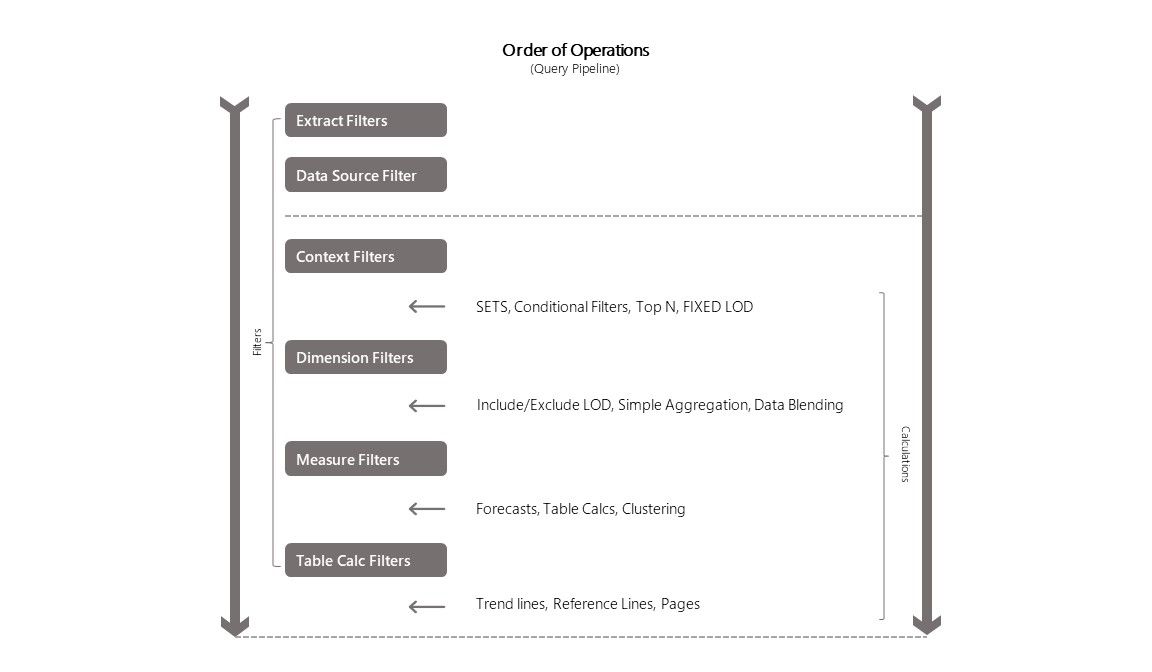
Filters play a crucial role in sub-setting specific rows of data from a dataset based on certain criteria. In Tableau, there are various types of filters that can be used at different stages of the data preparation and analysis process. Let's explore each of these filter types in detail. However, before applying any filters, it's important to grasp the concept of the order of operations in Tableau. The order of operations determines the sequence in which calculations and transformations are performed, impacting the effectiveness of the filters applied. As shown in the figure below, Tableau follows a specific sequence of operations to achieve the desired calculation outcomes. Initially, Extract and Data source filters are applied at a high level in the data source. Likewise, Context filters function as high-level filters at the worksheet level, enabling their application before dimension, measure and table calc filters. This arrangement has the potential to enhance the performance and accuracy of your visualizations by ensuring specific filters are prioritized and processed effectively.
Extract Filters
In Tableau, you have the option to connect to a dataset using either a live connection or an extract connection.
A live connection establishes a direct link to the data source, allowing for real-time updates. This means that any changes made to the data source will be reflected in Tableau. Alternatively, an extract connection enables you to bring in a snapshot of data from the data source into Tableau. The extract connection retrieves data from the data source and stores it as a local copy in the Tableau repository. Using extract filters, you can specify which subset of data you want to include in an extract.
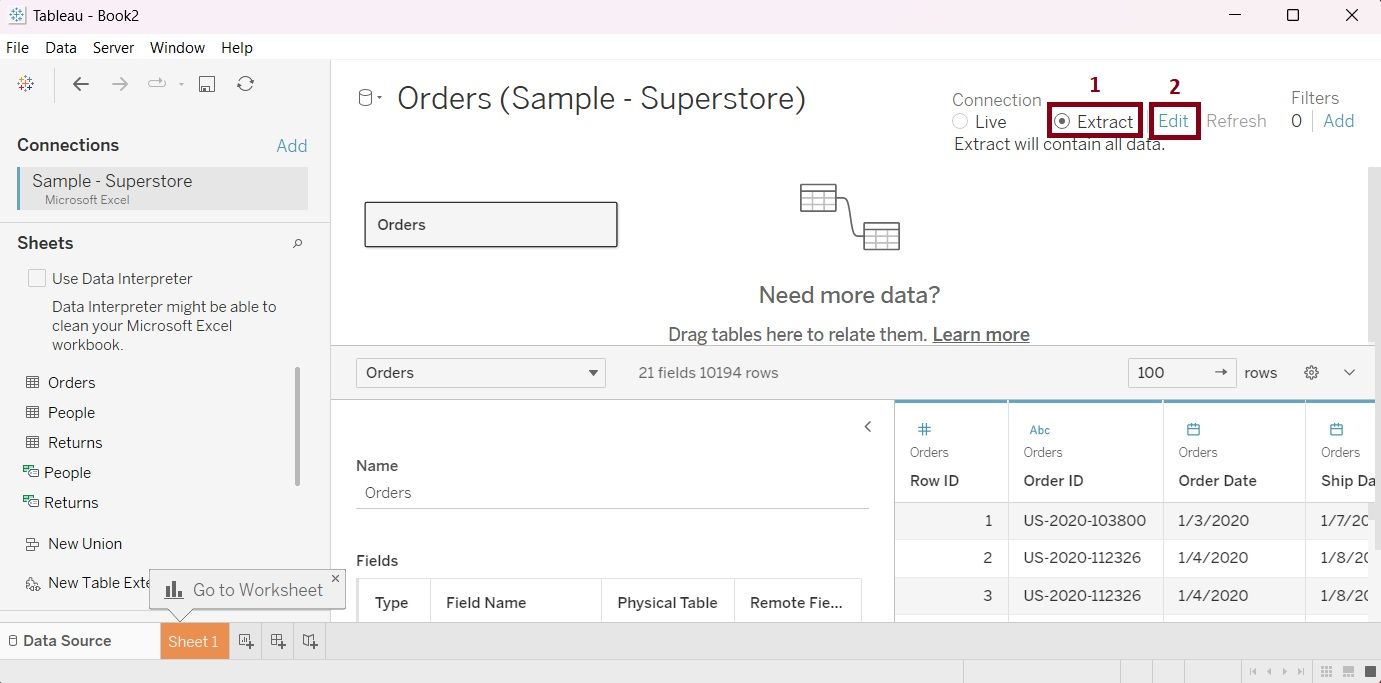
- By selecting the Extract radio button from the connection, we will be able to create a local copy of the extract in Tableau.
- Click the 'Edit' link to add extract filters to the extract, which creates a subset of data in the extract.
For a more detailed explanation of how to add extract filters, please refer to the following blog post, Tableau: How to apply Extract Filters.
Data Source Filters
Data source filters allow filtering data directly from the data source either from the live connection or extract. Data Source filters allow you to specify criteria or conditions that restrict the data included in the published workbook. By applying these filters, you can control which data is visible and accessible to users when they interact with the workbook. In the case of the extract connection data source filters applies after the extract filters as per the order of operations.
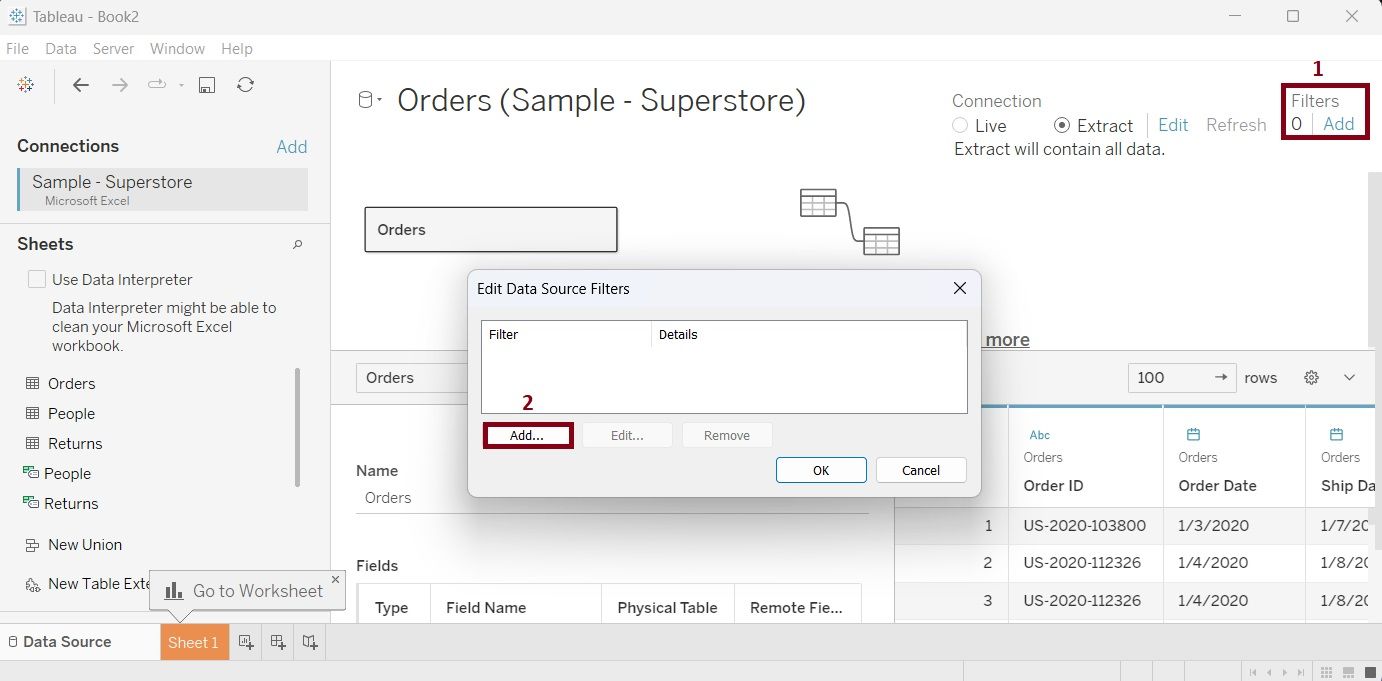
- To add a data source filter click the 'Add' link on the top right corner of the connection window.
- 'Edit Data Source Filters' dialog box will appear where you can add the required filters.
For a more detailed explanation of how to add data source filters, please refer to the following blog post, Tableau: Apply Data Source Filters.
Context Filters
In the order of operations of Tableau, the context filters apply after the extract and data source filters. However, it is a high level filter inside a worksheet which establishes filter conditions before dimension, measure and table calc filters. By creating a context filter, you essentially instruct Tableau to evaluate the specified filter before processing any other dimension or measure filters. This means that subsequent dimension and measure filters will become dependent on the independently operating context filter, leading to more controlled and accurate data analysis in certain scenarios.
Any dimension or measure filter can be changed into context filters in the filter shelves.

- Drag a dimension or measure to apply a filter in your worksheet.
- Right-click on the dimension or measure filter that you wish to turn into a context filter. A context menu will appear.
- From the context menu, choose "Add to Context." Once you select this option, the filter will change its color from its original color to gray. This change in color serves as an indicator that the filter has become a context filter.
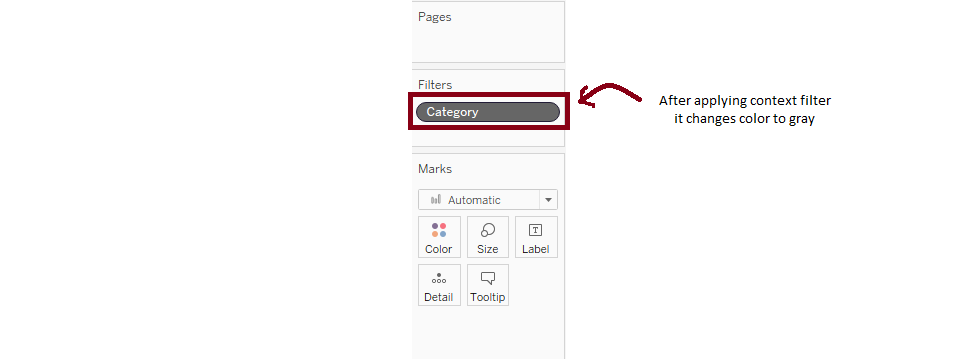
By setting a filter as a context, Tableau will process the context filter first and evaluate any other dimension or measure filters using the reduced data set based on the context filter.
For a more detailed explanation and example of how to add context filters, please refer to the following blog post, Tableau: Understand and Applying Context Filters.
Dimension Filters
Dimensions are qualitative attributes or categorical variables that provide context or describe the data. When we intend to filter the view within a worksheet based on specific conditions related to these dimensions, then we apply dimension filters. Dimension filters are low-level filters, however, in Tableau's order of operations, they are processed prior to Measure and Table Calc Filters.
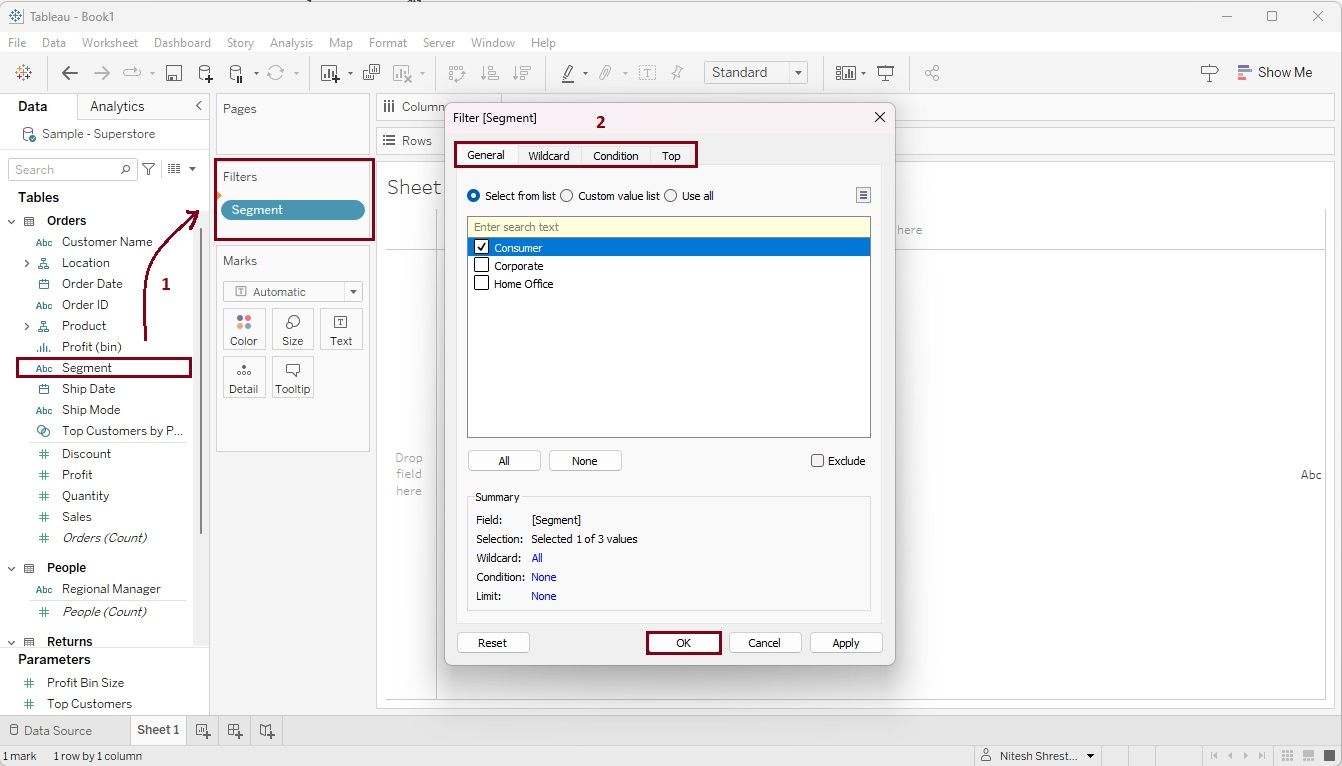
- To add a dimensional filter. drag a dimension or discrete field in the Filter Shelve.
- Apply the desired filter conditions and click 'Ok'. You can further customize the filtering process by utilizing the options available under the General, Wildcard, Condition, and Top tabs.
For a more detailed explanation and example of how to add dimensional filters, please refer to the following blog post, Tableau: Apply Dimension Filters.
Measure Filters
In Tableau, Measures represent quantitative fields that allow data to be filtered using different aggregations like sum, average, median, max, min, etc. These filters can be applied in the filter shelves, offering options such as 'Range of Values', 'At least', 'At most', and 'Special' to refine the dataset. It's important to note that as per the order of operations measure filters are processed after non-aggregated or dimensional filters.

To apply the measure filter.
- Drag a measure in the Filter Shelve. Options for aggregation (sum, min, max, etc.) will appear in a new window. Select an aggregation and click 'Next'
- Choose the value range, configure your filter settings, and click 'Ok'.
For a more detailed explanation and example of how to add measure filters, please refer to the following blog post, Tableau: Apply Measure Filters.
Table Calc Filters
Table calculations rely on what is in the view of a worksheet when computing calculations. Therefore, it is the lowest level of a filter as per Tableau's order of operations. We should be cautious while applying table calc filters as they can significantly impact the visual's results.
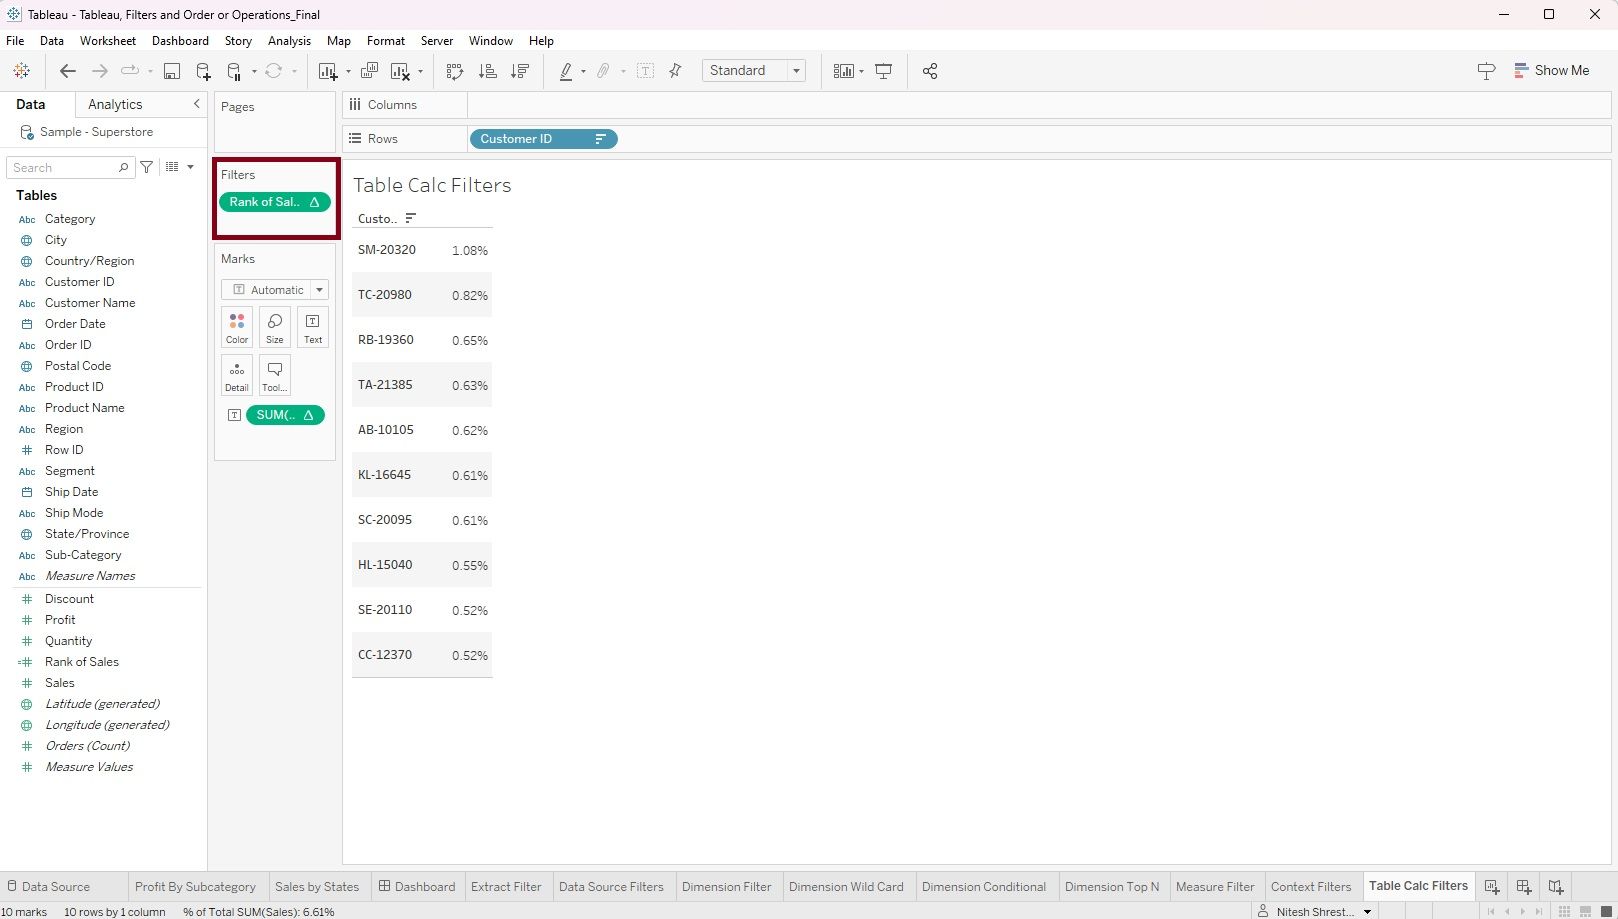
To apply the table calc filter, simply drag the table calculation field into the filter shelves. You can identify a table calculation field by a small triangle shape displayed on the pill. This allows you to easily spot and apply the table calculation filter to your data for further analysis and visualization.
For a more detailed explanation and example of how to add table calc filters, please refer to the following blog post, Tableau: Apply Table Calc Filters.
