


Finally, it is Day 5 of the dashboard week and I am excited that we will be graduating today. It's a big day and we will be presenting our dashboard to the entire DSNY team today. So planning to make this one of the best among the five dashboards.
The Task
Today, we're working with a dataset about school cafeteria inspections in NYC. It includes information from public, private, and parochial schools. Interestingly, DSNY5 used this data for their final application for the data school. Our Coach, Michael, wants to see how well our dashboard works and if it could be good for the final application.
The Ask
- Which are the schools that have been inspected the most compared to the average inspections per school?
- What are the most common violations found in these schools?
- What are the trends of inspection and violation for each school?
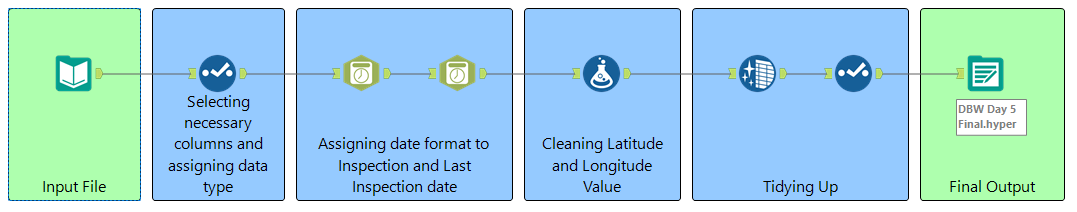
The Data Prep
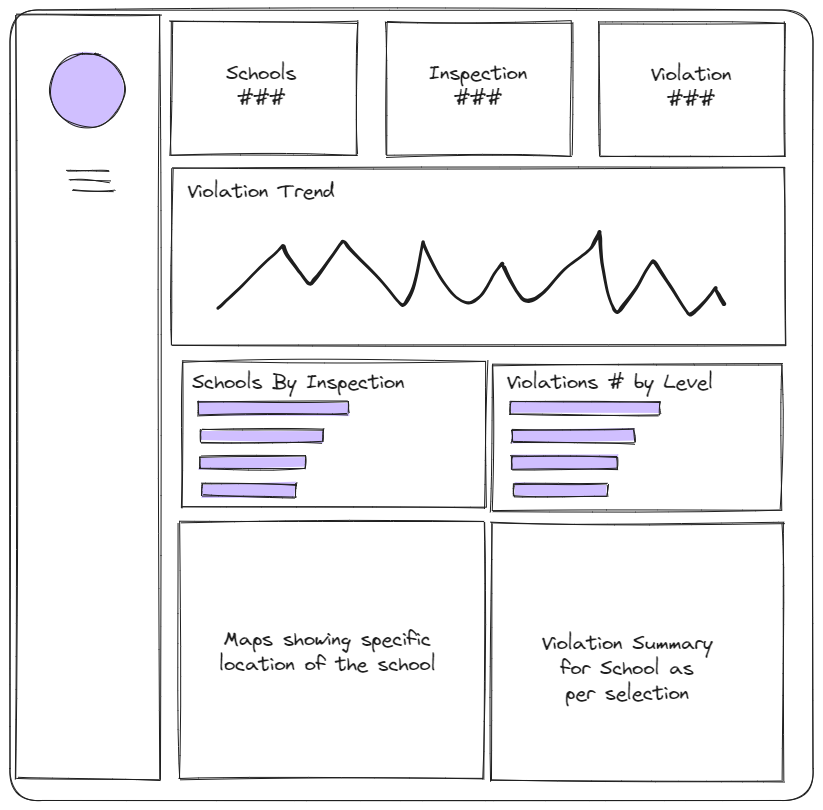
The Concept
The Dashboard
