Today is the third day of the dashboard week and we are working with APIs. We are instructed to access information from Rick and Morty API and build a dashboard. Rick and Morty is one of the popular animated science fiction TV episodes. The API contains resources for every character, episode, and location.
The Task
Our main goal is to retrieve the dataset from the API and use it to create a useful dashboard. Since I wasn't familiar with Rick and Morty so I focused on getting to know about the characters and deciding what important details to include in the dashboard.
The Ask
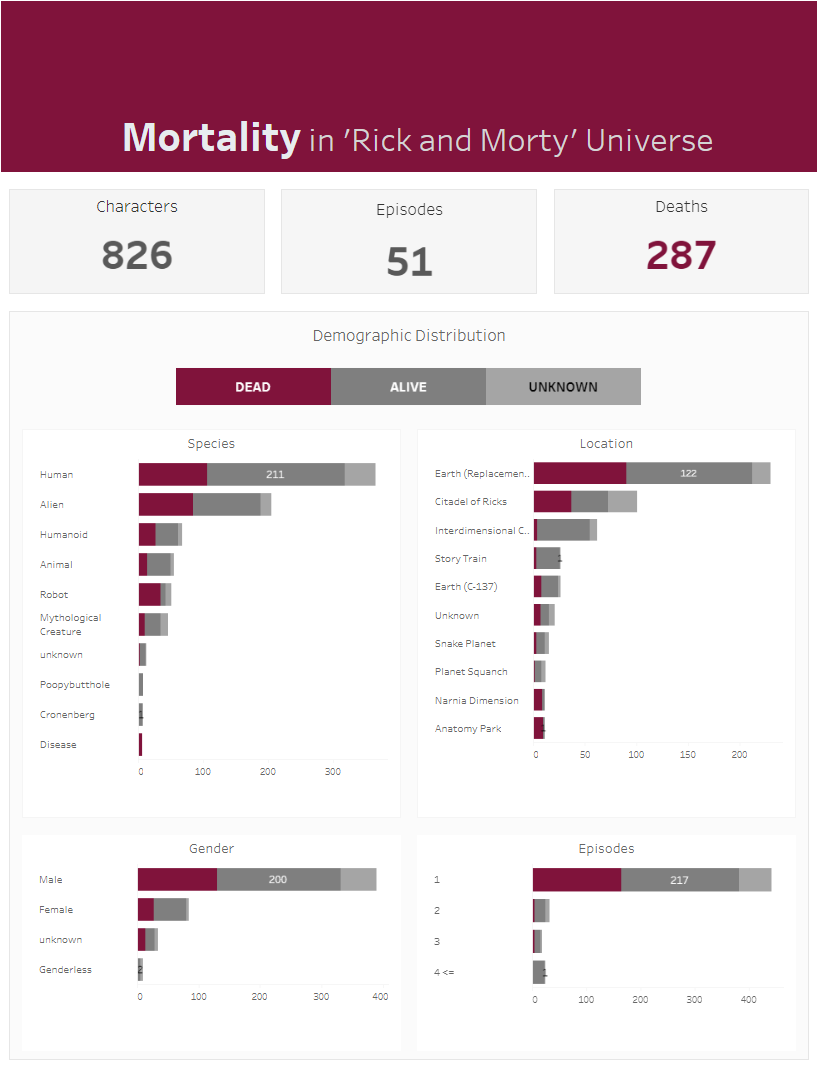
- What is the mortality rate of the characters in the episode?
- Distribution of Demographics among the dead?
- Who are the most and least popular characters as per the screen time (more than 5 episodes Threshold)?
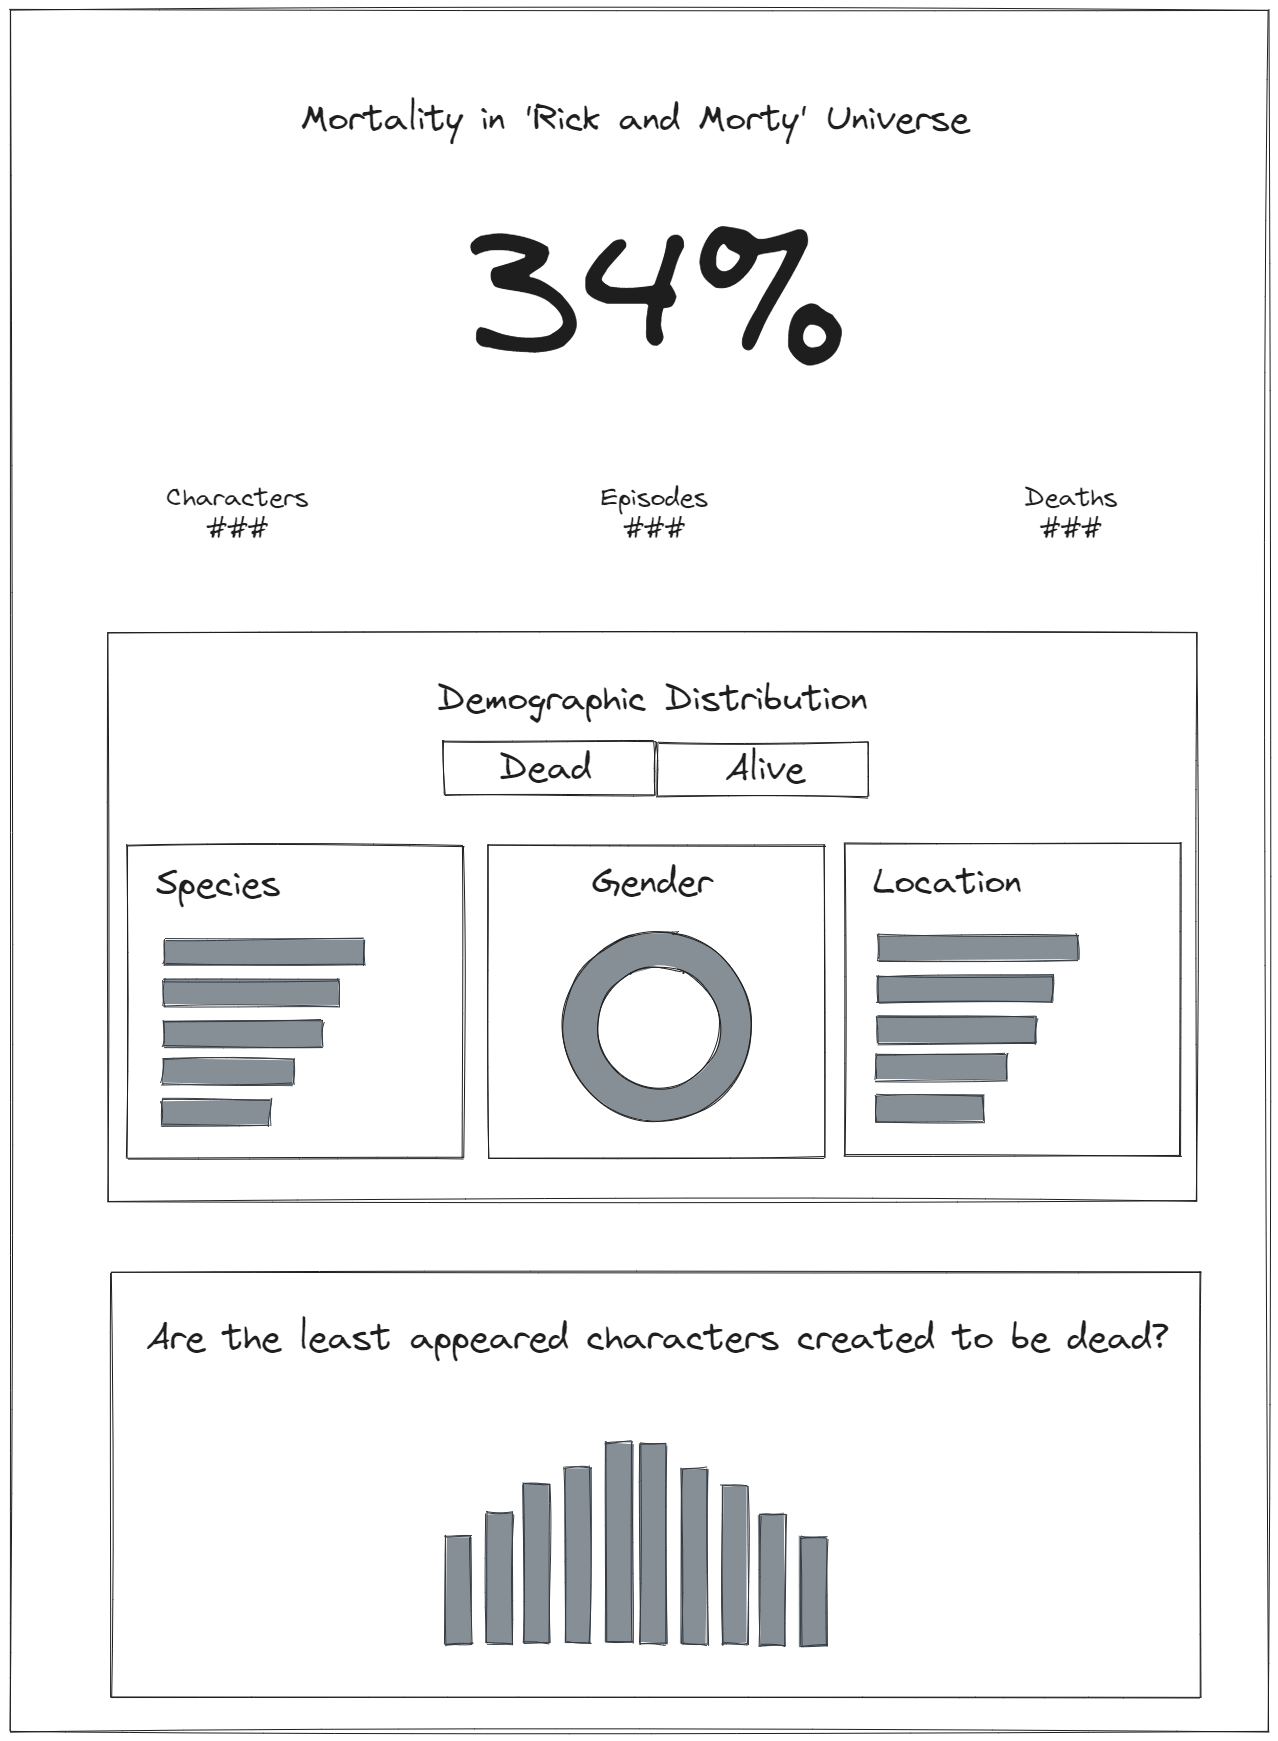
- Are the least popular characters created to be dead?
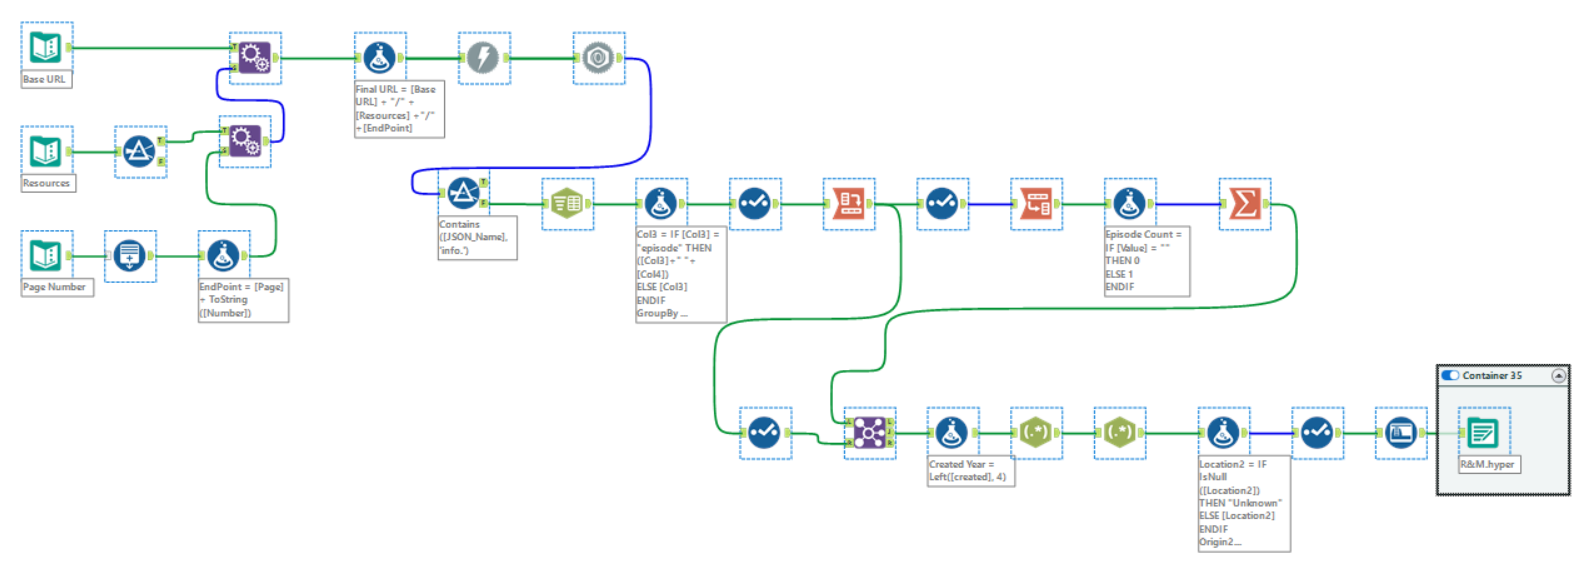
The Data Prep
The Concept
The Dashboard