This is the second day of the dashboard week and today we are working on survey data. This survey was conducted in 2013 among the Slovakian young people exploring their preferences, interests, habits, opinions, and fears. The details and the data of the survey can be found here.
The Task
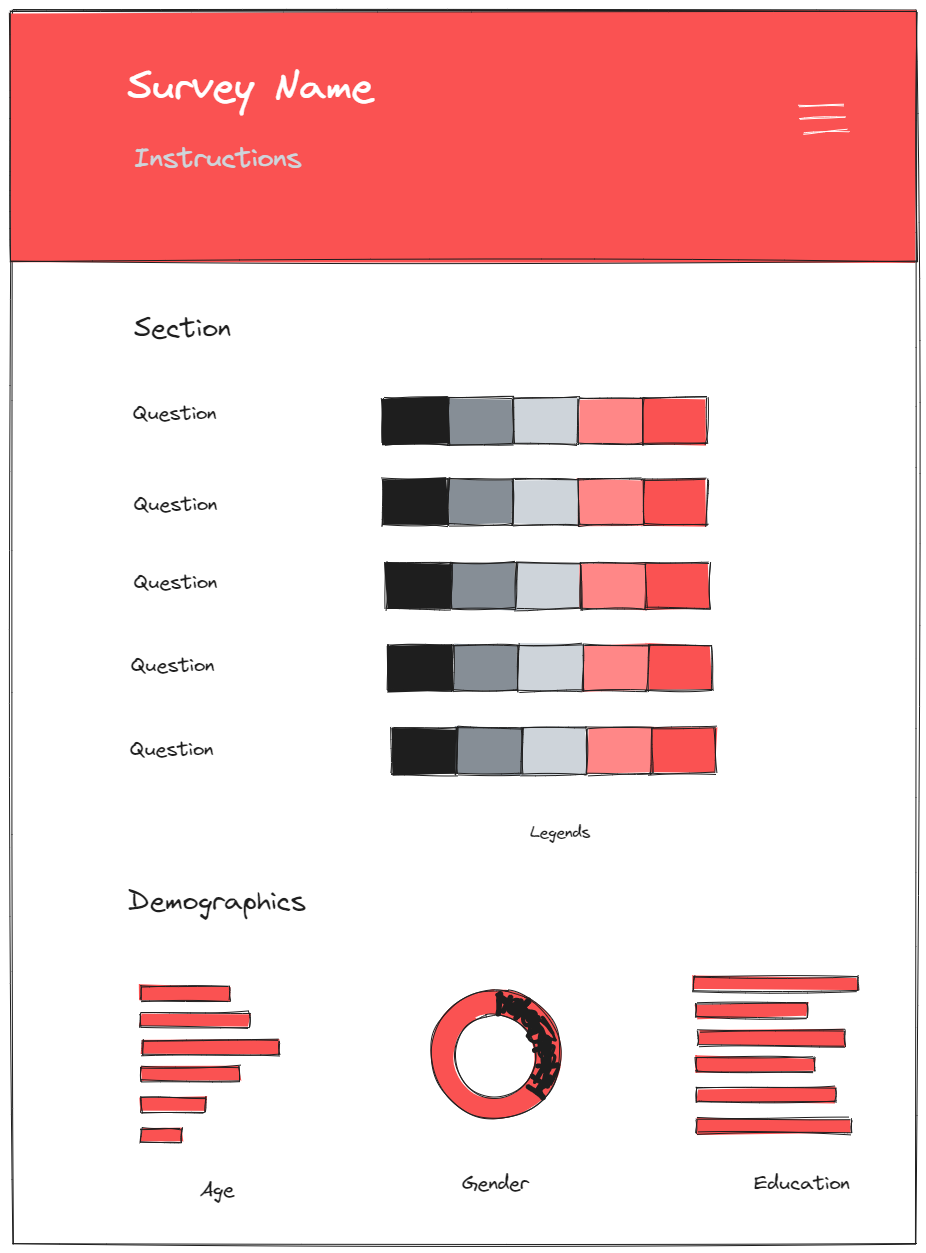
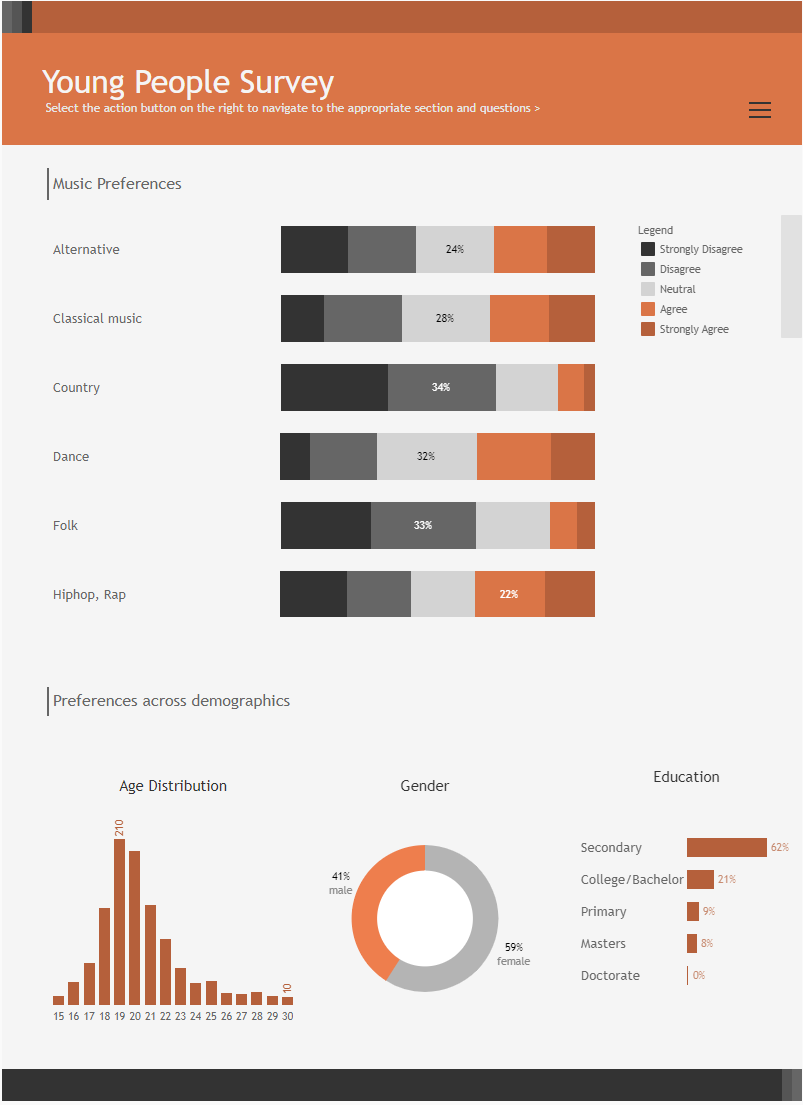
Today, I will be focusing on developing an effective visualization of Likert scale responses and finding a way to link it with other key visualizations.
The Ask
- What are the movie preferences of young people in Slovakia?
- How do their preferences vary across their demographics?
The Data Prep
Since this is survey data, my first approach was to pivot the table so that I could get the response value of every question for every respondent at a row level. This technique was part of our curriculum specifically tailored for handling survey data. Implementing this approach facilitates the creation of parameters for different sections and questions, offering users a more streamlined and customizable experience.

The Concept

The Dashboard

