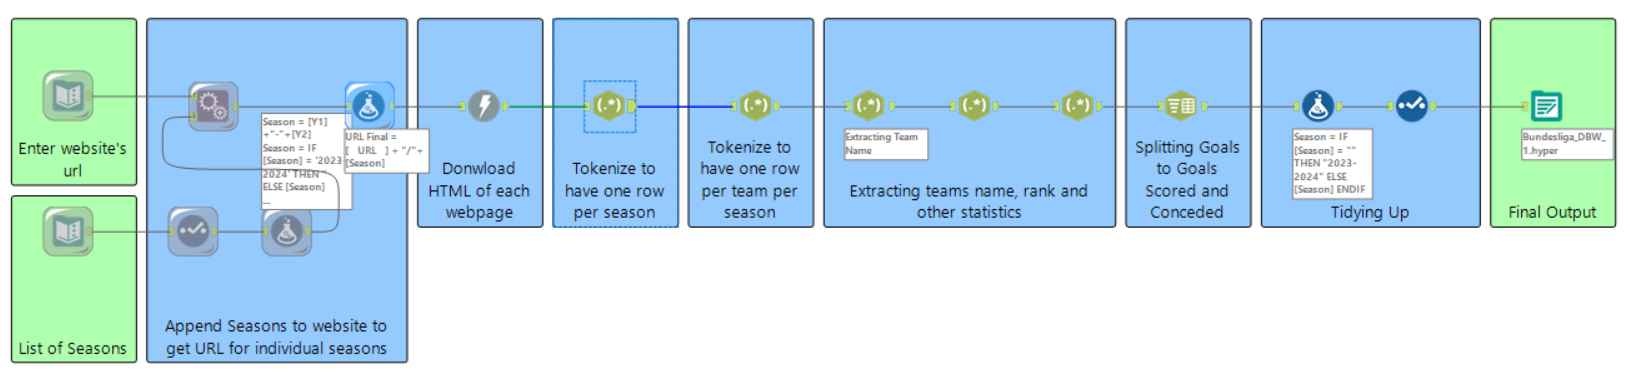
This is the first day of the dashboard week and today we were asked to scrape the German Bundesliga Website to get information about the teams' performance over time.
Data Prep
It had been a while since we last engaged in web scraping. It proved to be quite a challenge, taking me approximately three hours to navigate through the process and compile the final dataset. Nevertheless, the experience was enjoyable and intuitive.
The Ask
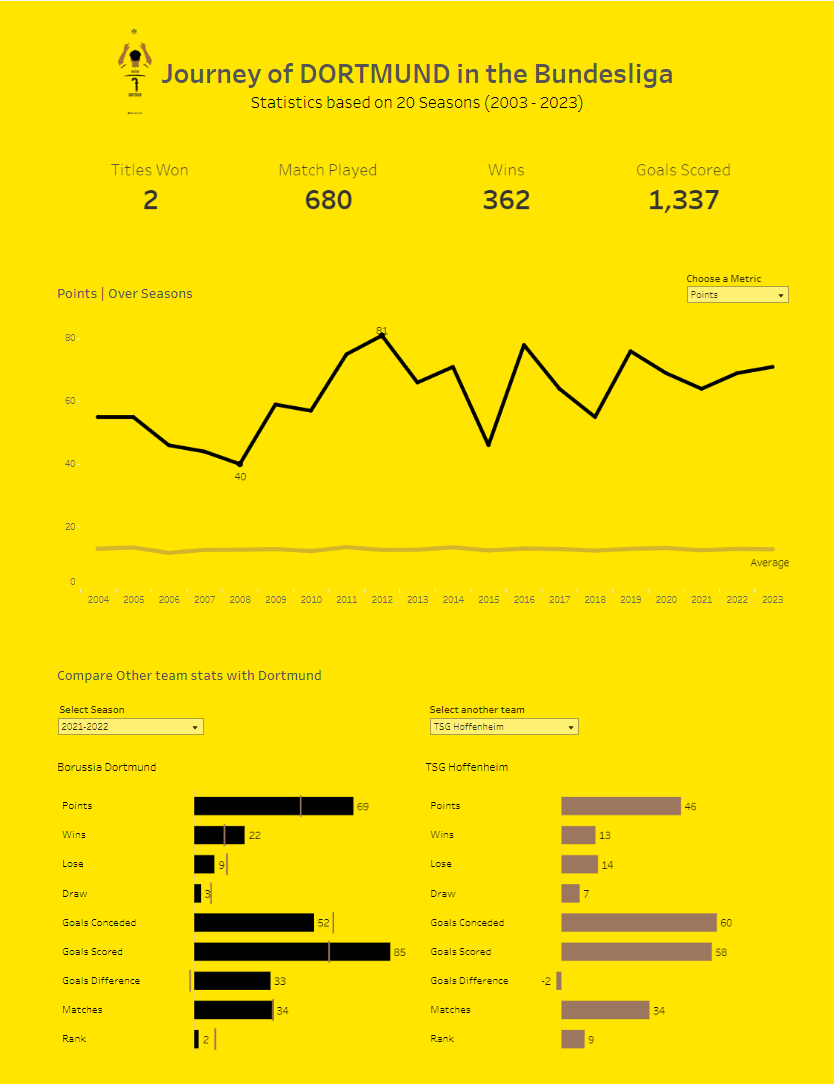
With this data, I approached following the journey of Borussia Dortmund in the Bundesliga. I tried to answer the following questions in my dashboard.
- How many times have Borussia Dortmund won the Bundesliga title in the past 20 seasons?
- How do the match statistics look over time (seasons)?
- How did the team perform in a season compared to another team?
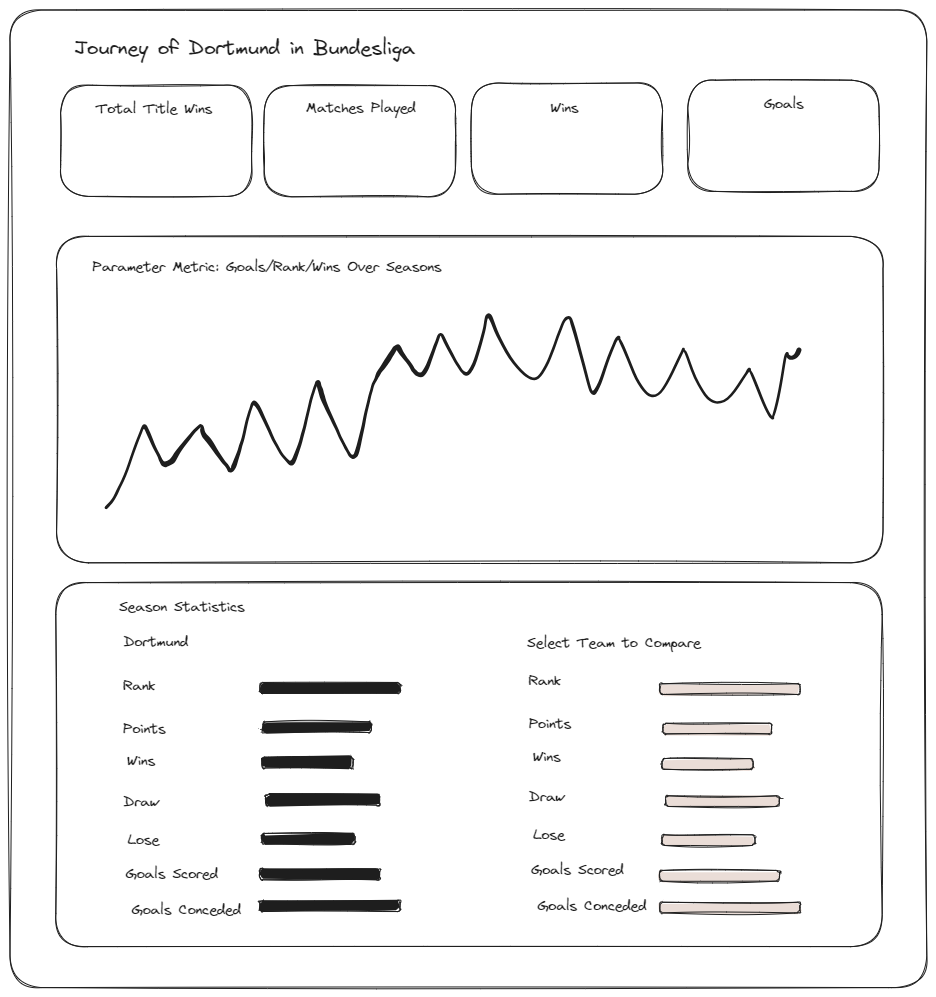
Wireframe
Dashboard