In the first part of the parameter and sets Series I explained how these tools can help us to highlight members of a data set based on one criteria (revenue of companies).
In part 2 I will take this analysis further and demonstrate how we can identify the most shining diamond companies based on 3 criteria: Revenue, Growth and Expenses. This will help us to decide in which companies we should invest and become a little bit more like the hugely successful investors Warren Buffett or Carl Icahn.
Create a Scatterplot
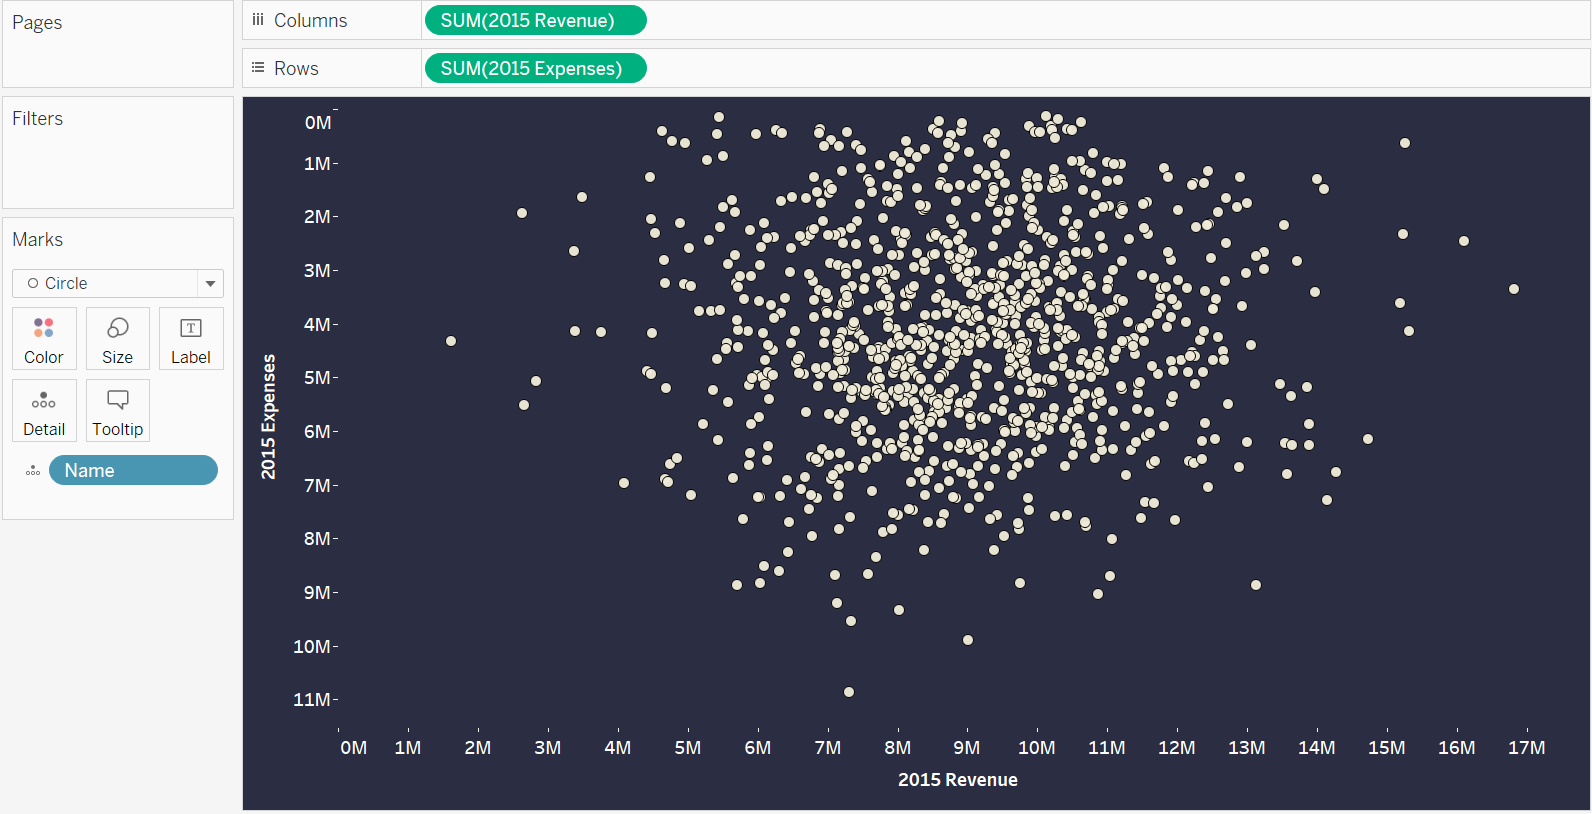
To evaluate companies based on revenue and expenses, I created a scatter plot with 2015 Expenses on the X-Axis and 2015 Expenses on the Y-Axis. Each data point represents a company.

Reversing the Y-Axis
On first sight, your audience could make the mistake to assume that the most valuable companies are in the top right corner since these would be the companies with the highest values for both measures. However, for expenses a smaller value is more desirable. Meaning, actually the bottom right corner contains most interesting companies. To make this chart easier to read, I reversed the Y-Axis. (Right click on the y-axis, edit axis, click on reversed) Now, the top right corner shows the companies an investor would look for – Low expenses and high revenue.

Create a parameter for each measure
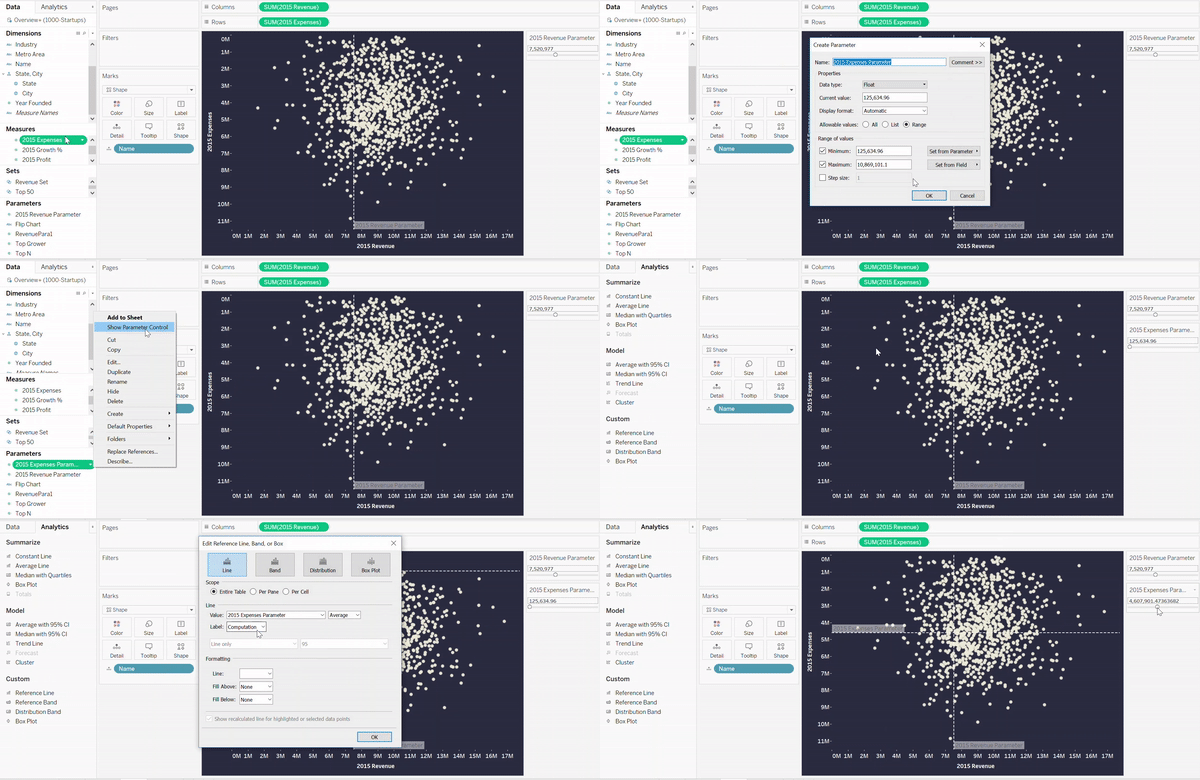
In the next step, I created 3 parameters, one for revenue, one for expenses and one called Top N Growth. Now, we can create two reference lines, based on the revenue and expenses parameters in order to split the view into quadrants. The reference line now moves based on the parameter control and creates quadrants with the companies which match or do not match these criteria.
Example for expenses reference line:

To separate the companies fall into the quadrants above the parameter level we set, it makes sense to colour them differently. Here, combined sets come into play.
First, we need to create 3 sets in total.
- The Expenses Set: Splits the companies into two groups (above and below the Revenue Parameter). Create a set with the following condition:
SUM([2015 Expenses])<=[2015 Expenses Parameter]
- The Revenue Set: Splits the companies into two groups (above and below the Expenses Parameter)
SUM([2015 Revenue])>=[2015 Revenue Parameter]
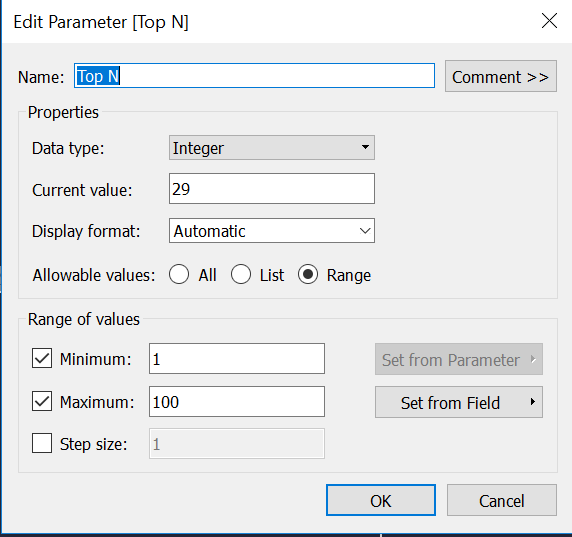
- Grower Set: Filters the companies based on the Top N Parameter (Values from 1-100)

In the next step, I want to create a final view which shows all companies which match all the conditions of all created sets and highlight them accordingly. Meaning a company which is below the expenses parameter, above the Revenue parameter and shows high growth, based on the growth parameter.
To achieve this view, do the following:
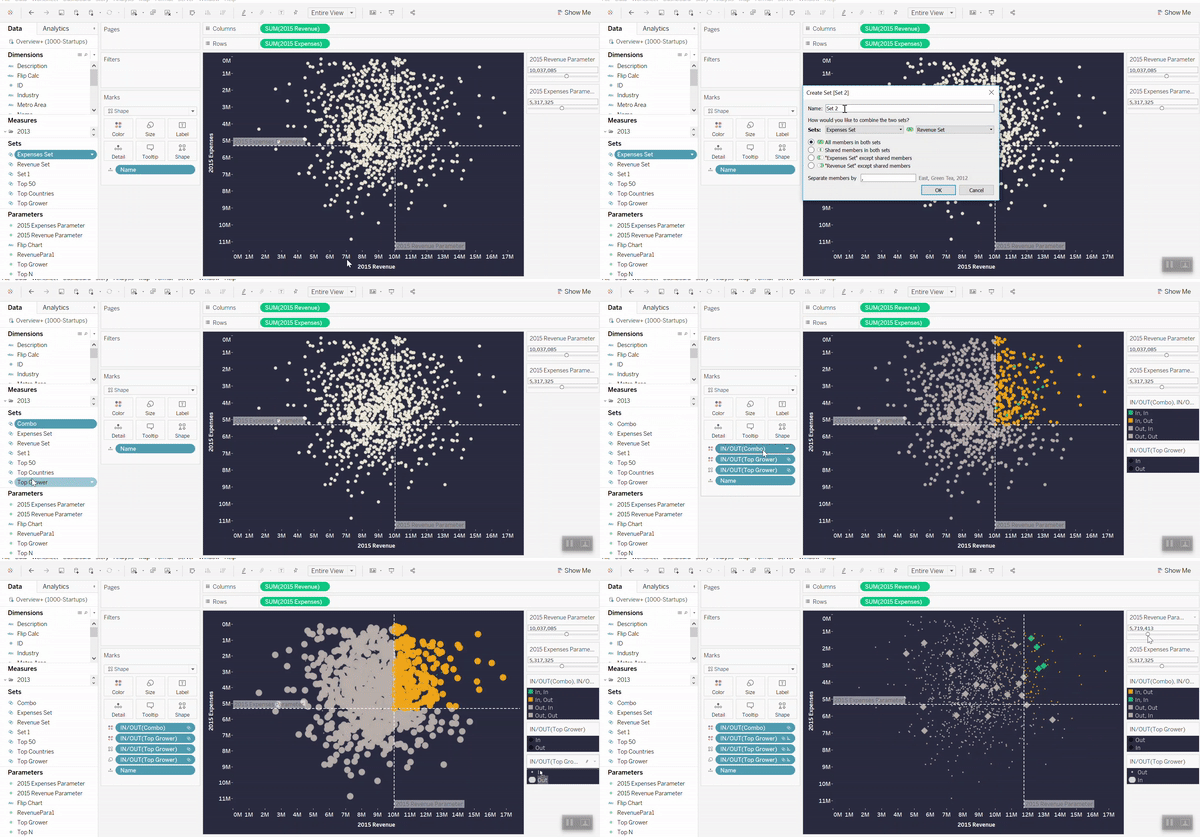
- Right click on Expenses set and select combined set
- Under Sets, selects expenses set and revenue set
- Chose shared members in both sets
This will create a third set which will return the shared members of both set.
To include the top grower, press the control key and select the newly created shared set and the Top Grower and drag them both together on color. This will create a new combined set in which all possible combinations of this set combo are displayed. The diamond companies are the companies in which all conditions are true.

