


Whether in life or in data, a good relationship takes deliberate effort and understanding rather than leaving things to guesswork. Modern BI and analytics tools make it easy to load tables and automatically guess how they connect. But be careful! If a relationship is wrong, your charts might still load without an error message but the numbers will quietly mislead you. But what does it need to actually understand the structure underneath the data?
Why not just one big flat table?
Storing everything in a single table feels like an easy way to avoid messy relationships altogether. One table seems like a simple solution (and in some cases it is), but it usually creates problems right from the start:
Maintenance and Accuracy
In a flat table, every real world change has to be updated across every single row (e.g. a customer is moving address several times, or changing their name). The customer's details are part of every row this customer appears in, so all of those have to be updated. If one row is missed the data is already wrong. The more that happens and the bigger the table the easier it is for errors to creep in.
Granularity Clash
Cramming everything into one table means different levels of detail need to live side by side (e.g. individual line-item sales with order-level shipping fees). That means a broader number will be repeated across several rows, which can cause aggregation issues. This means the sum of shipping cost for one customer might be widely inflated, as they have purchased several products per order.
Scale
A flat table is simply too fragile to scale. In the real world, business definitions change, new data sources arrive, structures shift etc. A flat table is too rigid and forces you to go back and rebuild your logic from scratch every time something changes.
So how do we solve this?
The core building blocks of a data model
Facts vs. Dimensions
To avoid the problems of one big flat table we want to split our data in fact and dimension tables. A fact table is your main table. It records what happens, things like orders, shipments, transactions. Anything you potentially want to aggregate or use as a measure.
A dimension table is a supporting table. On its own it doesn’t tell you much, but it gives your fact table context. It tells you who the customer is, where the warehouse is, what the product is etc. Without dimension tables, your numbers have no story.
You usually use the data from your fact table for measures and the data from your dimension table for filters and groupings. You can think about facts as verbs (someone bought something, an event happened) and dimensions as nouns (who bought it, what product was it, where was the store).
Keys
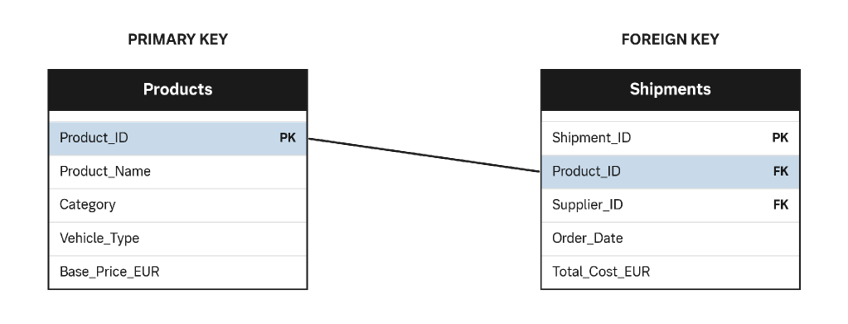
Great, we now have different tables (dimension & fact) but we also need to connect them. To be able to do that we need keys. A key is a column that identifies or connects rows. The word key implies it “unlocks” the connection between tables.
A primary key (PK) is the unique ID that belongs to a table. Every row has one, no two rows share the same one. Think of your National Insurance number. There is only one unique NI per person.
A foreign key is a copy of that ID in a different table. It is how that table says “I’m connected to something over there”. Think of your NI again, it shows up on every tax bill or payslip you ever receive.
So, one table owns the ID (primary key) and another table borrows it. When you find that pattern in two connected tables, you can understand how they relate.
Granularity
Every table in your model holds data at a specific level of detail, also called Granularity. It is important to understand what one row actually represents. It could be one order, one customer, one product, etc. Granularity determines how you join a table, how you aggregate it, and what questions it can answer. If you don’t know a table's granularity, you can’t safely join it to anything else. You risk duplicating data or losing rows without realising.
Understanding what one row represents for every table you work with is key to build coherent data models.
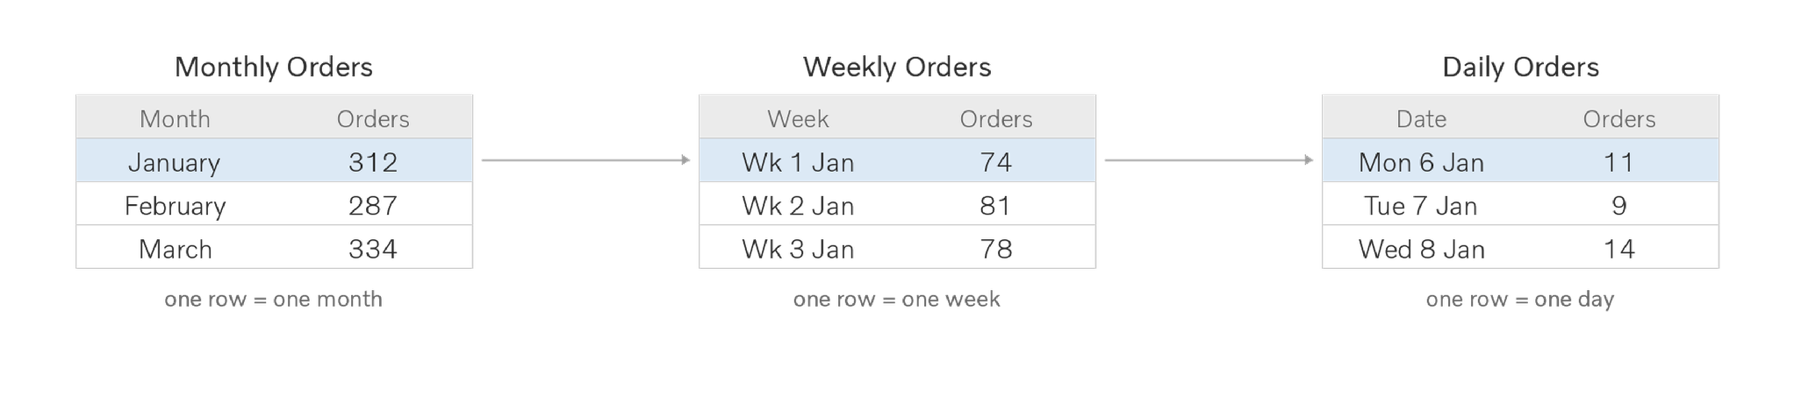
Look at this example: The same orders data can sit at a monthly level, a weekly level, or a daily level. One row means something different in each and that changes what the table can tell you.
Know your input & Know your Output
So, before you connect anything you need to inspect what you have. Determine whether a table is a fact or a dimension table, what the keys are (or could be) and what the granularity of each table is. Also check the data types, expected value ranges, and whether key columns contain nulls or formatting issues that will silently drop rows during a join.
Careful: Understanding what a column contains is not the same as knowing whether it is correct. You can know exactly what a column means and still get caught out if the data itself is flawed.
That’s not all though. You know what you are working with but the next question is what you need it to produce. What is this data going to be used for and who is going to use it. This shapes everything else. A finance report and an ops dashboard need different things from the same table. The output determines what the important fields are, and why they matter. Not every column matters equally, it depends on the output.
Once you know what your output needs to do, you also need to know what it should look like.
- How many columns are you expecting, and which ones matter?
- How many rows should your output have once everything is joined correctly?
The Planning Table
Whether you are building a data model from scratch or inheriting one that already exists, never start joining tables or building visuals blindly. Without a clear picture of how your tables are structured, it is easy to misinterpret numbers, duplicate rows, or miss silent errors.
A planning table should include information about:
- Table name
- Table role (fact or dimension)
- Number of rows
- Keys (primary and foreign keys)
- Granularity
Writing this out catches subtle traps early and noting your starting row counts gives you an anchor to check against if a join accidentally duplicates data.
You can read a bit more about why planning upfront matters in my previous blog post here.
Conclusion
At the end of the day, the key to a good relationship in data modelling isn’t letting your BI tool guess how things fit together, it’s putting in the upfront effort to understand your data before you connect a single table.
By moving away from one big flat table, separating your facts from your dimensions, identifying your keys, and always asking "what does one row represent?", you build a foundation you can actually trust. Taking five minutes to map everything out in a Planning Table might feel like an extra step, but it saves you from silent errors, inflated numbers, and hours of troubleshooting later on.