


Now that you know about the components of data modeling (see my previous blog), the hard part begins: applying your newfound knowledge to solving real business problems.
From seeing a business stakeholder's teams' message to being asked a question during an interview, you are tempted to jump into writing your SQL or dragging fields around on the canvas immediately. The thing is, by starting your code without knowing how your data is structured, you are making sure you get stuck and write duplicate rows or invalid numbers.
Without writing even one line of code, you should be able to take your business question through your data structure verbally. This is an easy step-by-step guide on how to do it.
Schema Overview
As an example of this process in action, consider the following example of analyzing Bean & Brew, which is a company of cafes. We have the following five tables in our schema:
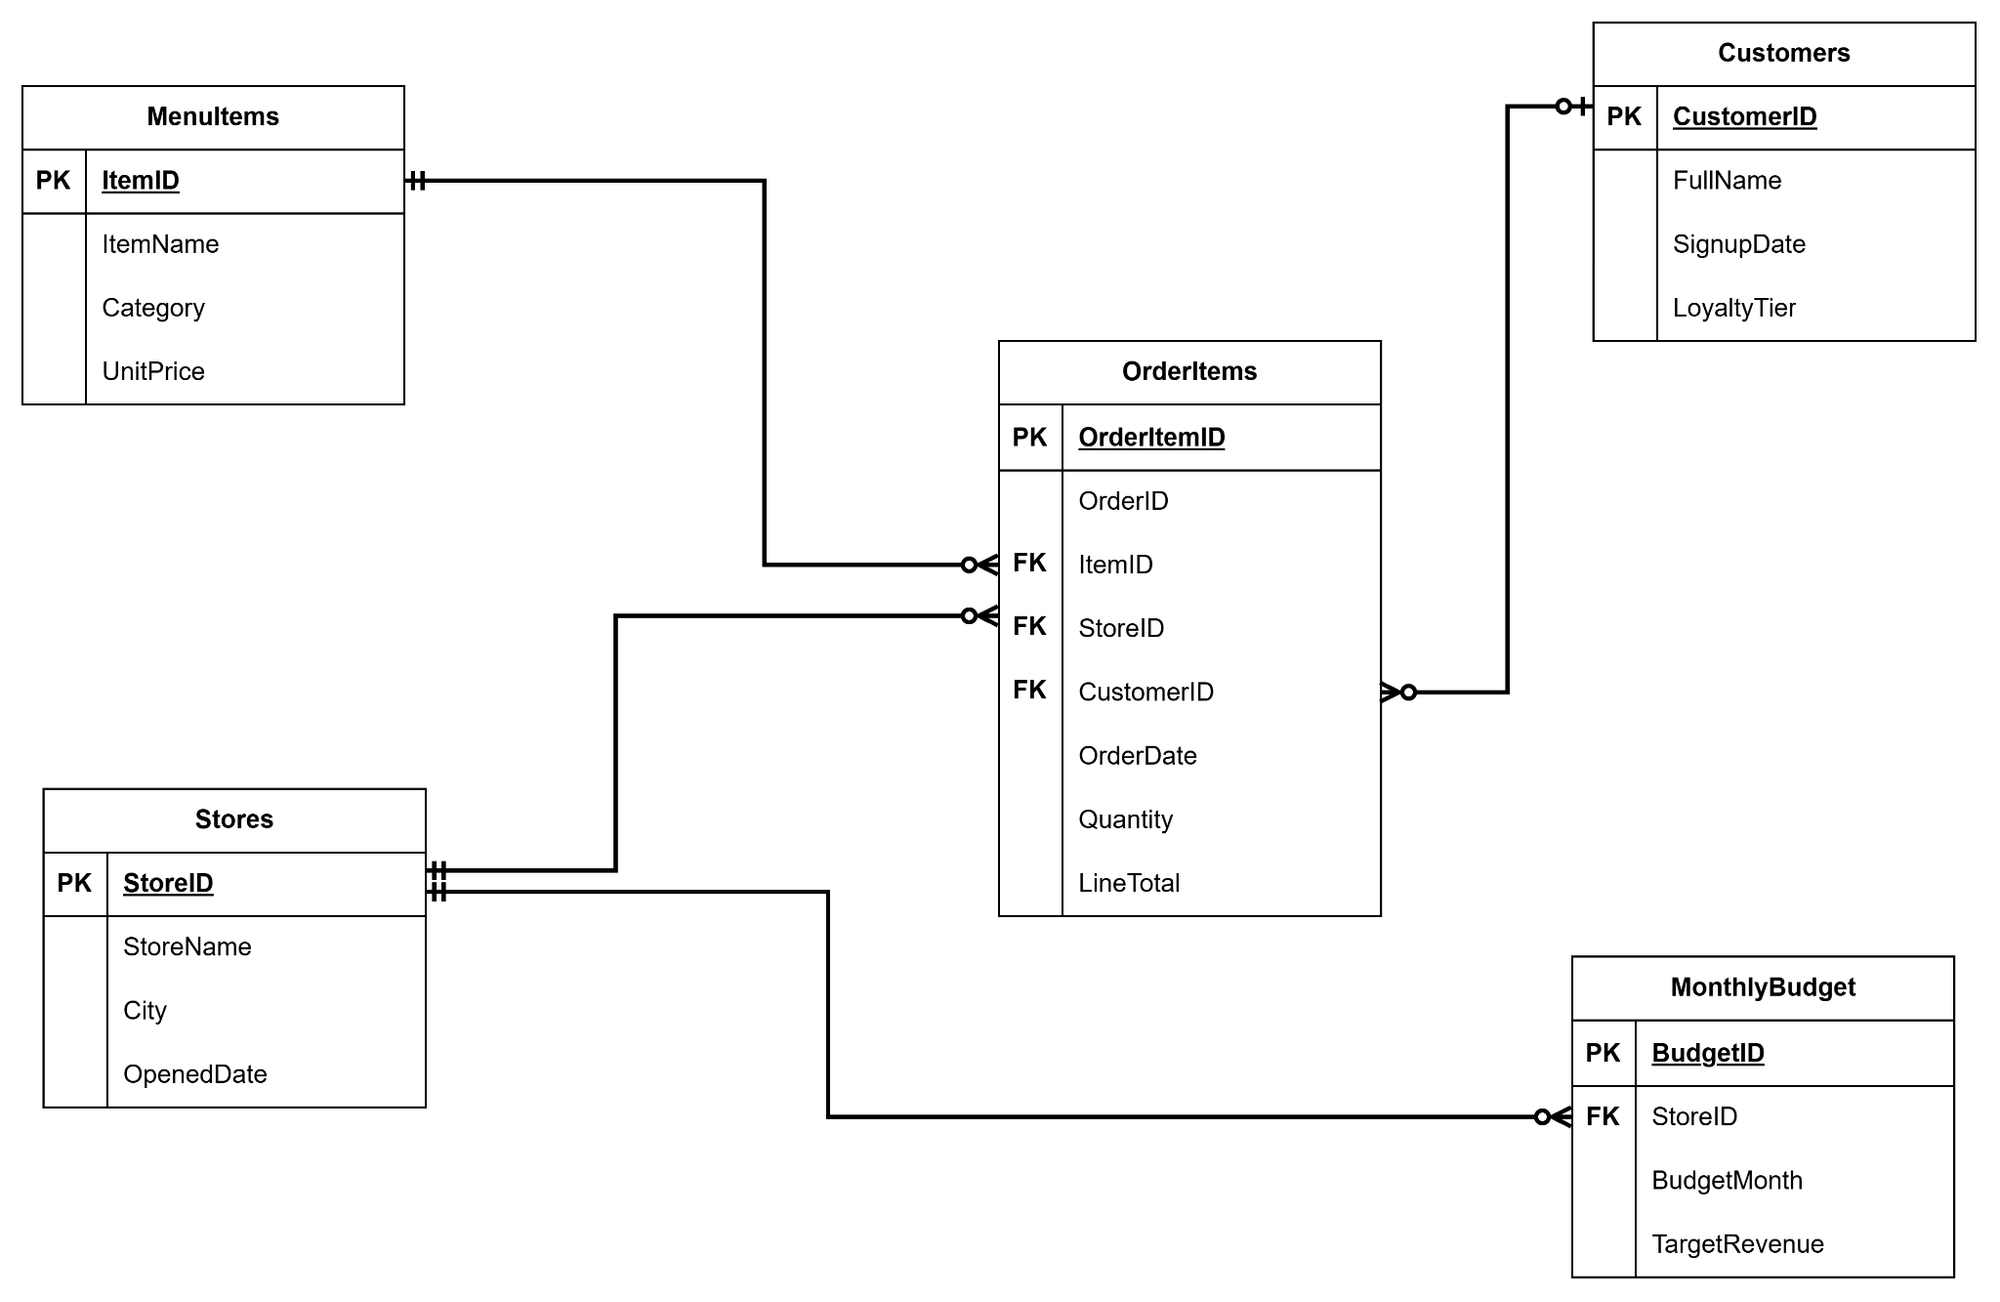
Dimension Tables:
- Customers (1 record per loyalty member – Key: CustomerID)
- MenuItems (1 record per product, grouped in Categories such as Coffee, Tea, and Bakery – Key: ItemID)
- Stores (1 record per cafe, including the City – Key: StoreID)
Fact Tables:
- OrderItems (1 record per item included in an order, with the corresponding OrderDate – Keys: ItemID, StoreID, CustomerID)
- MonthlyBudget (1 record per budget, per month for each store – Keys: StoreID, BudgetID)
Here is how our two fact tables are connected: OrderItems is linked to Customers, MenuItems, and Stores, while MonthlyBudgets are linked only to Stores (as budgets are assigned to cafes, not customers or menu items).
Now, let's consider a question from a business perspective and analyse it in the context of the schema we created:
"What stores in London made over £50,000 from Coffee sales in 2026, and what is their average spend per customer visit?"
Step 1: Break down the Question
Before you even look at your tables, translate the plain-English question into four concrete pieces:
- The Output Grain: What should one single row in your final result represent?
→ Here: one store
- The Metric: What number are you actually calculating?
→ Here: two metrics: total Coffee revenue, and total revenue divided by unique customer orders
- The Groupings: How does that metric need to be sliced or ordered?
→ Here: grouped by café
- The Filters: What boundaries narrow down the data?
→ Here: City = London, Category = Coffee, OrderDate in 2026, and total revenue greater than £50,000
Breaking the request down like this gives you a clear list of what you need to find in your model.
Step 2: Find your Way Through the Schema
With your list ready, look at your schema and trace where each piece lives and how those tables connect:
- Find your anchor table: Where do the core numbers live?
LineTotal (Revenue), OrderID, and OrderDate all sit in the OrderItems fact table.
- Find your filters and groupings: Which fields do we need to break down our information?
We need StoreName and City (Stores) and drink Category (MenuItems).
- Find the bridges: Check the keys connecting them.
Stores links to OrderItems via StoreID, and MenuItems links via ItemID. Both relationships flow cleanly from the dimension tables into the fact table, meaning our filters can travel straight through without any dead ends.
Steph 3: Spot the Difference in Granularity
This is the most important step. Before writing any logic, check the granularity of the tables on your path to make sure you won't accidentally distort your numbers.
In our coffee shop example, there are two classic traps waiting to catch you out:
- The Line-Item Duplication Trap: Remember that one row in OrderItems represents one item purchased, not one whole customer visit. If a customer buys a flat white and a croissant in a single visit, that OrderID appears twice. If you simply count rows in OrderItems to find "customer visits," your visit count will be inflated and your average spend per visit will be way too low. Spotting this grain upfront tells you that you must count distinct OrderIDs, not total rows.
- The Timing of Your Filter: Notice we have filters that happen before grouping (City = London, Category = Coffee, OrderDate in 2026) and a filter that happens after grouping (Total Revenue greater than £50,000). Mixing up the order of those filters completely changes the answer.
(Bonus check: What if a question asks you to compare actual sales against MonthlyBudgets? Your grain radar should go off immediately! Because OrderItems is at the daily item level and MonthlyBudgets is at the monthly store level, joining those two fact tables directly on StoreID will multiply every monthly budget across every single item sold in that store. Instead, you aggregate OrderItems up to the Store + Month level first so both tables share the exact same grain before comparing them.)
Step 4: Write Your Plain-English Recipe
Finally, put your path and grain checks together into a short, logical sequence:
- Start with the OrderItems fact table and link it to Stores (on StoreID) and MenuItems (on ItemID).
- Filter the rows down to London (City), Coffee (Category), and OrderDate values in 2026.
- Group the remaining rows by StoreName.
- For each store, calculate Total Revenue (sum of LineTotal) and Total Visits (count of distinct OrderIDs).
- Filter out any store where Total Revenue is £50,000 or less.
- Divide Total Revenue by Total Visits to get the Average Spend per Visit.
Once you have those six lines written down, writing the actual query or calculation becomes pure translation—the hard thinking is already done.
Conclusion
Query languages and analytics tools are just ways of talking to your data. If you don't know the route through your schema in plain English first, no amount of clever syntax will save you from a wrong number.
Next time you are handed a complex data request, resist the urge to start typing right away. Deconstruct the question, trace the keys on your schema, check the grain of every table you touch, and write out your recipe first. Your future self will thank you!