


It was Friday morning. We had each been given a different web scraping project to work on. Little did I know that by the end of the day I would have become familar with Alteryx’s reporting tools. Here’s how I ended up there.
Ben was responsible for setting our task, and he gave me the goal of building an app for pulling images from the website www.pexels.com and displaying them in an automatically generated PDF report.
You can see the final product in action over on The Information Lab YouTube page.
The first step was to dig into the HTML of the search result in order to pull out each image’s URL.
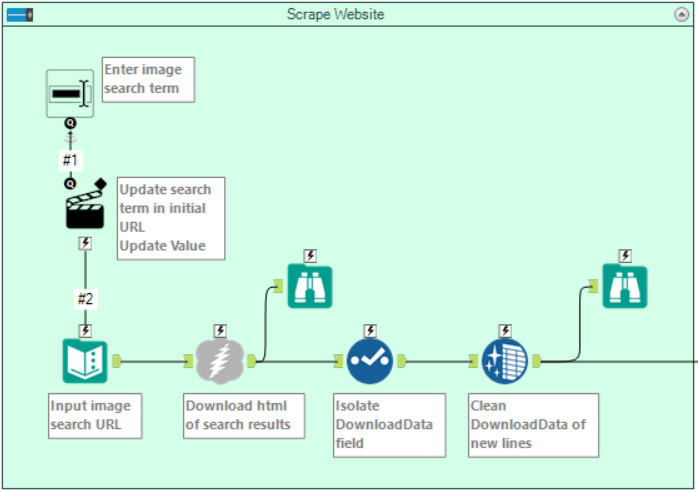
The start of the Alteryx workflow. The text input contains a search URL which can be updated by the user.
Using a RegEx tokenize I managed to fish out the image URLs, then I could use a second download tool to get the data for each image.
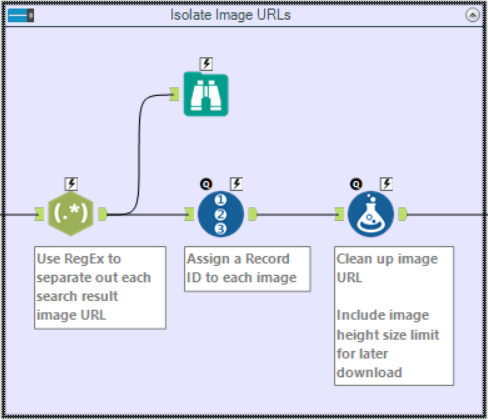
The RegEx tokenize extracts each image URL from the HTML code of the website.
In the download tool, there is an option to either download the data as a string (as used in the first download tool) or as a blob.
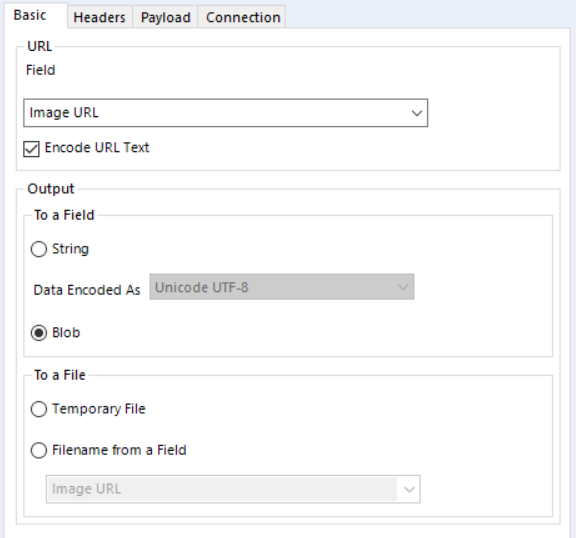
Configuration of the download tool in order to extract blob data.
I’m still not entirely sure what it means for data to be a blob, but I DO know that you can turn the downloaded blob data into an image using the Blob Convert tool. You can simply select Convert From a Blob Field, then Convert PNG, GIF or JPG blob to Report Snippet.
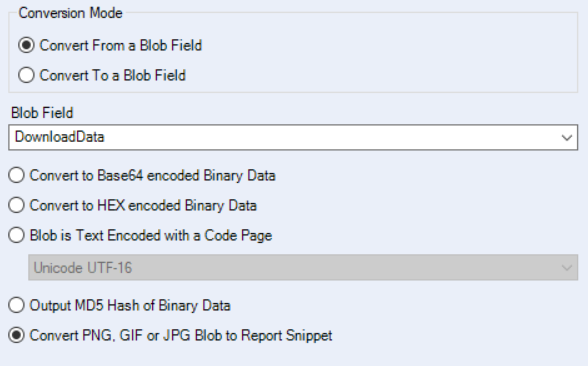
Blob Convert tool, converting JPG blob data into report snippets.
This report snippet can then be displayed using the Layout Tool. First they need to be assigned row numbers.

Blob download and conversion section of the workflow.
In order to display the images in a row-by-row format, I took the row ID and divided it by the number to be displayed per row, then rounded up to get the row number for each picture. For example, by dividing by three I get three images per row. This new field can be used in the group by option of the reporting tool to lay out images by the row number.
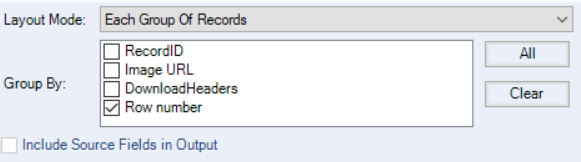
Use layout tool to group images into rows for the report.
Finally, I added a header, including The Information Lab’s company logo and an automated update to include the original search term in the report, as well as a footer. Use layout tool to group images into rows for the report.
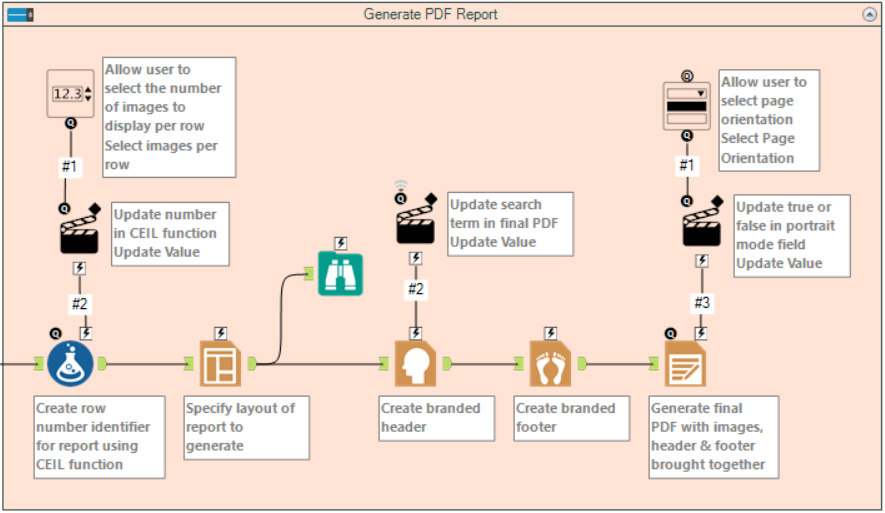
Report generation section of workflow.
This final set of layout elements can be brought together with the Render tool which stitches everything together and produces a file of the specified type in a given orientation. I set this to generate a PDF report which is updated each time the app is run, as you can see below.
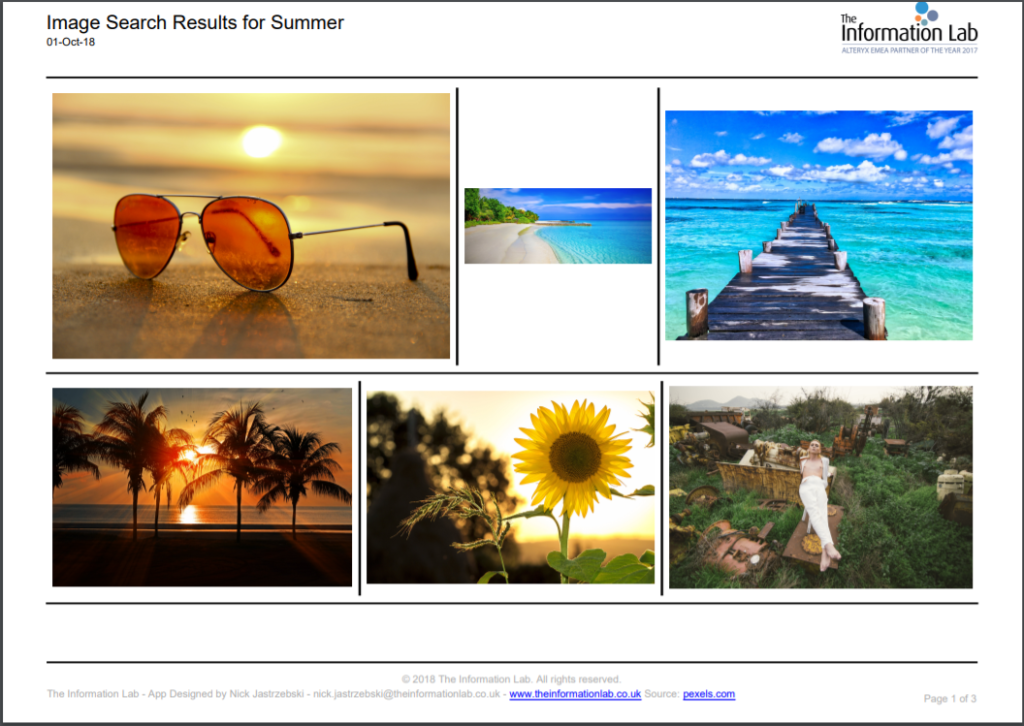
Branded PDF report based on image search for Summer on www.pexels.com
As you can see these reporting tools are potentially very powerful for generating automated, customised reports, despite their clunky, unintuitive interfaces. When first faced with them, I struggled to get my head around what anything meant, but with a bit of help, googling and perseverance, I got there in the end!