The final morning’s challenge was really exciting for me – visualising meteorite landings across the globe from NASA’s API.
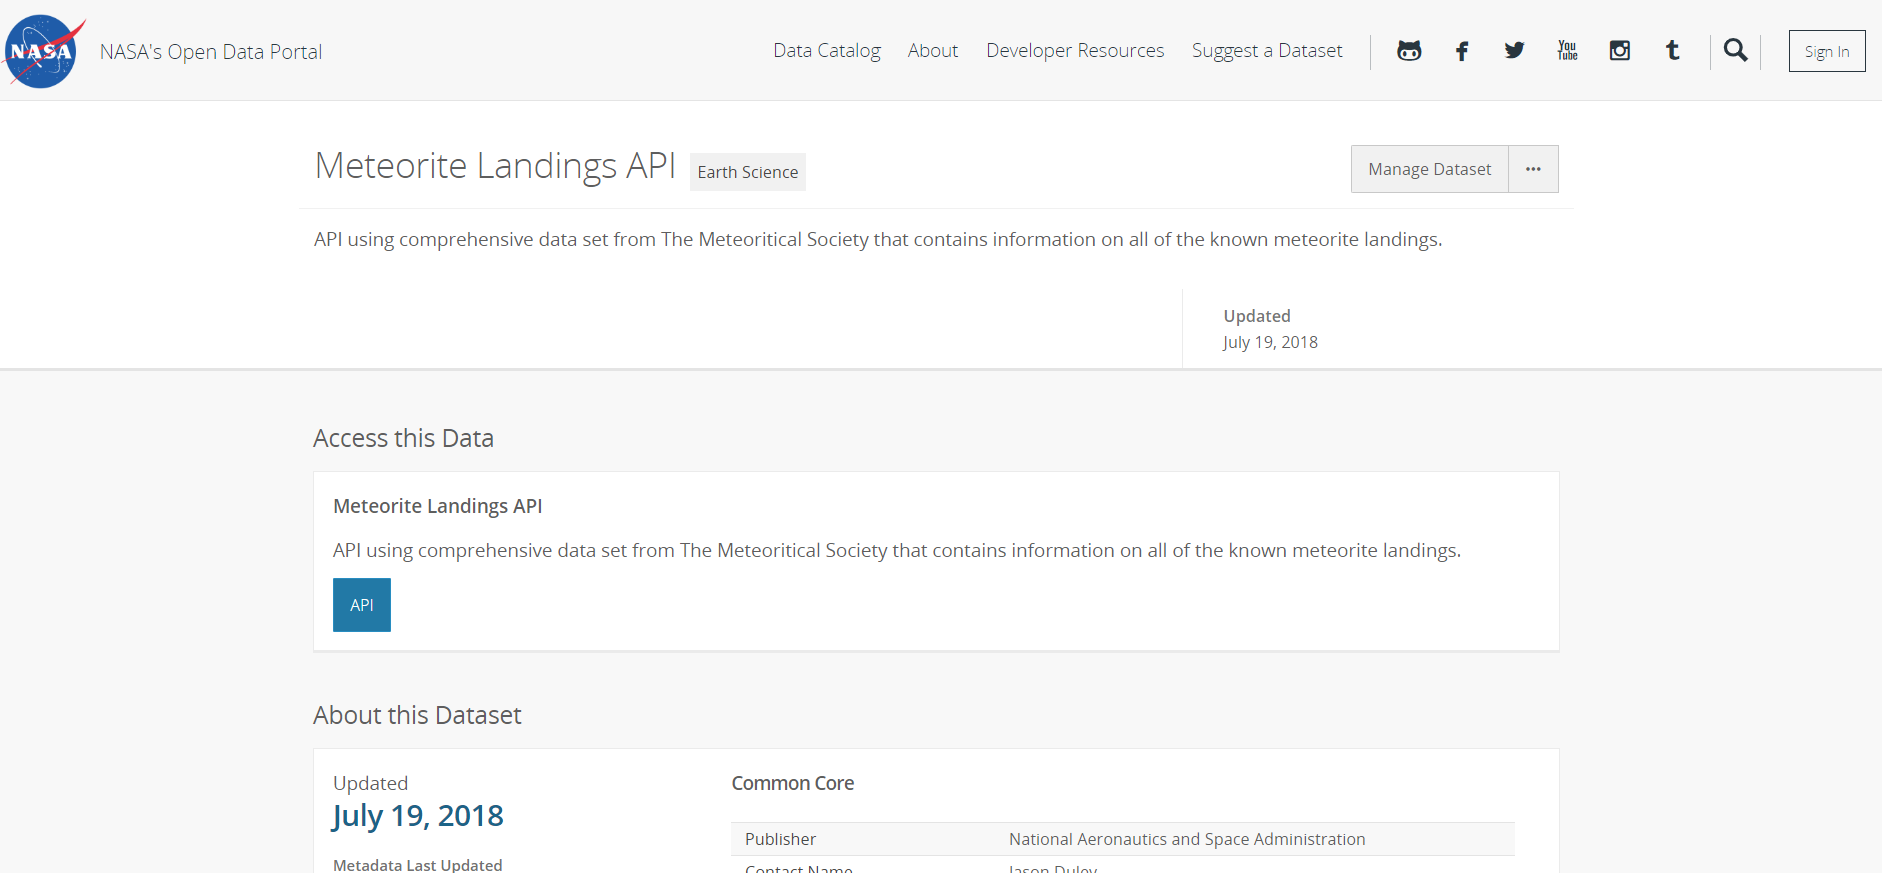
The JSON from the API was nice and easy to work with.
Andy said we didn’t need to use Alteryx to get the data since Tableau can read JSON files, but I did a quick download & parse just for good measure.

A short workflow today
Diving into the data, I started to remember all the time spent at university studying meteorite type and what they mean. I spent quite some time organising the “recclass” field into a hierarchy of groups only partially remember from my degree…
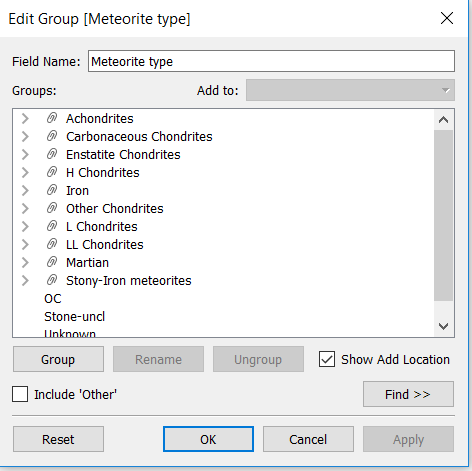
Points for anyone who knows what a chondrite is!
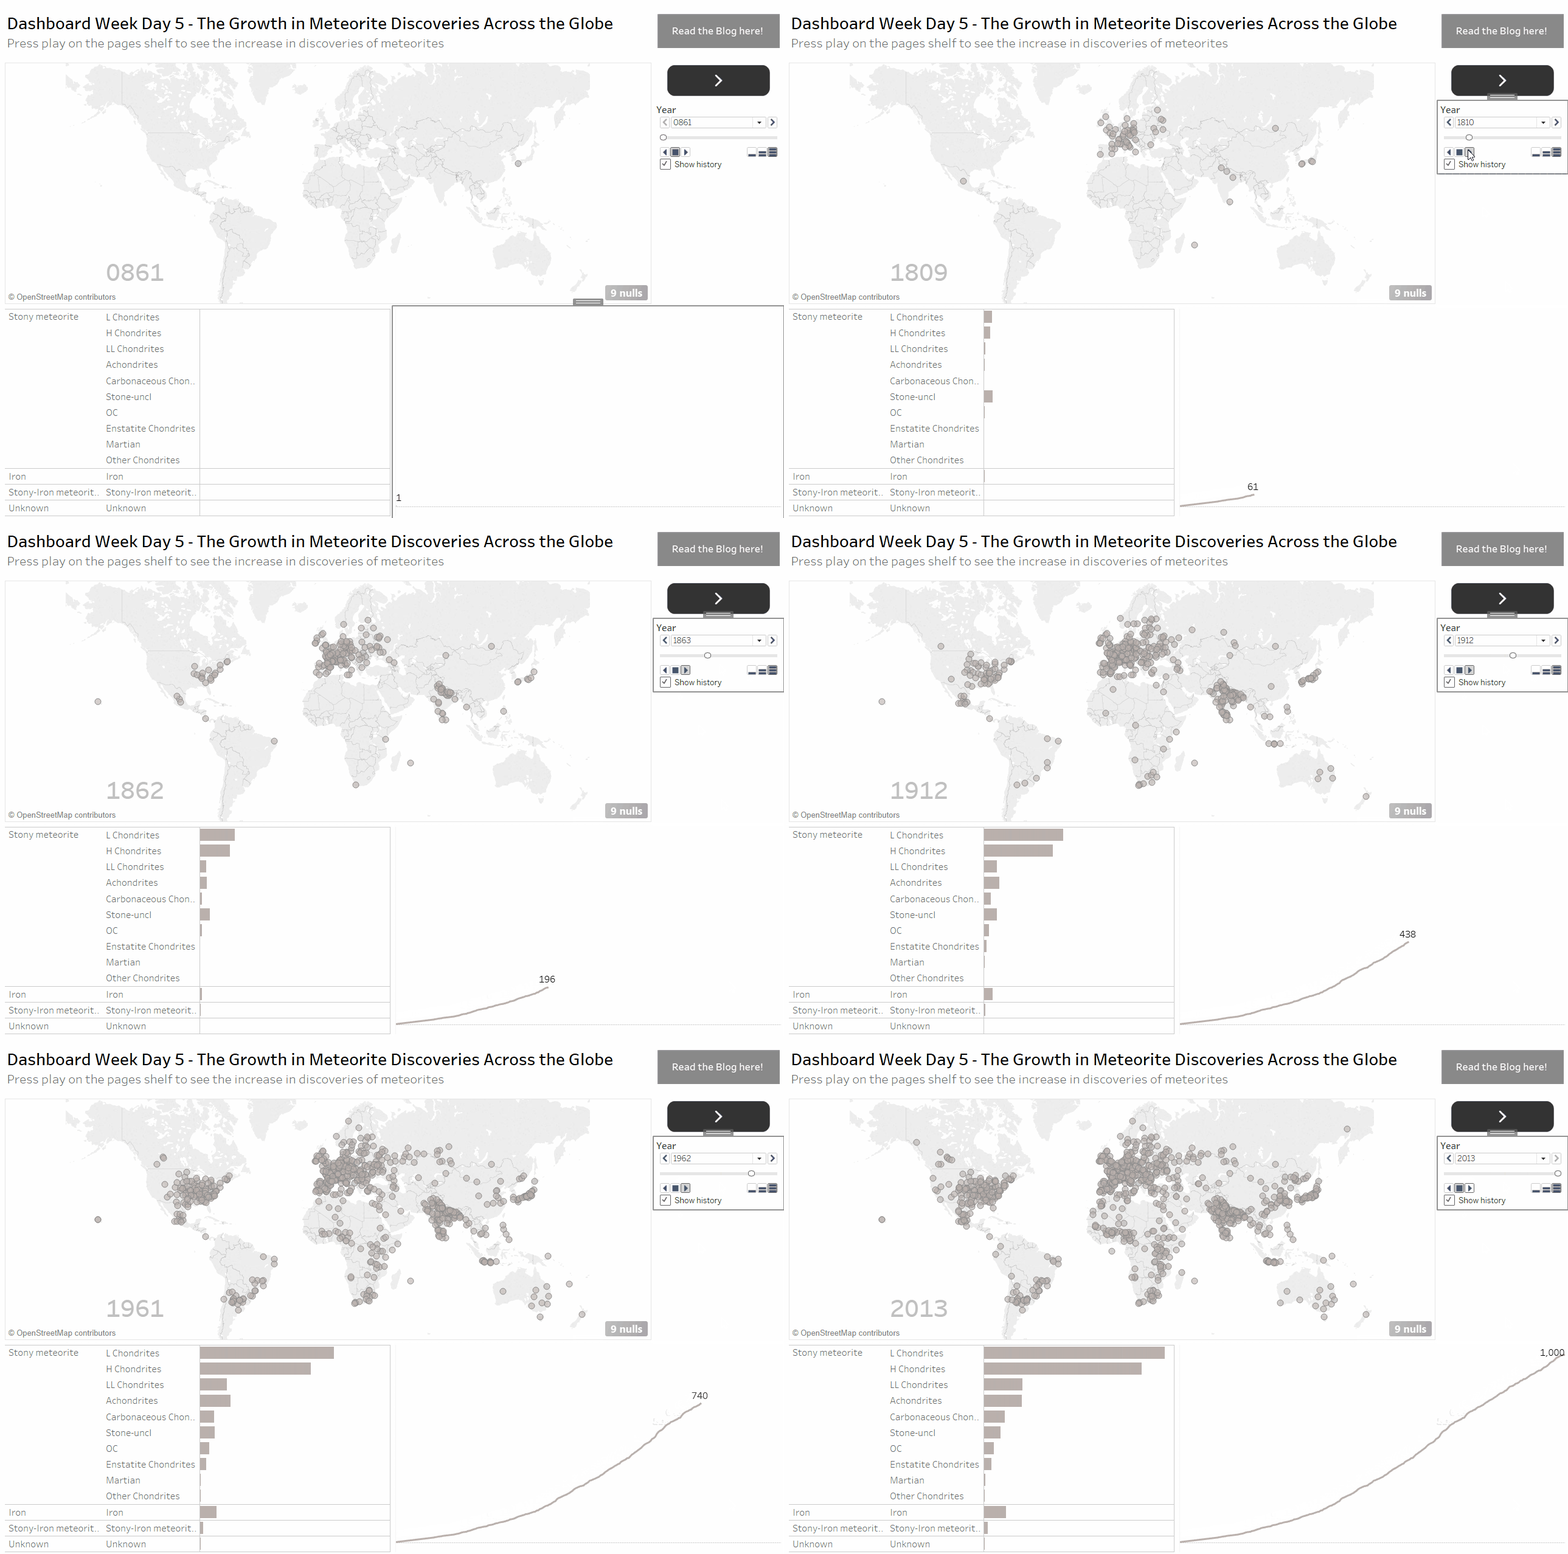
I wanted to show how meteorite impacts have changed over time so I used the pages shelf to represent the passing of time.
Next I wanted to use the new set action feature in 2018.3. For that, I allowed the user to select which type of meteorite to colour on the map.
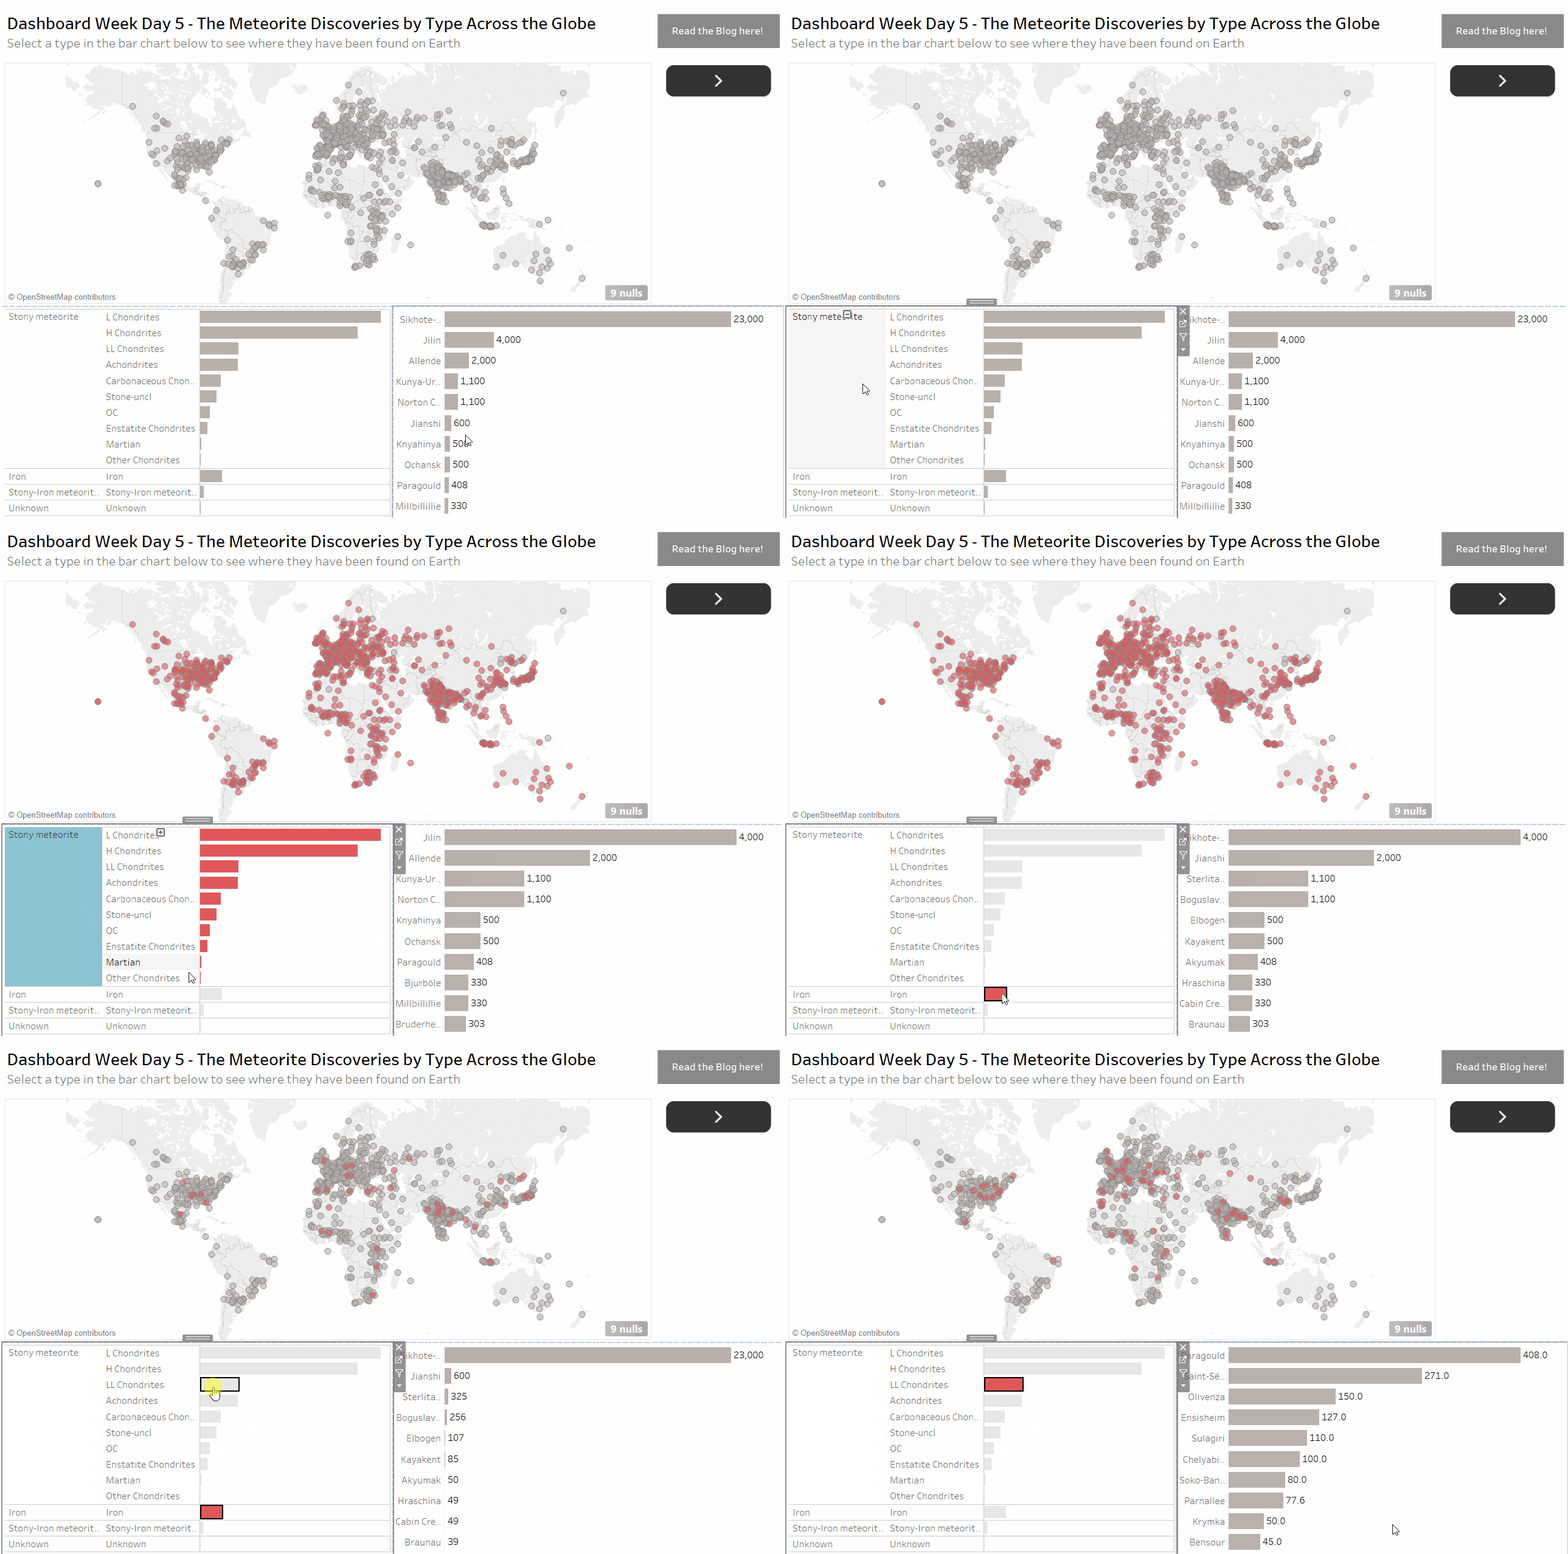
Set actions are cool!
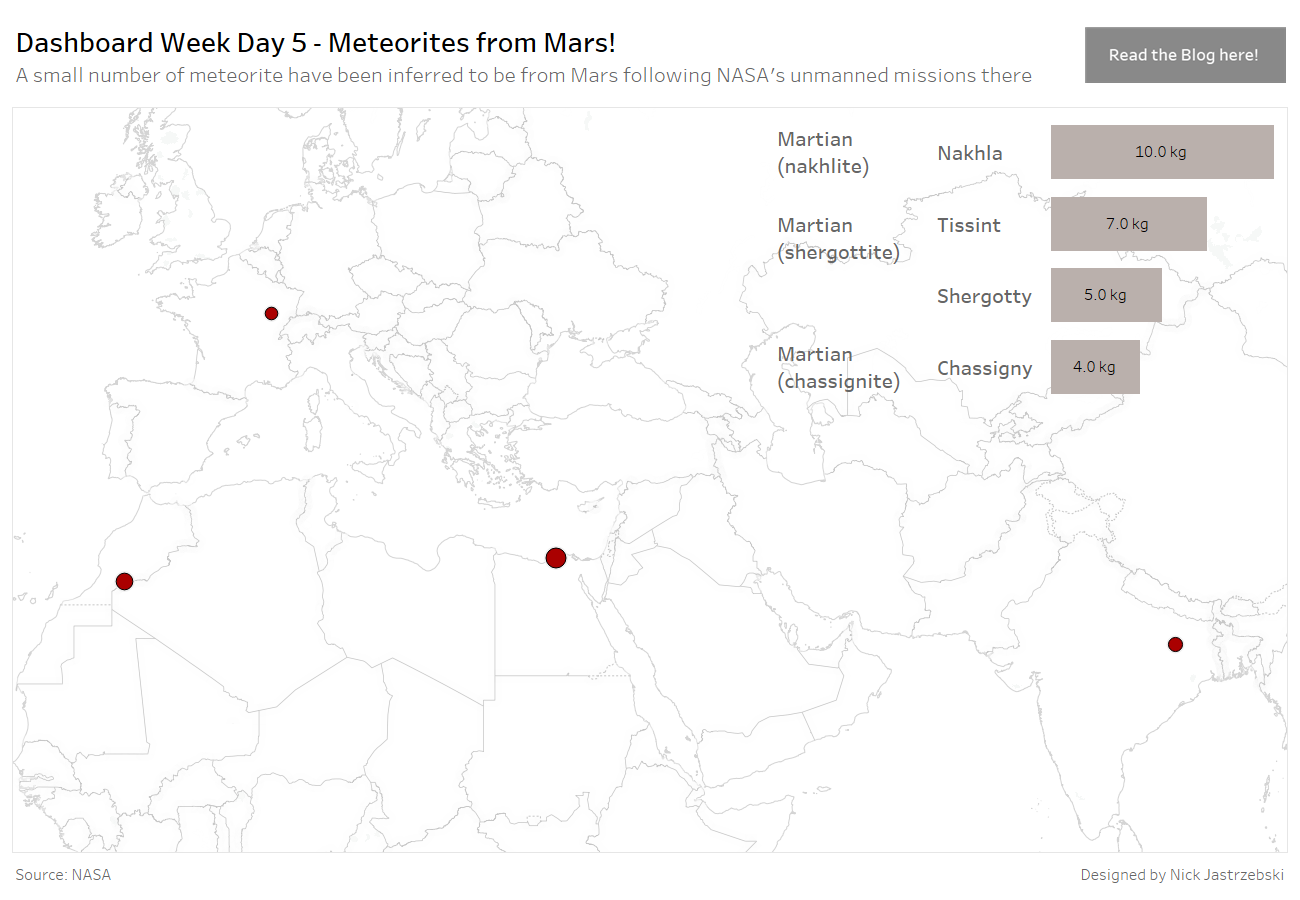
Finally, I focused on the martian meteorites in the dataset, highlighting where they were found and how much of the sample was recovered.
And there it is, the end of dashboard week! It’s been quite an adventure, though I am now looking forward to getting some rest at the weekend!
