


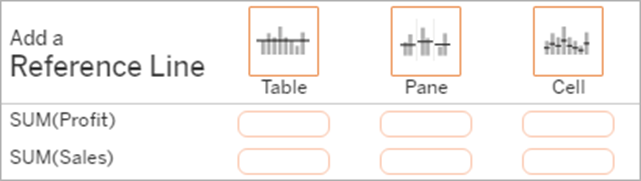
Reference lines, especially average line, are often used in analysis with Tableau. It could be easily done using Analytics Pane, where you can drag the Average Line for the whole Table, each Pane or each Cell.
This post will show you a way to approach and calculate the average line using Level of Detail expressions. This could help you further in analysis in some cases, for example, to color the bars which exceed the average value. This is not simply a step-by-step tutorial, this is a guide to help you approaching how to build the calculation. Once you understand it, you can apply to all types of visualization, not only to bar chart as demonstrated in this example.
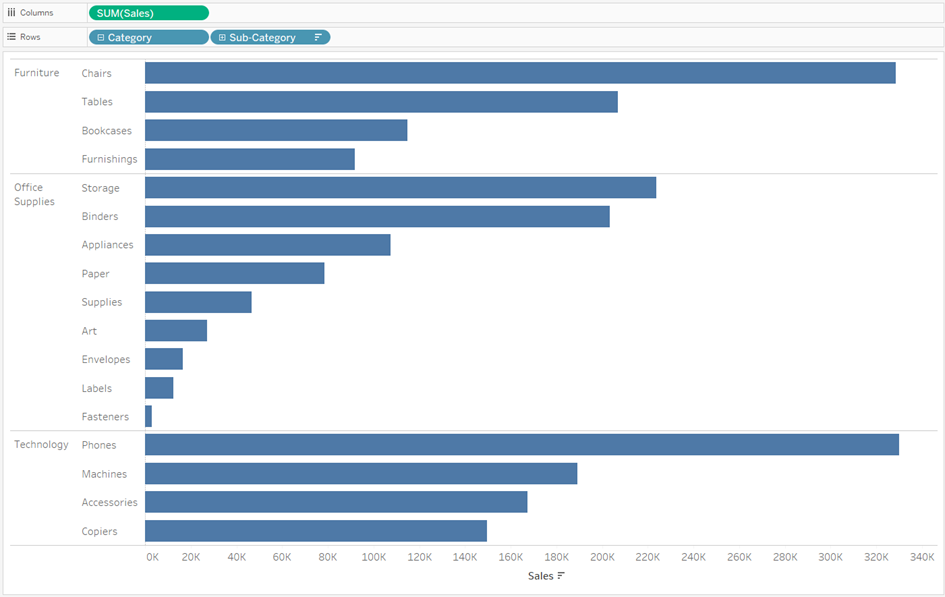
We can stay with an easy example using the Superstore dataset. On the view we have Category, Sub-Category and Sales for each Sub-Category. Now we can go step by step to see how average line is calculated.
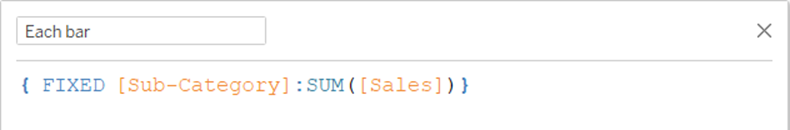
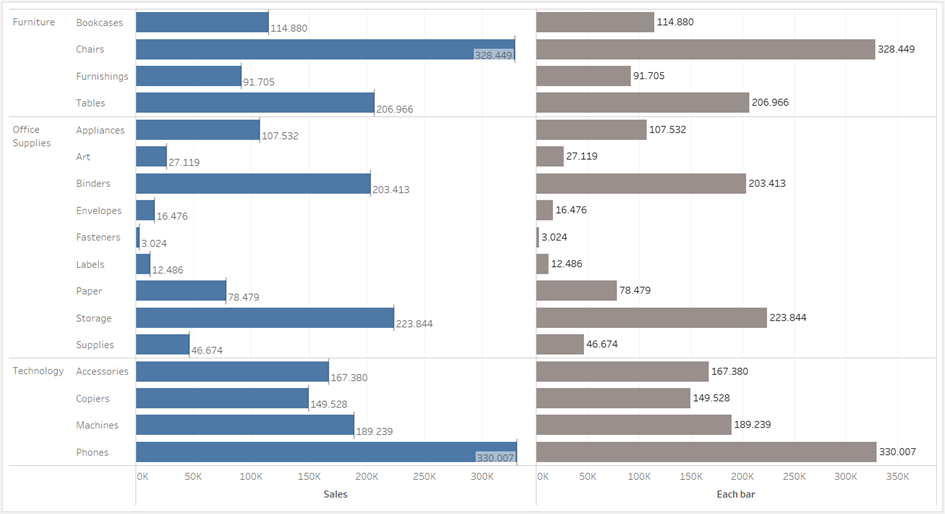
1.DEFINE THE BAR: which is each bar made of?
This is very important, because we need to know which elements we want to fix here. On my view, each bar is the Sum of Sales for each Sub-Category, so we have:
{ FIXED [Sub-Category] : SUM([Sales]) }
(Calculation 1.1. Script: for each Sub-Category, give me the SUM of Sales)
Note that will be our inner LOD for further calculation. In this case, one Sub-Category can only belong to one Category, so we can use this calculation. In the case one Sub-Category can belong to more than one Category, we should define it more precisely:
{ FIXED [Sub-Category] ,[Category] : SUM([Sales]) }
(Calculation 1.2. Script: For each Sub-Category in each Category, or in other words, for each combination of Category and Sub-Category, give me the SUM of Sales).
Now that we already have the basic elements, we can calculate the average based on that.
2.DEFINE THE AVERAGE LINE
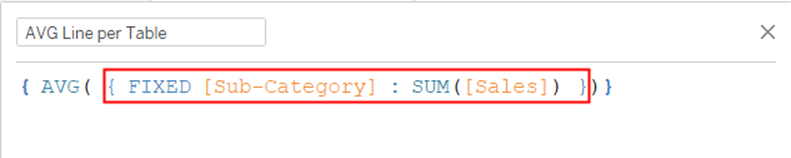
2.1.Per Table: the whole
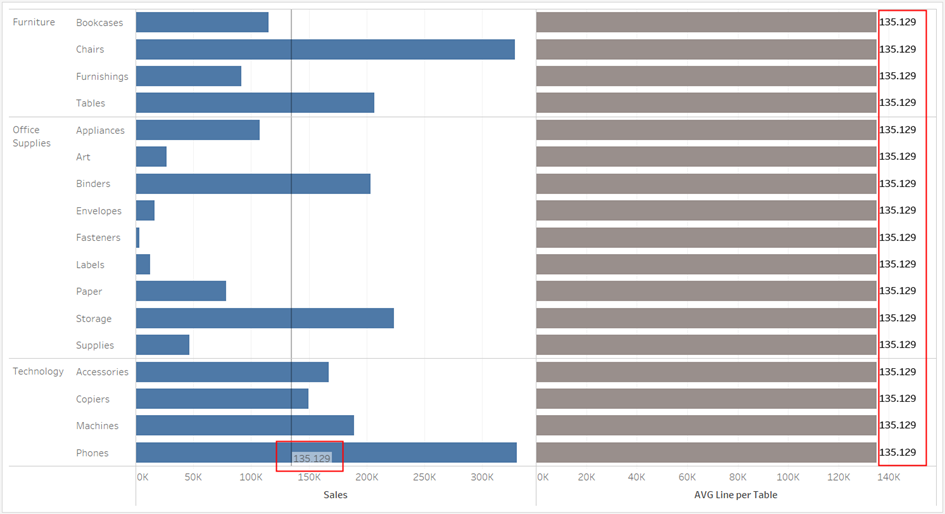
For the whole table, the average line will be calculated as the average of all the bars. For this we have this calculation:
{ AVG ( { FIXED [Sub-Category] : SUM([Sales]) } ) }
(Calculation 2.1. Script: give me the average value of all the bars. The thin Italic part (inner LOD) is our calculation 1.1 for each bar above)
Now if I put the values we calculate besides the Average Line values from Tableau to compare we have this :
2.3.Per Pane: define each pane
For calculating using LOD, for me the most important thing is to DEFINE the LEVEL. If we want the average value per pane, first we need to know what is in a pane. In this example, each pane here is one category. So we can use this calculation:
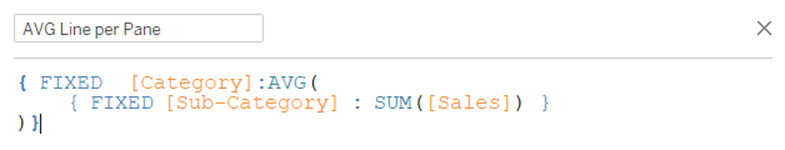
(Calculation 2.2. Script: for each category, give me the average of all the bars (the average of all category within it). The inner LOD is again just the calculation 1.1.
Now again, putting our values vs. Tableau’s values side by side so compare, we have the right numbers.
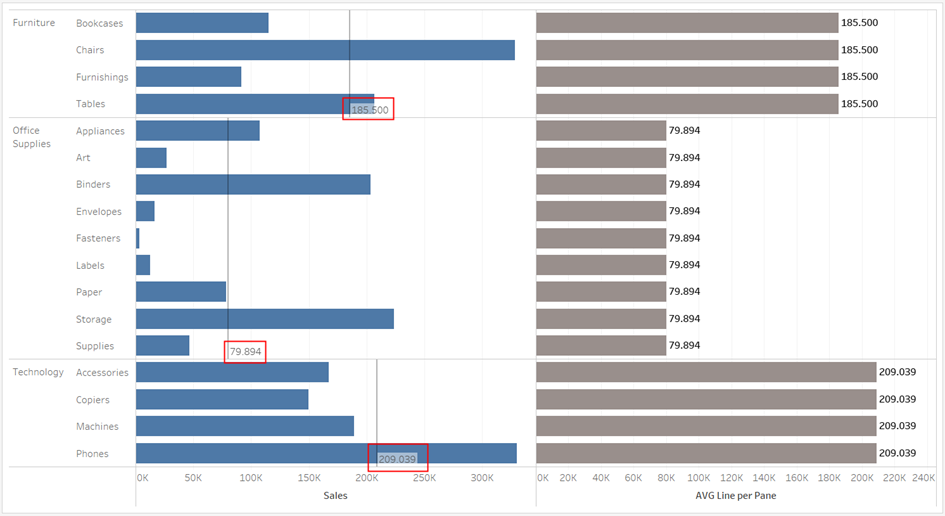
2.3.Per Cell: the bar itself
Per cell is basically for bar itself. So we do not need to do any other calculations.
To sum up, we can see two steps
1.Define the bar
2. Define the average line
As
1.Define the inner LOD (dimensions from which each element-here is each bar-is made of)
2.Define the outer LOD (in which level do we take the average of the components)
Don’t jump directly to the calculation, take a few minutes to define what is on the view; and which elements do you need to calculate what. Then the rest will become not as hard as you think!