Background:
I have a data sheet containing data on sales in different territories. Now what I want to look at is the performance in each territories over time. An effective way to do it is to see the trend in ranking through the whole period. Today I will introduce you a so-called bump chart. Let’s started.
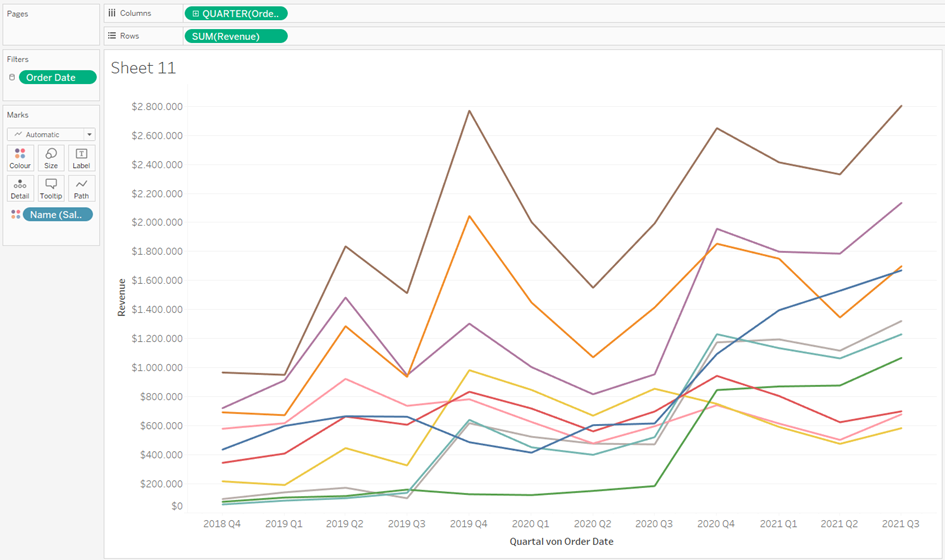
- Starting building a bump chart, we need the basic information going into their right places: sales in different territories through time. So Quarter of order date goes to columns, Revenue (or sales) goes to Rows and the names of territories are in Details (here I have them directly in colors) in the Mark Cards.
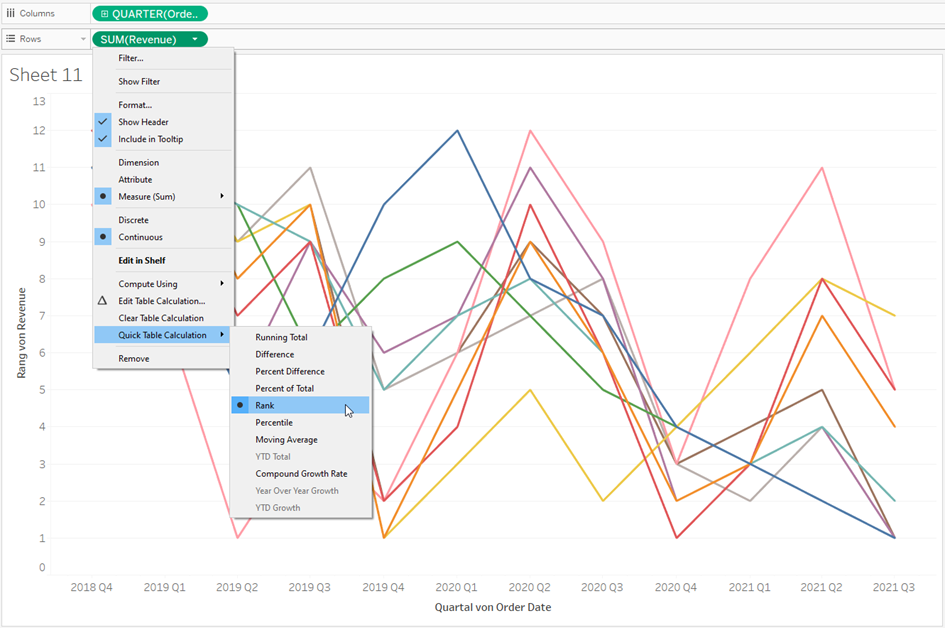
2. But what we needs is the rank. To do so, right click on the Revenue pill, choose Quick Table Calculation -> Rank. At the moment everything looks a bit messy, because we did not tell Tableau yet how we wanted to calculate the ranking.
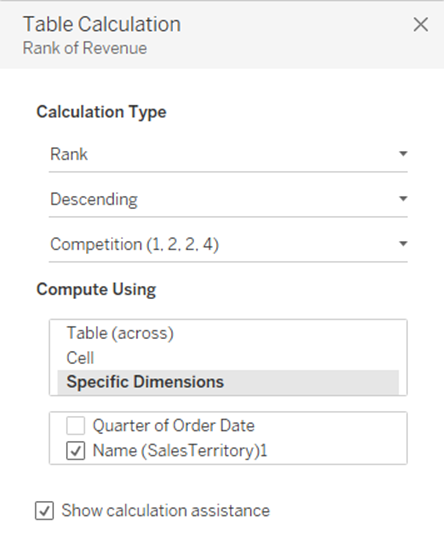
3. Right click again the Revenue Pill and pick Edit Table Calculation. In Specific Dimensions, choose only the Name of territory and untick Quarter of Order Date. This mean: In each Quarter of Order Date, rank according to the name of territories.
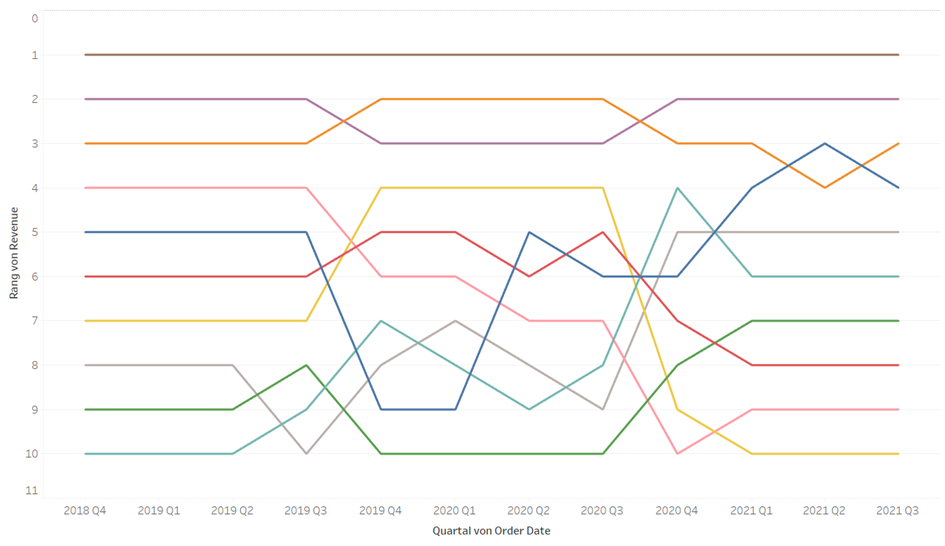
Don’t forget to reverse the scales in the Y-axis, because we want to highest rank (1-lowest number) to appear on top. Now it looks somewhat like this:
4. Now to have the rank appearing on the chart we want to duplicate the Chart (Press Ctrl while drop the Revenue Pill and drag it right besides). Make them Dual Axis and synchronize them.

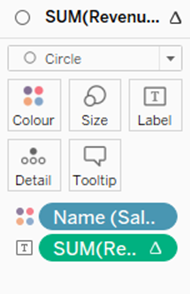
Now on the Mark Cards of the Pill on the left-hand side, change the type of chart to Circle and put the Rank from the pill on Label. Align the labels so that they appear in the middle.
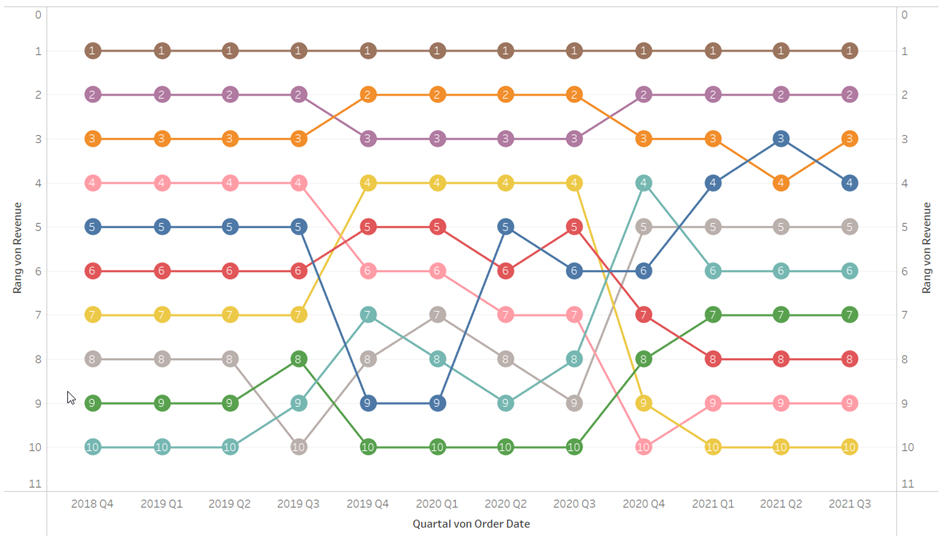
5. Our bump chart is now finished. But there are too many colors and we still need to do some cleaning.
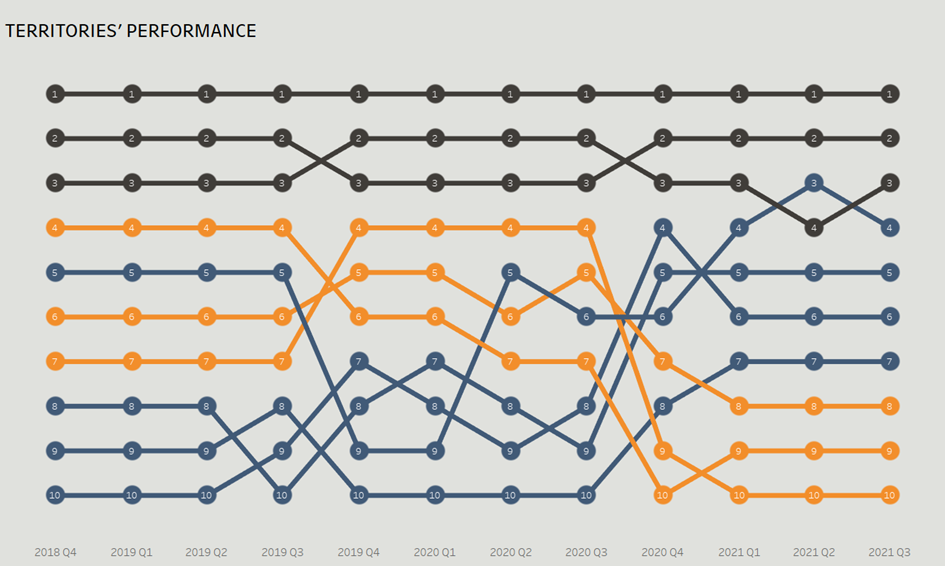
Base on the purpose of my analysis I finally did some formatting like below. I group the colors into different groups: good performing territories (dark), emerging territories whose rankings go up with the time (blue), and bad performing territories (orange).
Conclusion:
Bump chart is not usual used but in some cases they are extremely helpful, like in the example. I hope you learn something useful reading this post.
Good luck and have fun.
