A parameter always contains a single value. However, you can use parameters to consider the range between two values by letting your parameter action consider the maximum and minimum of a selected date range. We want to build a view where dragging and selecting multiple marks in the view moves the reference band to those date ranges.
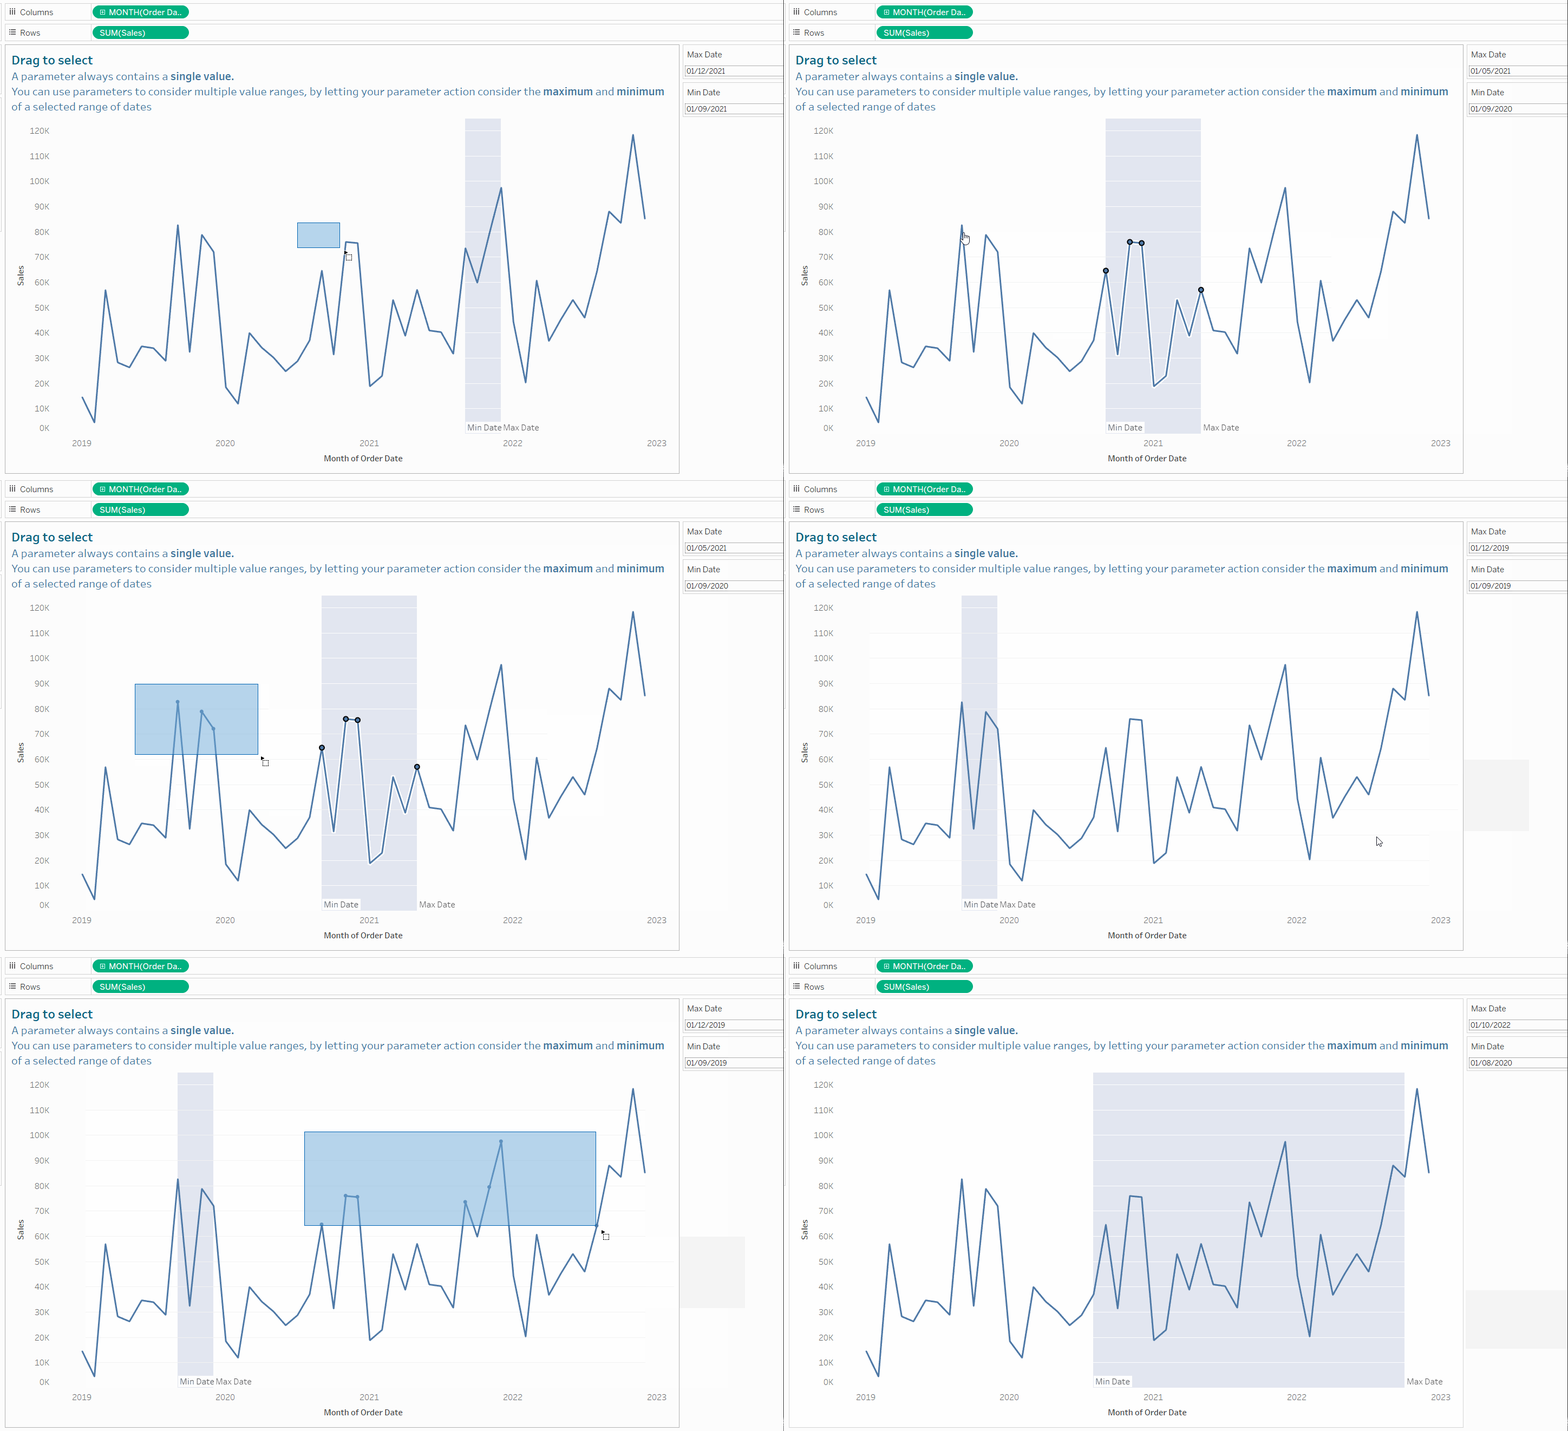
For this example, superstore stales will be used. Firstly, drag the continuous month of 'order date' onto columns and 'sales' onto rows to create a simple line chart.
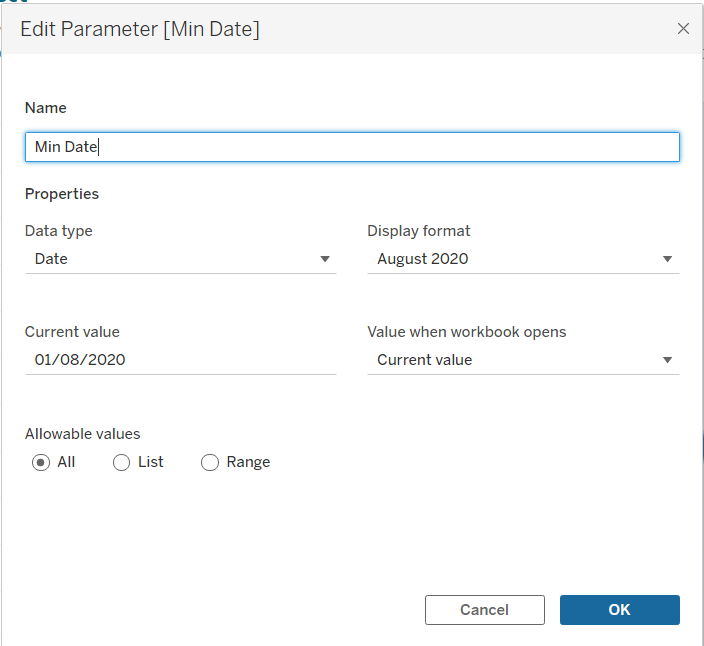
Then, create 2 parameters: one for the minimum date and one for the maximum date. The data type should be set as 'Date' and the 'Allowable Values' remains set at 'All'. They way the parameter should be configured is shown below. Once configured, show both parameters (right click the parameter and select 'show parameter'.
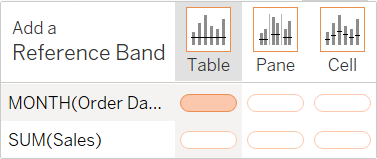
To create the reference bands, select the 'Analytics' tab and drag the reference band onto the whole table by 'month of order date'.
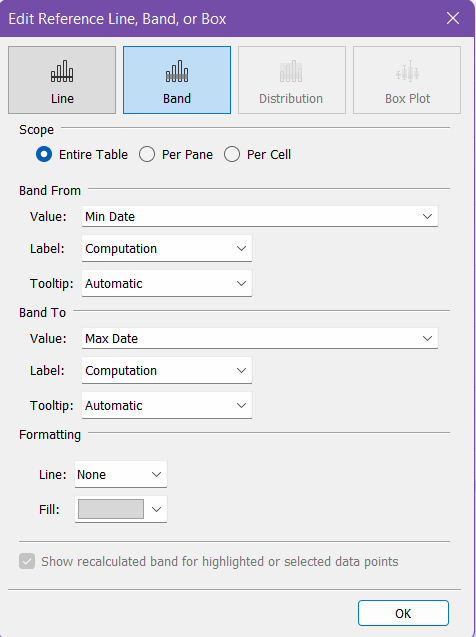
The pop-up box allows you to configure the reference band. This is where we reference the 2 parameters we made earlier so that the minimum and maximum date can be changed when you type in new dates in the parameters.
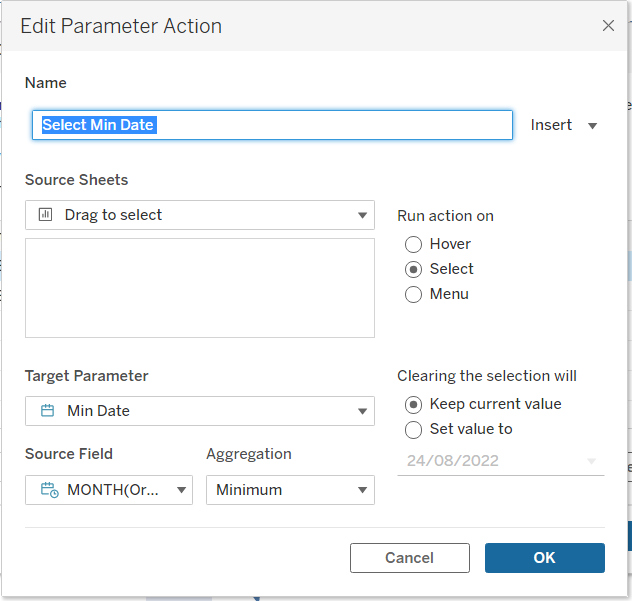
To create the option to allow the user to select a range of dates by dragging the mouse over a range of marks, we need to make a parameter action. Go to the 'Worksheet' tab and select 'Actions'. 2 actions need to be made; one each for the min and max date. The configuration is shown below.
Now the view has been completed! This allows the user to have some flexibility in what date ranges they are interested in, as well as adding a cool bit of interactivity.
