


Want to learn how to build a drilldown bar chart using parameter actions (as opposed to set actions)? Continue reading ahead!
This is the final product we are trying to build
Firstly, drag 'category' to rows and 'sales' to columns to create the base view of the chart.
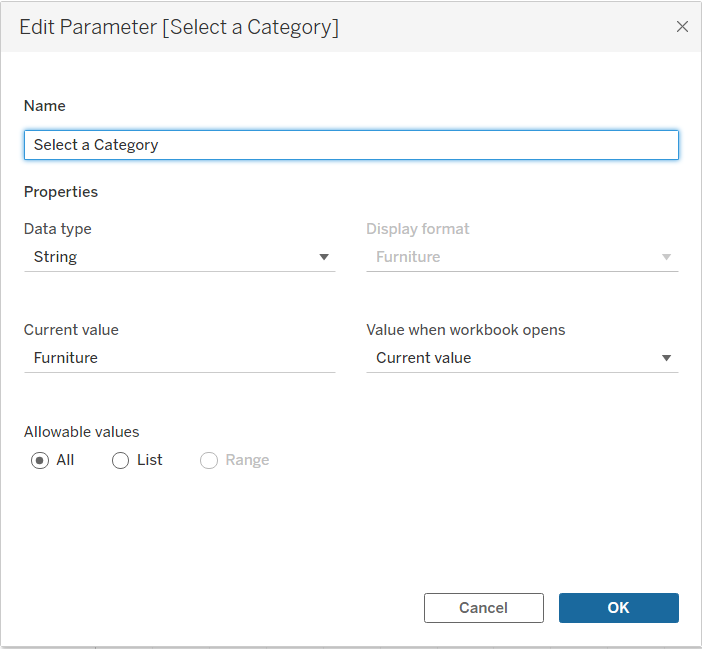
Then create a parameter that allows the user to select a category. The configuration is shown below.
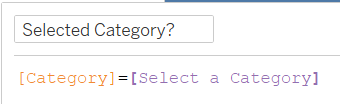
Create a calculated field that links the parameter to the chart. This will update the parameter.
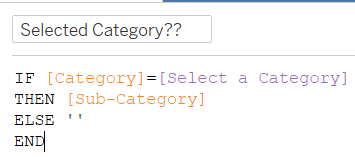
Now, create another calculated field that will allow the category to expand into the subcategory once the parameter action has been set up. The calculation below is stating that if the a category that is typed into the parameter matches the category shown in the chart, then show that category's subcategories. Drag this field next to 'category' in the rows shelf.
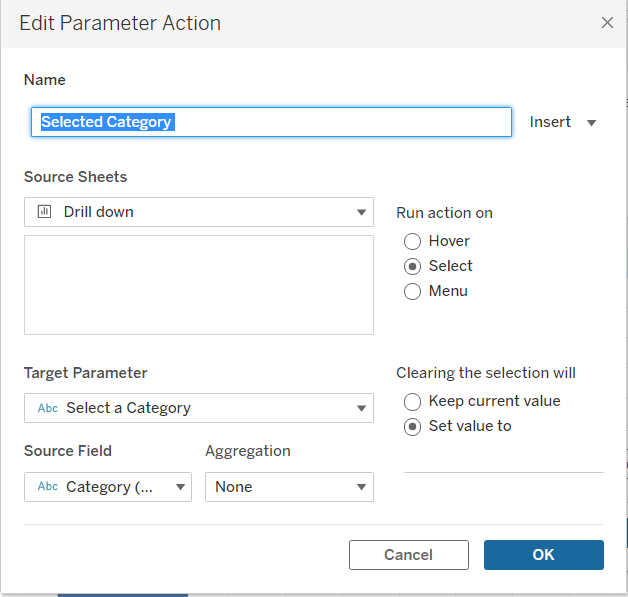
Now, to set up the parameter action. Create a new 'Change Parameter' worksheet action. The configuration is shown below. This will allow the drilldown to be 'activated' - when you select a category within the chart, it will expand. This way you do not need to type in a category in the parameter (it is there for the parameter action to reference). Setting the parameter value to 'blank' allows for the drilldown to shrink when you click on the category again (or off the chart).
Now the drilldown has been completed.