The Navy Seals call it Hell Week, Andy calls is Dashboard Week!
For this first dashboard of the gruelling dashboard week, Andy Kriebel set us the goal of building an Alteryx app to download data using the API from data.police.uk and have it automatically render a Tableau dashboard! Ouch, this is going to be hard to complete in the time allotted.
Here are the steps I went through to achieve the end result:
Alteryx workflow
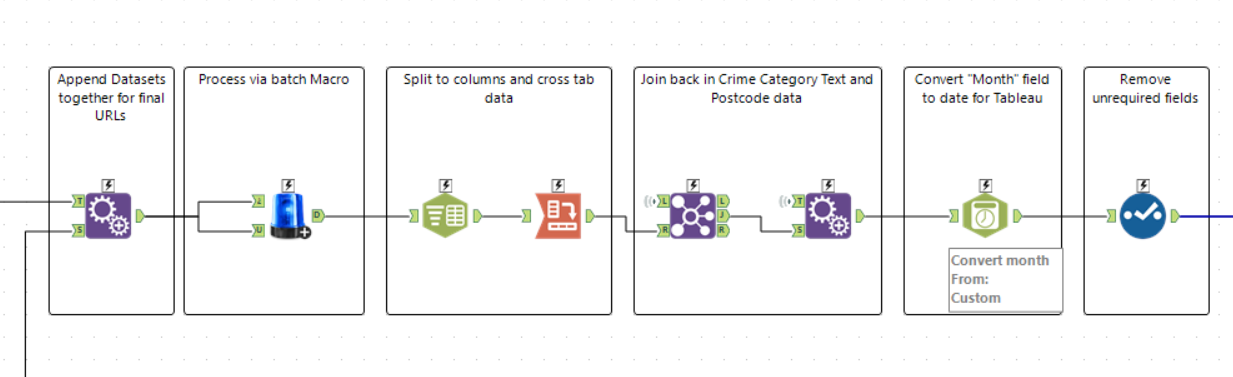
I first set up a basic workflow to call the API, I avoided doing much processing of the data in this macro because I was unsure of what I would need later on so I left it nice and simple, I was also able to quickly test the API with simple parameter changes to make sure it was returning the results I was after:
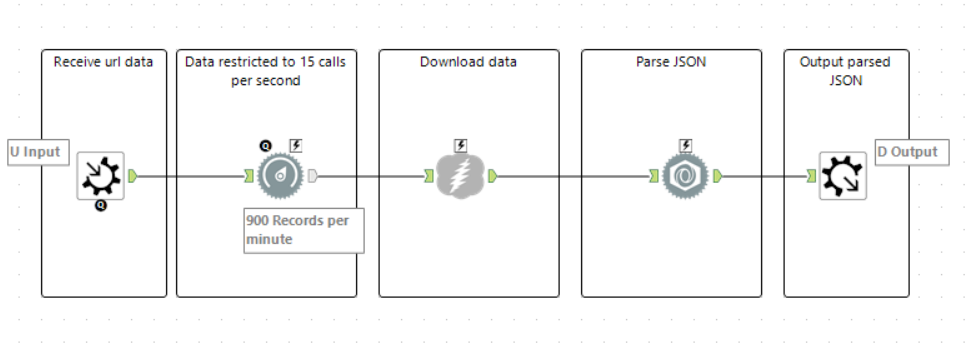
Note that I used the “Throttle” tool here, the API has usage restriction of 15 calls per second, I was confident that I would not get anywhere near that number of calls but I thought I’d add it to prevent any errors later on.
Thinking ahead, I knew this would need to be a batch macro and so I set the workflow up to accommodate this.
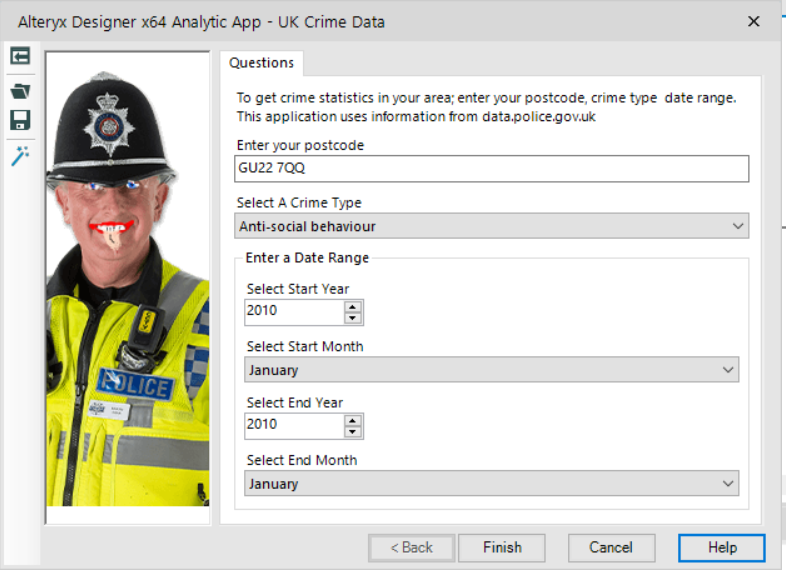
Next step was to build out the workflow with the user controls; I used a Text Box so the user can enter their postcode (this gets joined later on to a file containing the Latitude & Longitude for every UK postcode), I used a simple dropdown listing all of the Crime Types available (this was also an API call from data.police.uk which I outputted to a browse tool and then copied into a text input) and lastly a date range select, for this rather than use a date range picker I opted to have the user enter the start month/start year and the end month/end year:
The first 2 user inputs (postcode and crime type) are pretty standard but the date range inputs were quite challenging. I started by creating the user inputs and have the write a text input with the entries. The next step was to turn those user entries (which are just strings at the moment) into actual dates, a formula tool did the job perfectly:
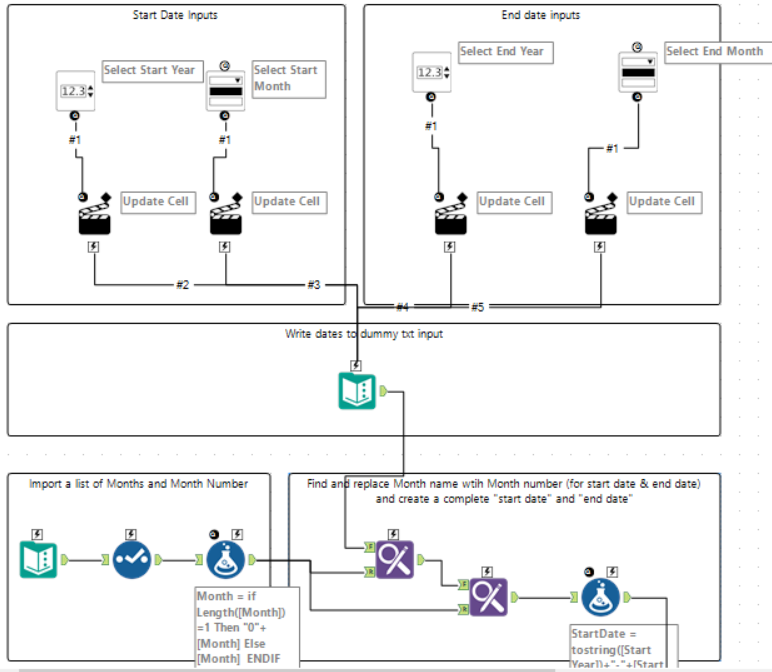
But what about the dates in between? This is supposed to be a range but at the moment I only have a start date and an end date. Luckily for me, I was paying attention when Paul Houghton was giving an Alteryx class a few ago, in the session in showed the TS Filler tool (Time Series Tool) perfect:
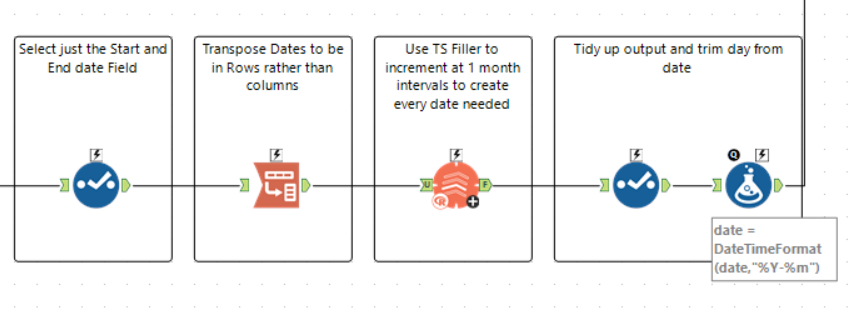
Then final part is to stick all of the data together to form a final set of URLs to feed the batch macro and perform the usual data prep activities when dealing with JSON:
But wait, there’s more!
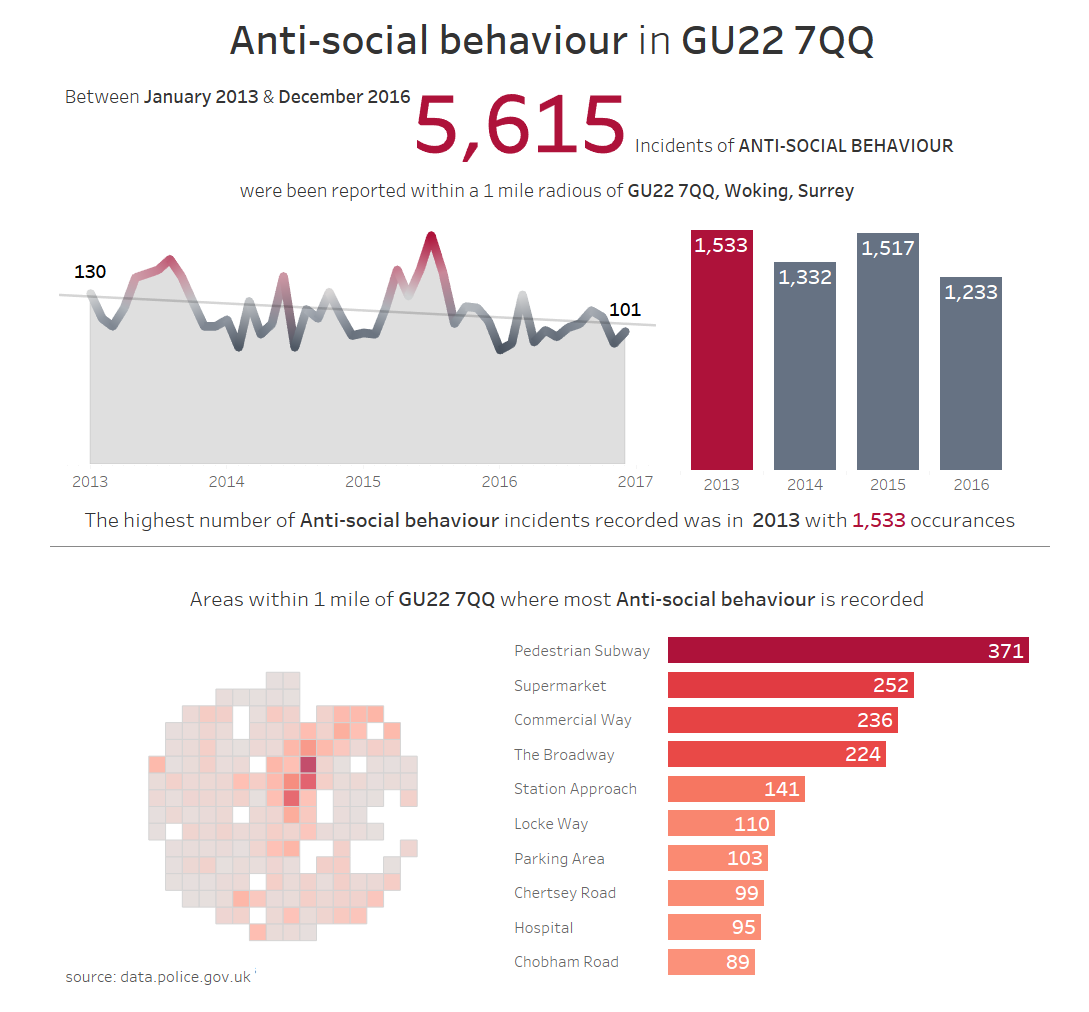
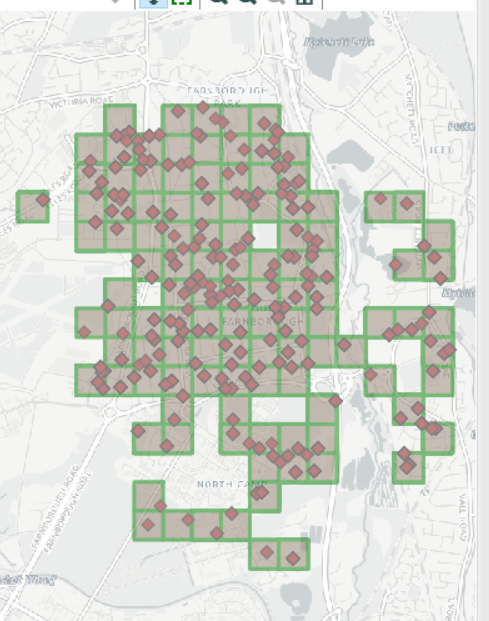
Whilst out looking for dashboard inspiration I came across a viz that was a waffle style map:

I quite like this so I had a go at using Alteryx to generate this automatically for me (why do hard work when Alteryx can do it for you?). Using the centroid of the user entered postcode, I created a 1 mile trade area (the API returns crime with a 1 mile radius of the postcode entered) and then I used the Make Grid tool to carve this up into 20 meter squares. Then all I needed to do was match each recorded incident to a square:
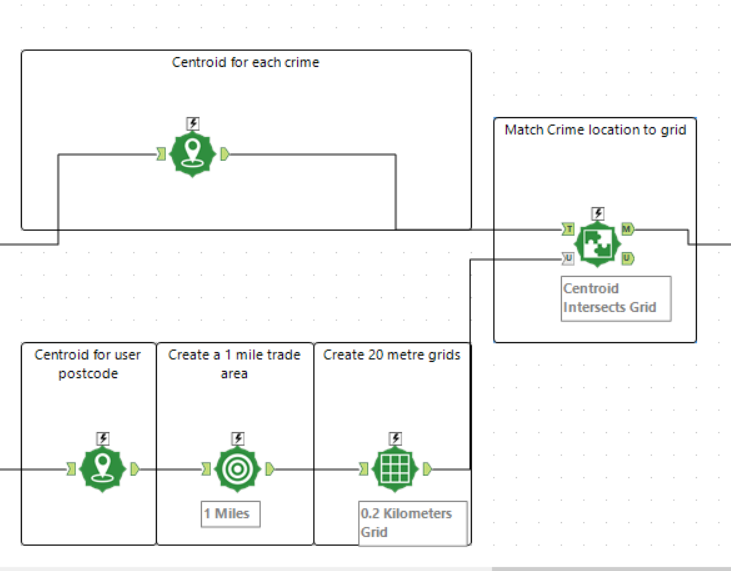
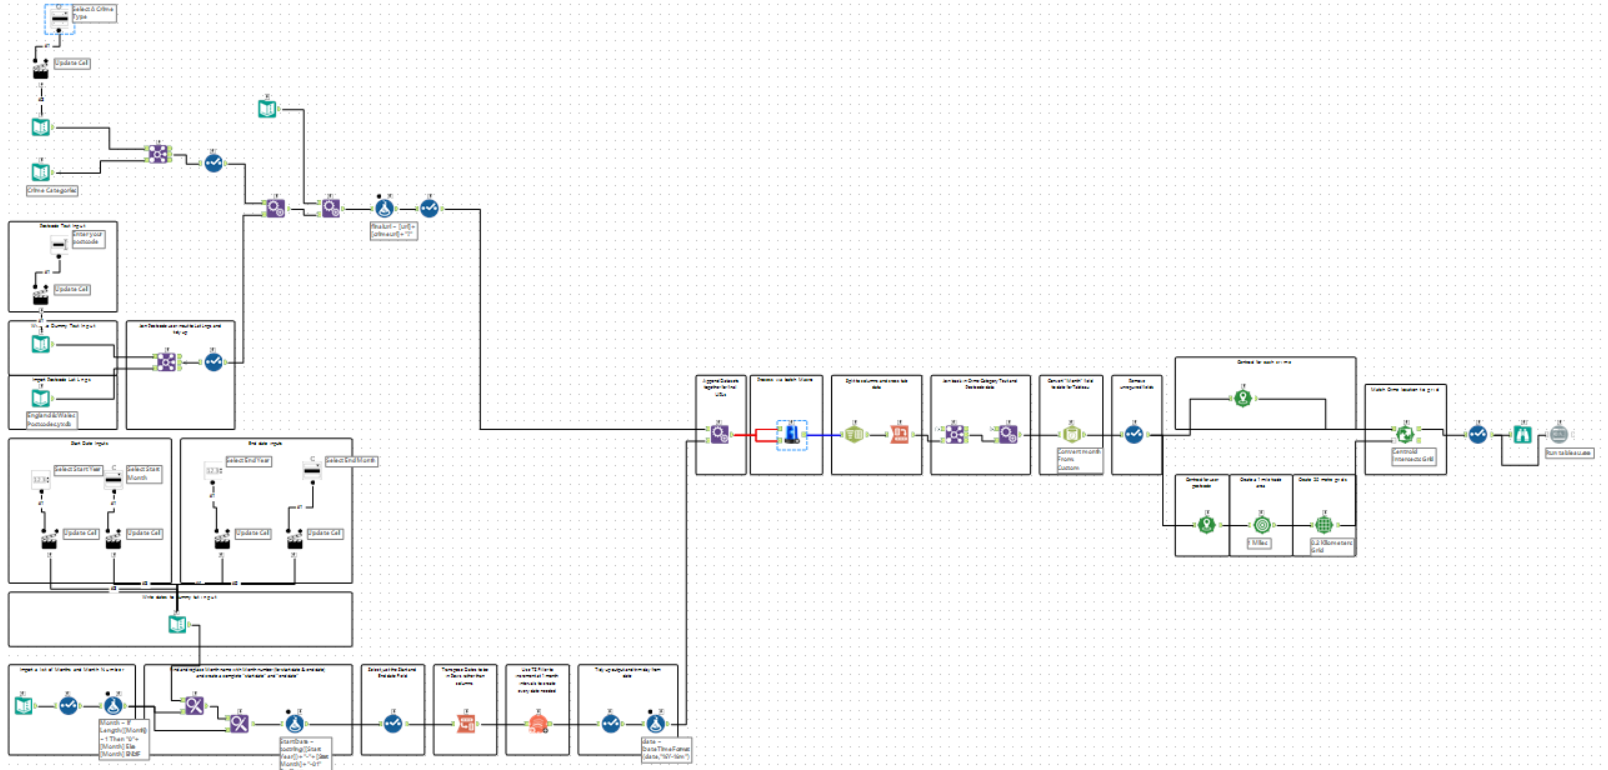
And this is what the final workflow looks like:
And this is the final result: