When Highlighting the maximum and minimum of a line graph we will need to make a nested calculate function.
The first function we need to work out the sum of the value for each part of your line graph. In my line graph I have the sum of sales for each quarter and Category, so i need to work out the sum of sales at each quarter.
To do this I will Use the function
CALCULATE (SUM([SALES]), ALLEXCEPT([Category], [Order Date].[Year], [Order Date].[Quarter]))
This will Find the sales for each quarter, now we want to find the maximum of that value for each category so we will wrap that in a MAXX Function with an all except Category because we want the max for each category.
So Our Maximum sales looks like the following
Max Sales = CALCULATE(MAXX(Orders,CALCULATE(SUM(Orders[Sales]) ,ALLEXCEPT(Orders,Orders[Category],Orders[Order Date].[Year], Orders[Order Date].[Quarter]))),ALLEXCEPT(Orders,Orders[Category]))
This will give us the maximum order date, Now do the same with the minimum order date using a MINX function.
Finally we need to make an IF statment that says
IF(SUM([Sales]) = [Max Sales], Sum([Sales]))
To get our points on the graph
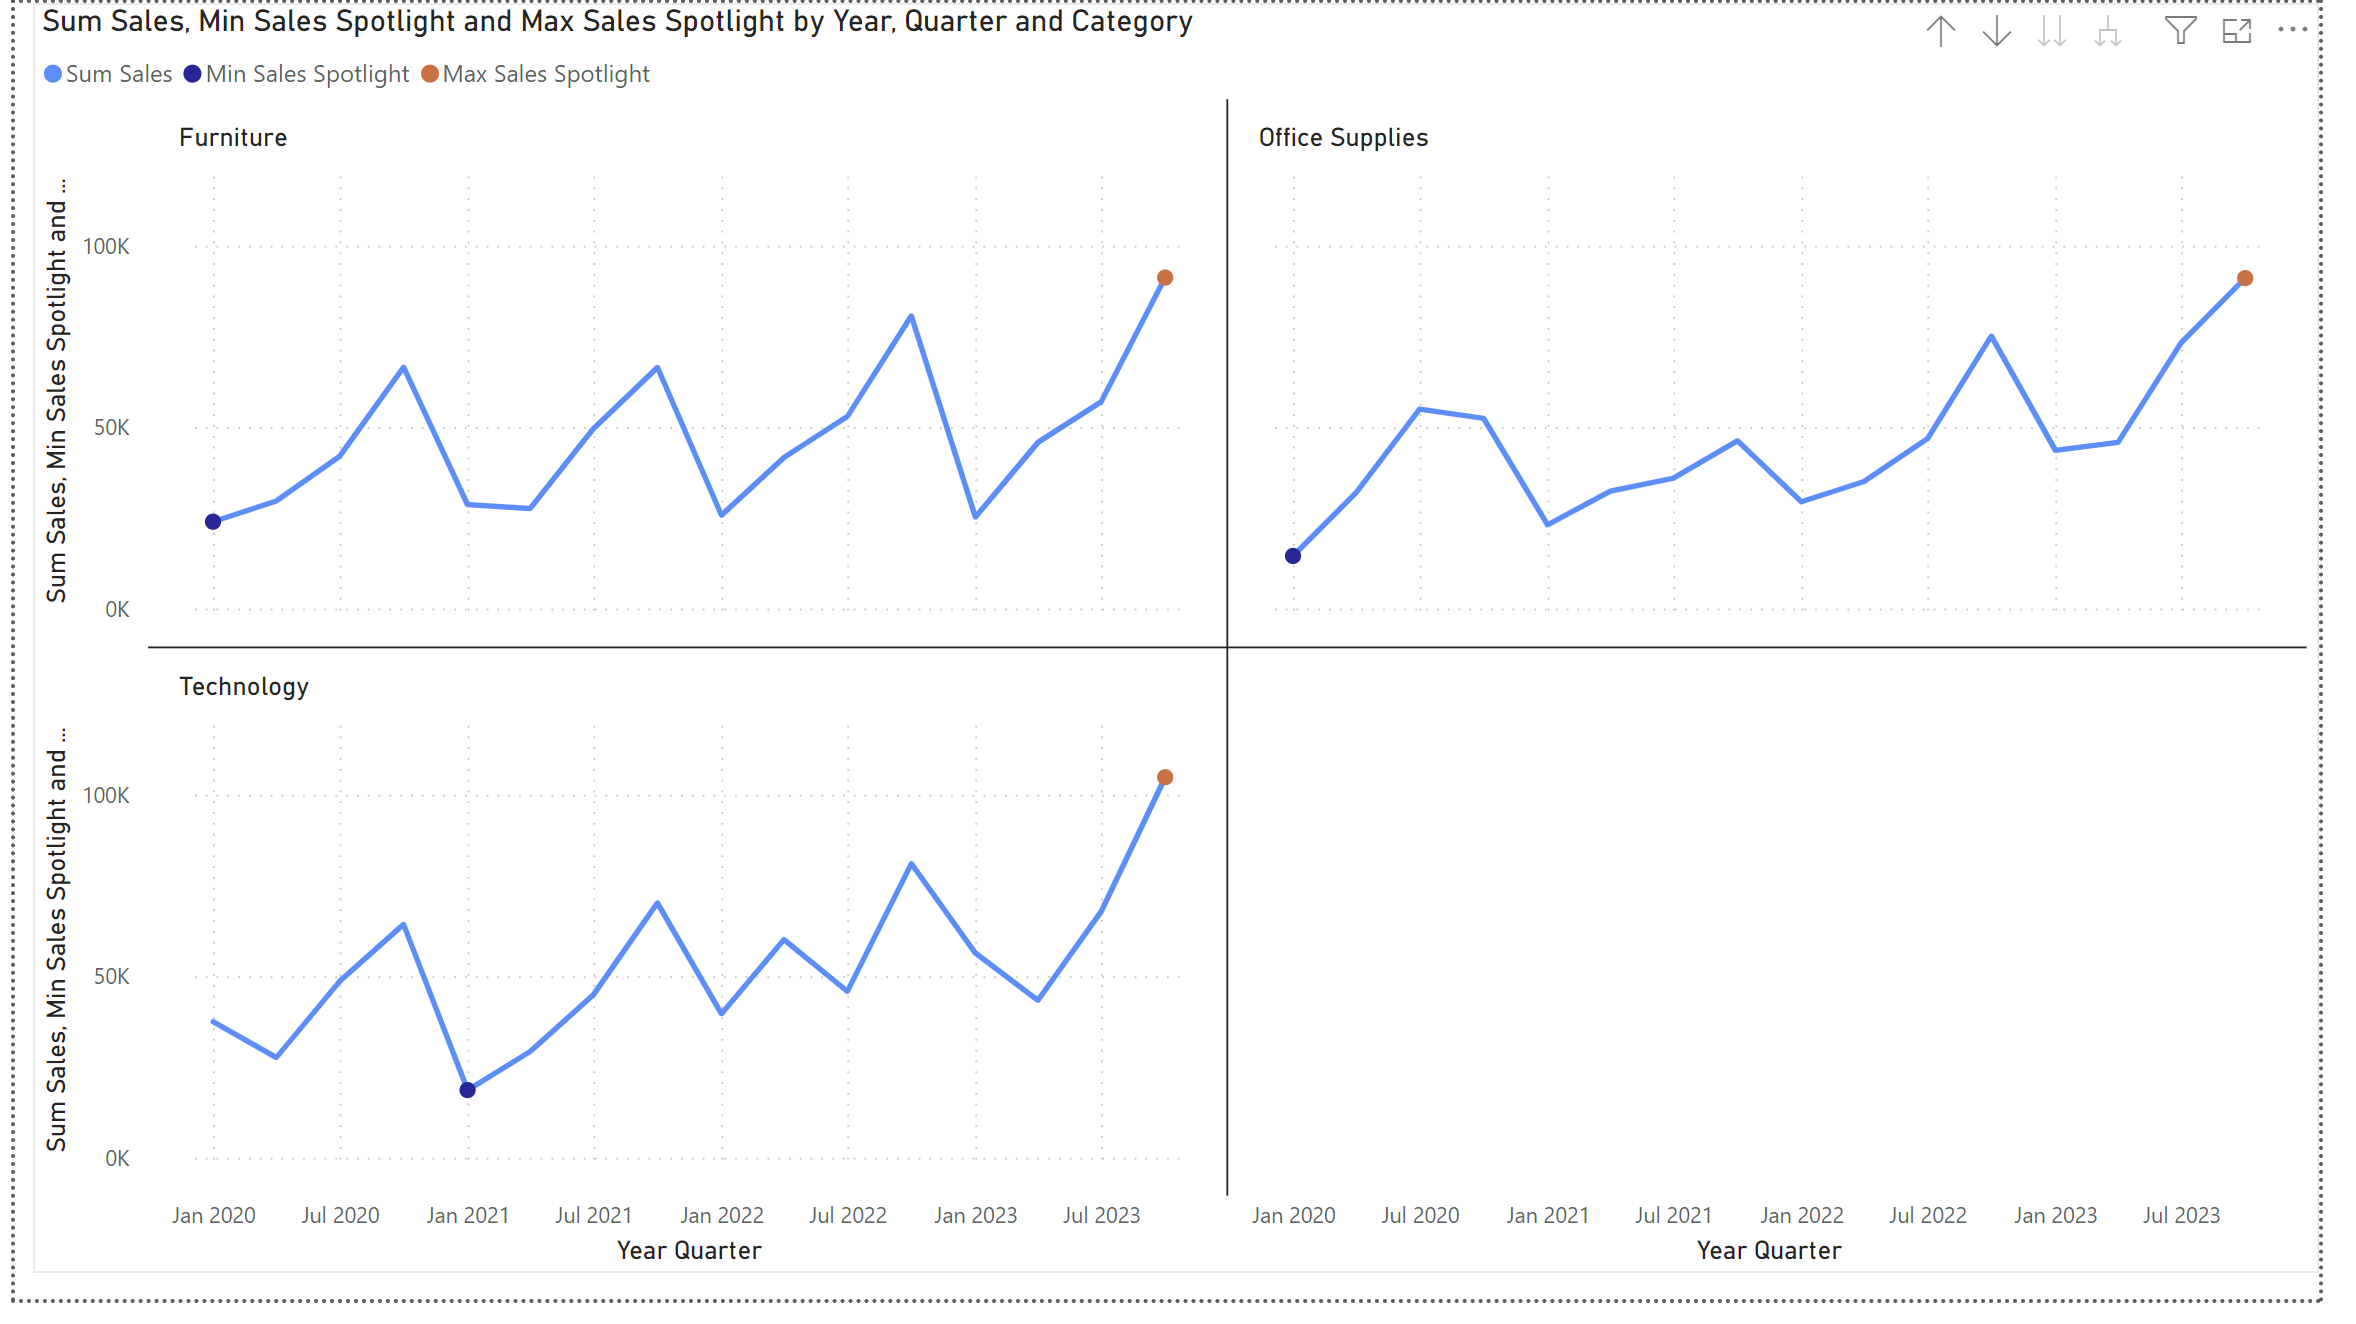
And the final graph should look something like this