


Streamlining Filters in Power BI with a Parameter-Based Approach
Lets say you have a customer table, with several flags against each customer - whether they have debt towards your company, whether they've ever purchased yoghurt, or if they have blue eyes.
These flags are a great way to filter your data, and you could build each of these flags into their own individual slicer. However, to streamline this, and prevent potentially cluttering your dashboard, you could decide to bring these individual slicers together into a single parameter based calculation.
How to:
Step 1: Creating a Parameter:
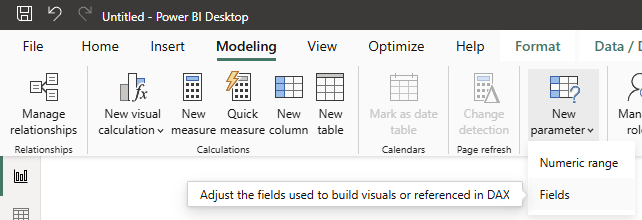
In the toolbar, open the 'Modelling' tab, select "New Parameter", and then "Fields". This will open the parameter creation wizard.
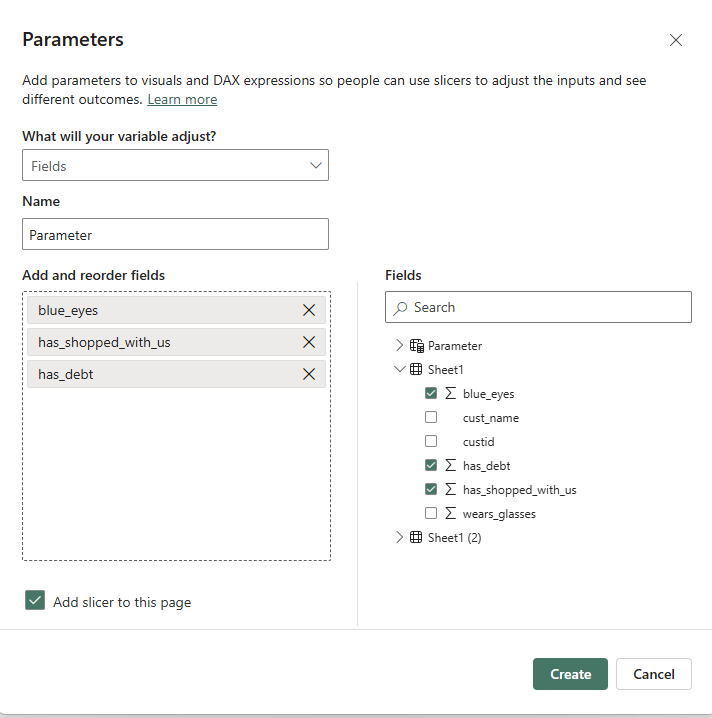
Select the options that you'd like to be available in your parameter:
This will create a slicer-type visual on your dashboard that will allow for a single option selection to populate the parameter. The output of this parameter is a literal string of the column name:
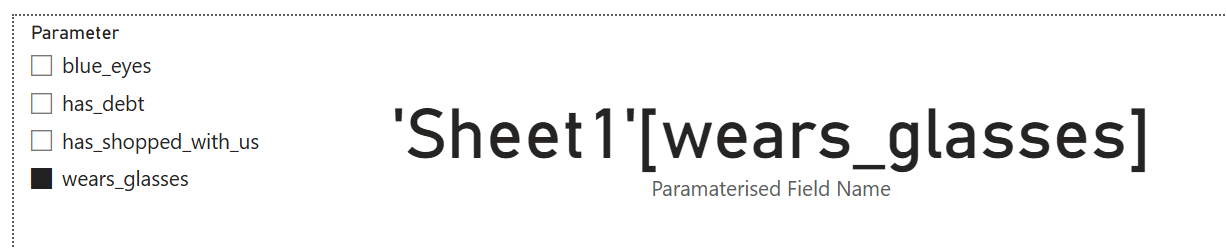
This literal output can be used to write a new measure to calculate the values in your column.
Step 2: Creating the Measure
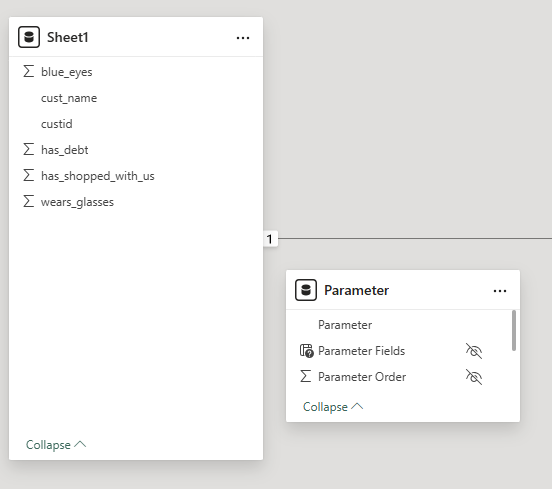
Once the parameter has been created, the calculation can be written to extract the selected column values. As you can see in the extract of the data model below, there is no relationship between our new parameter table, and our customer information table. Therefore, we will need to create this relationship in our new measure.
This is done within the created variable (VAR) 'selected_value'. Creating a variable here allows us to use a condensed reference 'selected_value' instead of re-writing the full calculation each time.
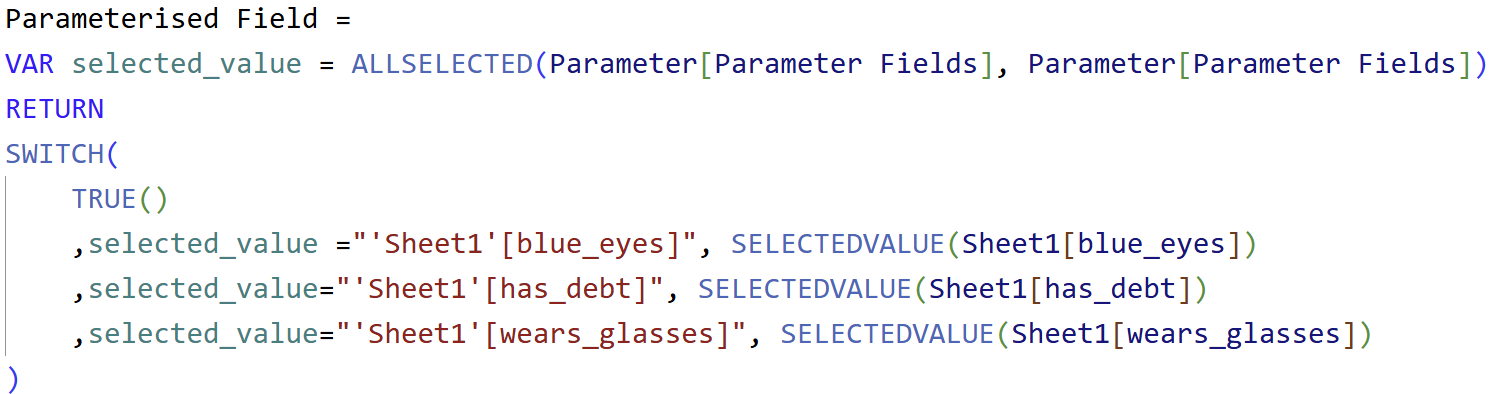
We then utilise a SWITCH calculation - similar to a CASE statement in SQL or Tableau, or a nested IF/ELSEIF calculation - The SWITCH calculation checks if the statement selected_value = "Column Name", and returns the following clause.
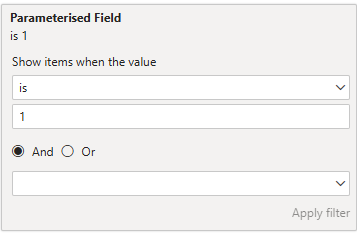
In this case, we check the literal output of the parameter, if that parameter matches the column header name, then we return the values related to the column header. This can now be used to filter your data by applying this new measure to your visualization, with a value that is equal to 1. This filter works across related fields too.
Limitations
This approach is limited, however, as PowerBI prevents measures from being used as page filters, thus, the filter needs to be applied to each affected sheet individually.