


Tableau offers several ways to reorder bar charts, this blog will explore the use of sets to allow the end user to reorder a bar chart by clicking on a measure, you can observe this set action in the below Tableau dashboard:

1. Building the View
2. Creating the Set
3. Creating the Actionable Measure with a Calculated Field
4. Creating the Sort
5. Creating the Set Action
6. Adjusting the highlighting (Optional)
1. Building the View
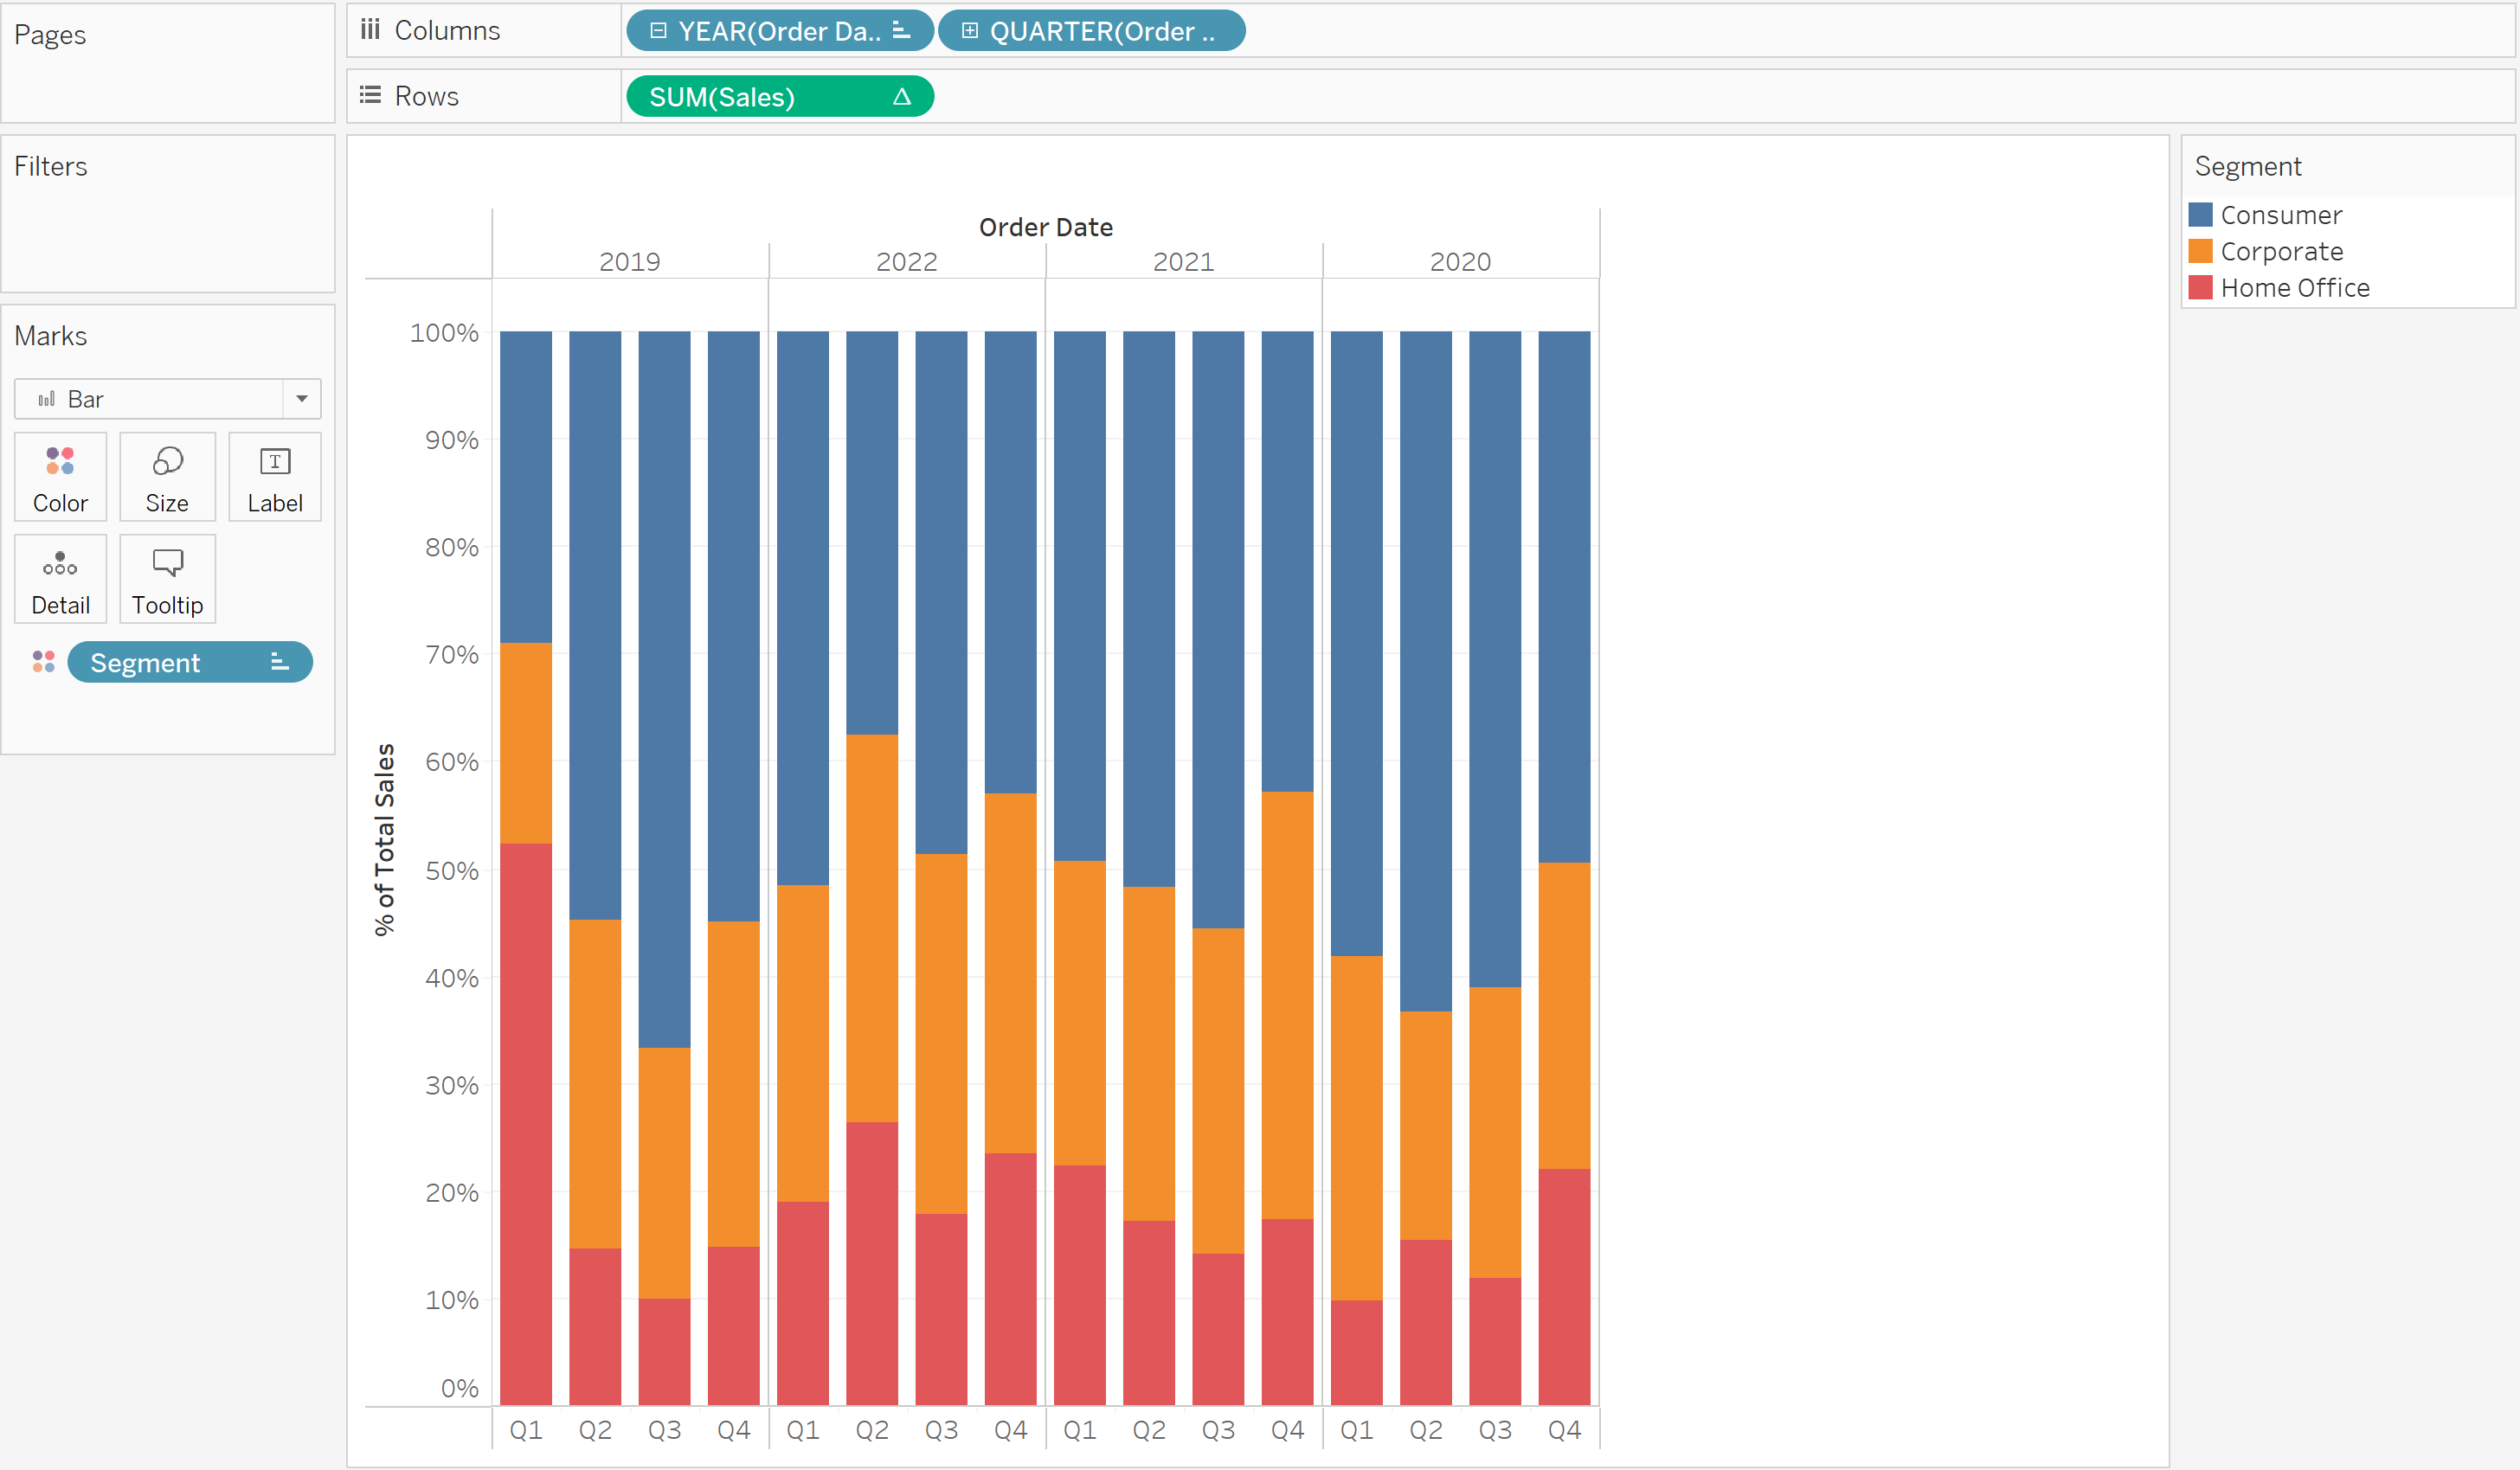
To build this view, we have used the Superstore Sample data set, with the "Segment" variable on the colours marks card, utilising the discrete hierarchy time-value data, date parts "Years" and "Quarters" in our columns, and the Percent of Total Sales (Sum(Sales)) in our row.
The Percent of Total Sales is calculated using "SUM([Sales]) / TOTAL(SUM([Sales]))" and is calculated on the Segment dimension.
This Presents us with the following view:
Now that we have created the initial view, we can begin creating the set that will allow the user to sort the order of the Segments within the chart.
2. Creating the Set
Within the data pane, locate the "Segment" measure. Right-click on this measure, navigate to the "Create" drop-down, and select "Set..." as pictured below:
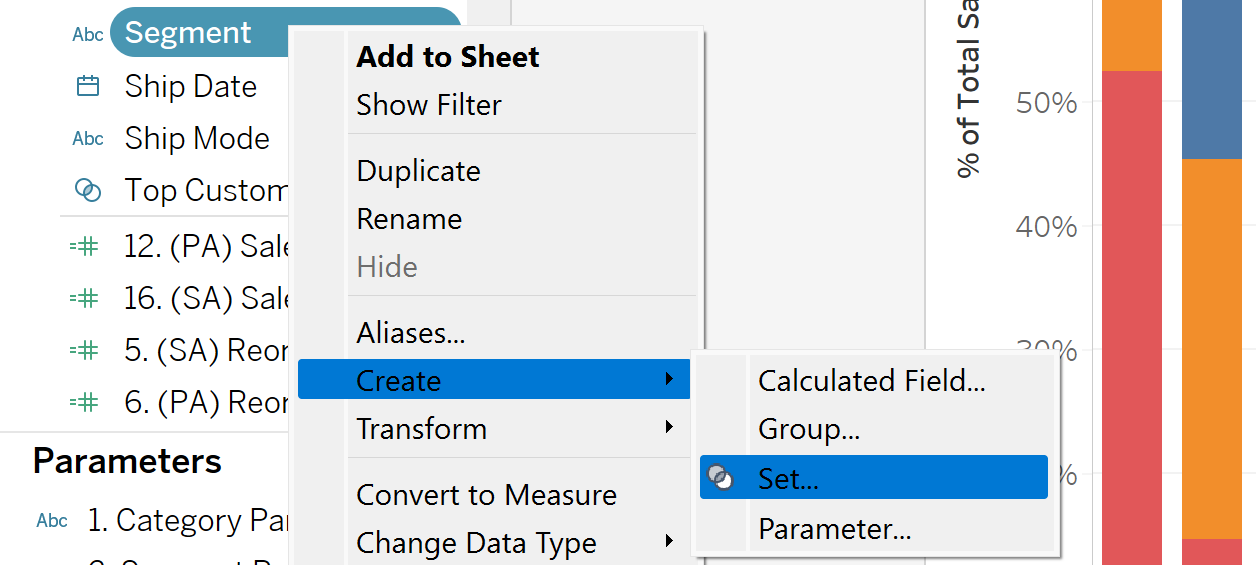
This will open a Set window. Name the set something memorable (such as "Segment Set"), as we will have to reference this set in the next step, and select "Ok" at the base of the window.
3. Creating an Actionable Measure with Calculated Fields
Now that we have generated our "Segment Set" dimension, to utilise this within our sorting, we will have to create a calculated field. To do so, at the top of the Data Pane click on the dropdown arrow to the right of the search section. Select the first option of "Create a Calculated Field...".

This will open a Calculated Field window. Again, name this newly created field something memorable such as "Reorder Segments". You will then need to enter the following information to create the calculated field:
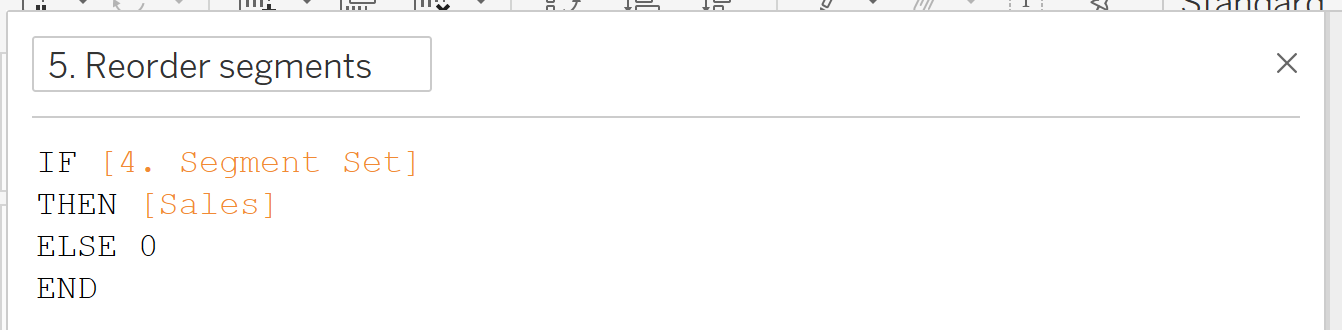
This information confers that any segment selected (and thus part of the segment set) returns the Sales value. For any other segments, return the value of zero.
4. Creating the Sort
We now have all of the elements required to create our sorting argument - utilising the Segment dimension on the colour marks card. Right-click on the blue Segment pill within the marks card, and navigate down to the "Sort" option.
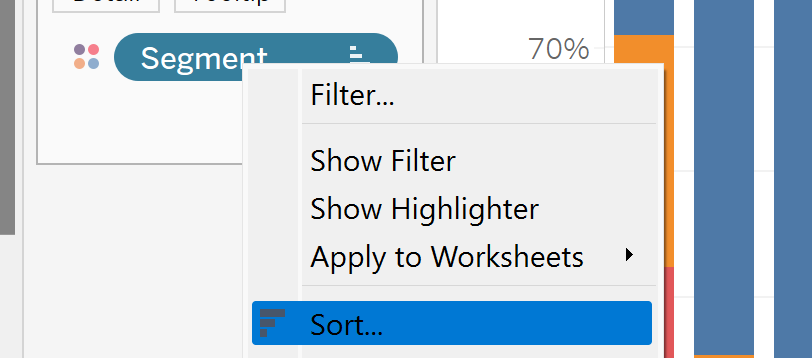
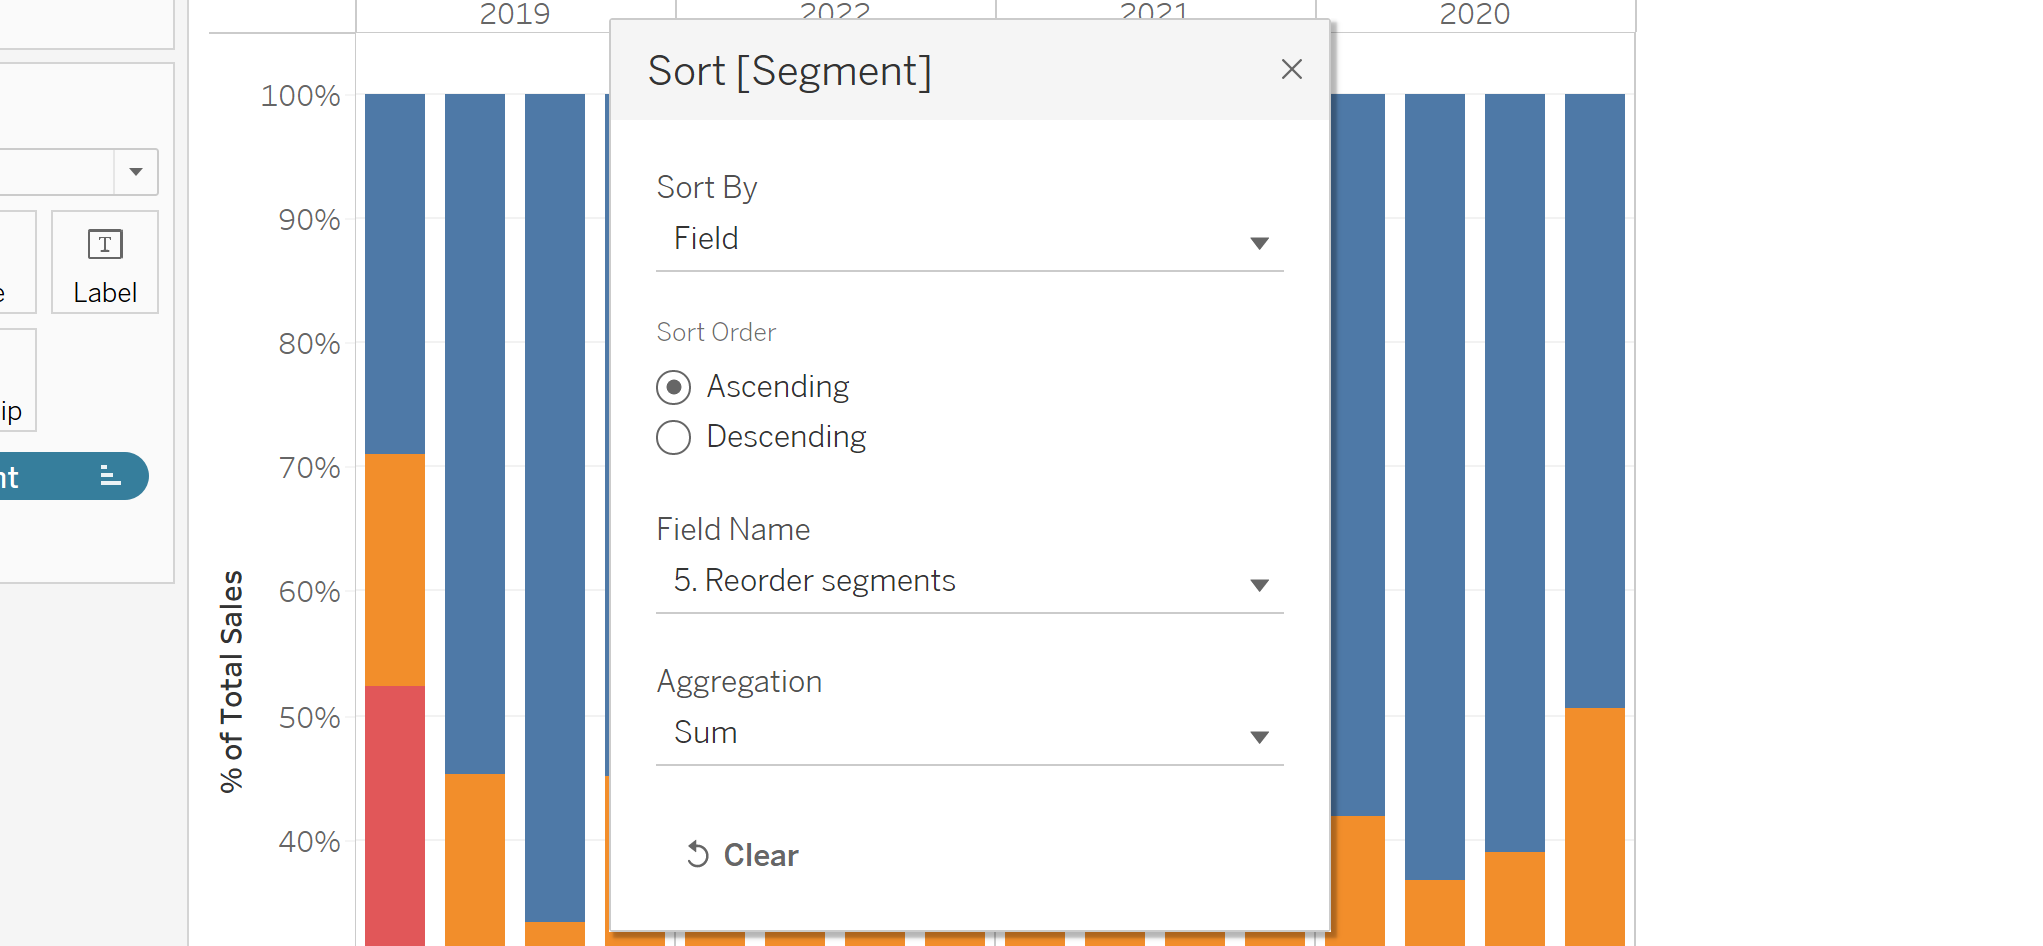
This will open a new window called Sort [Segment]. In the first dropdown option, named "Sort By", select the option for 'Field'. This will reveal the options for selecting a Field Name and an Aggregation type. In the "Field Name" drop down, select your newly created measure (Reorder Segments), and select 'Sum' as your "Aggregation" type. Your window should look as follows:
5. Creating the Action
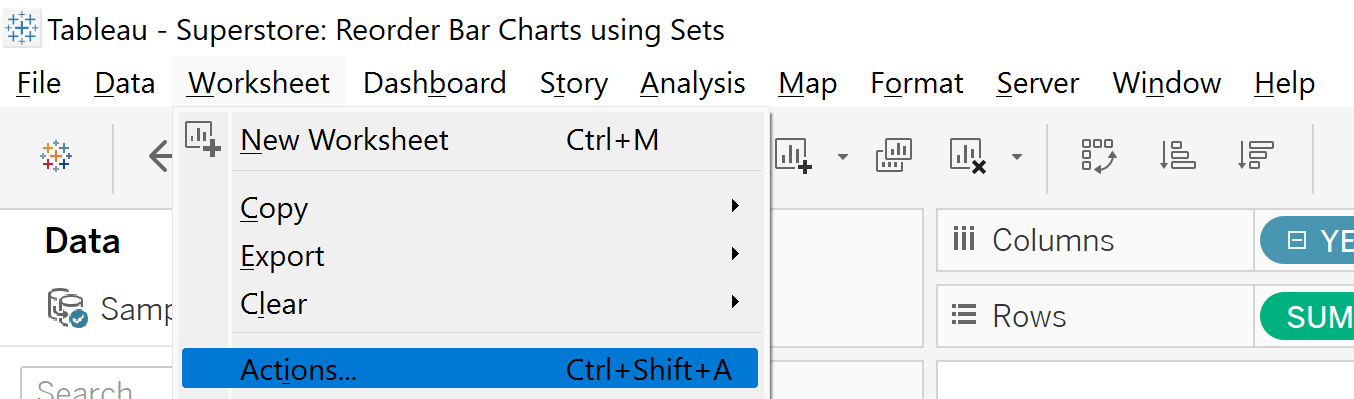
All that is left is to create the action allowing your user to interact with your visualisation. In the bar at the top left of your Tableau screen, locate the Worksheet drop down. Click this drop-down and navigate down to the "Actions..." option. This will open up your actions window. This can also be achieved with the key-combination Ctrl+Shift+A.
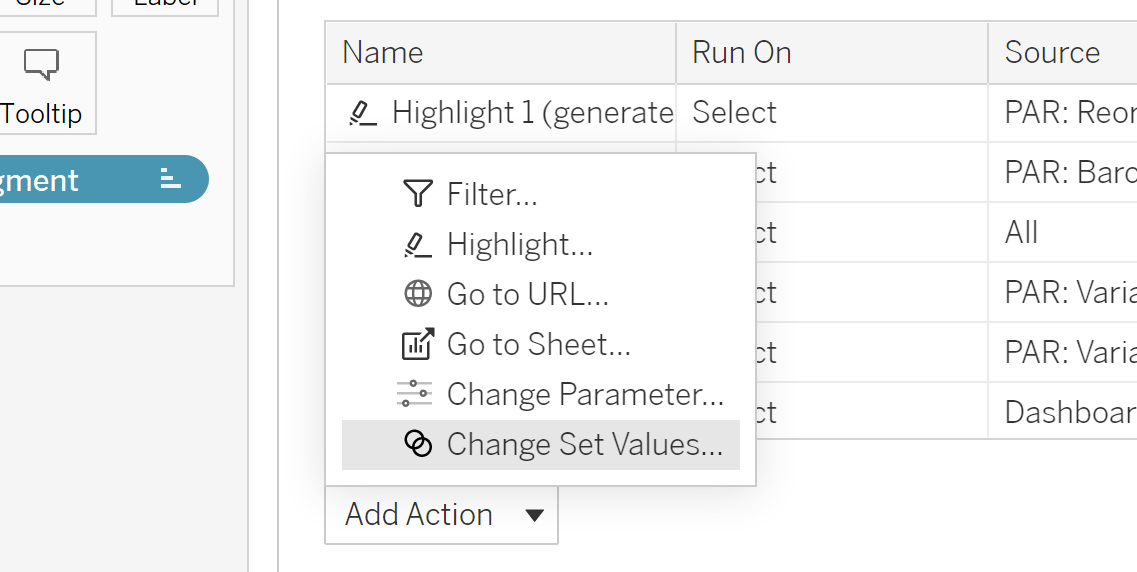
At the bottom right of your Actions window, navigate towards the "Add Action" drop down, and select the option for "Change Set Values...".
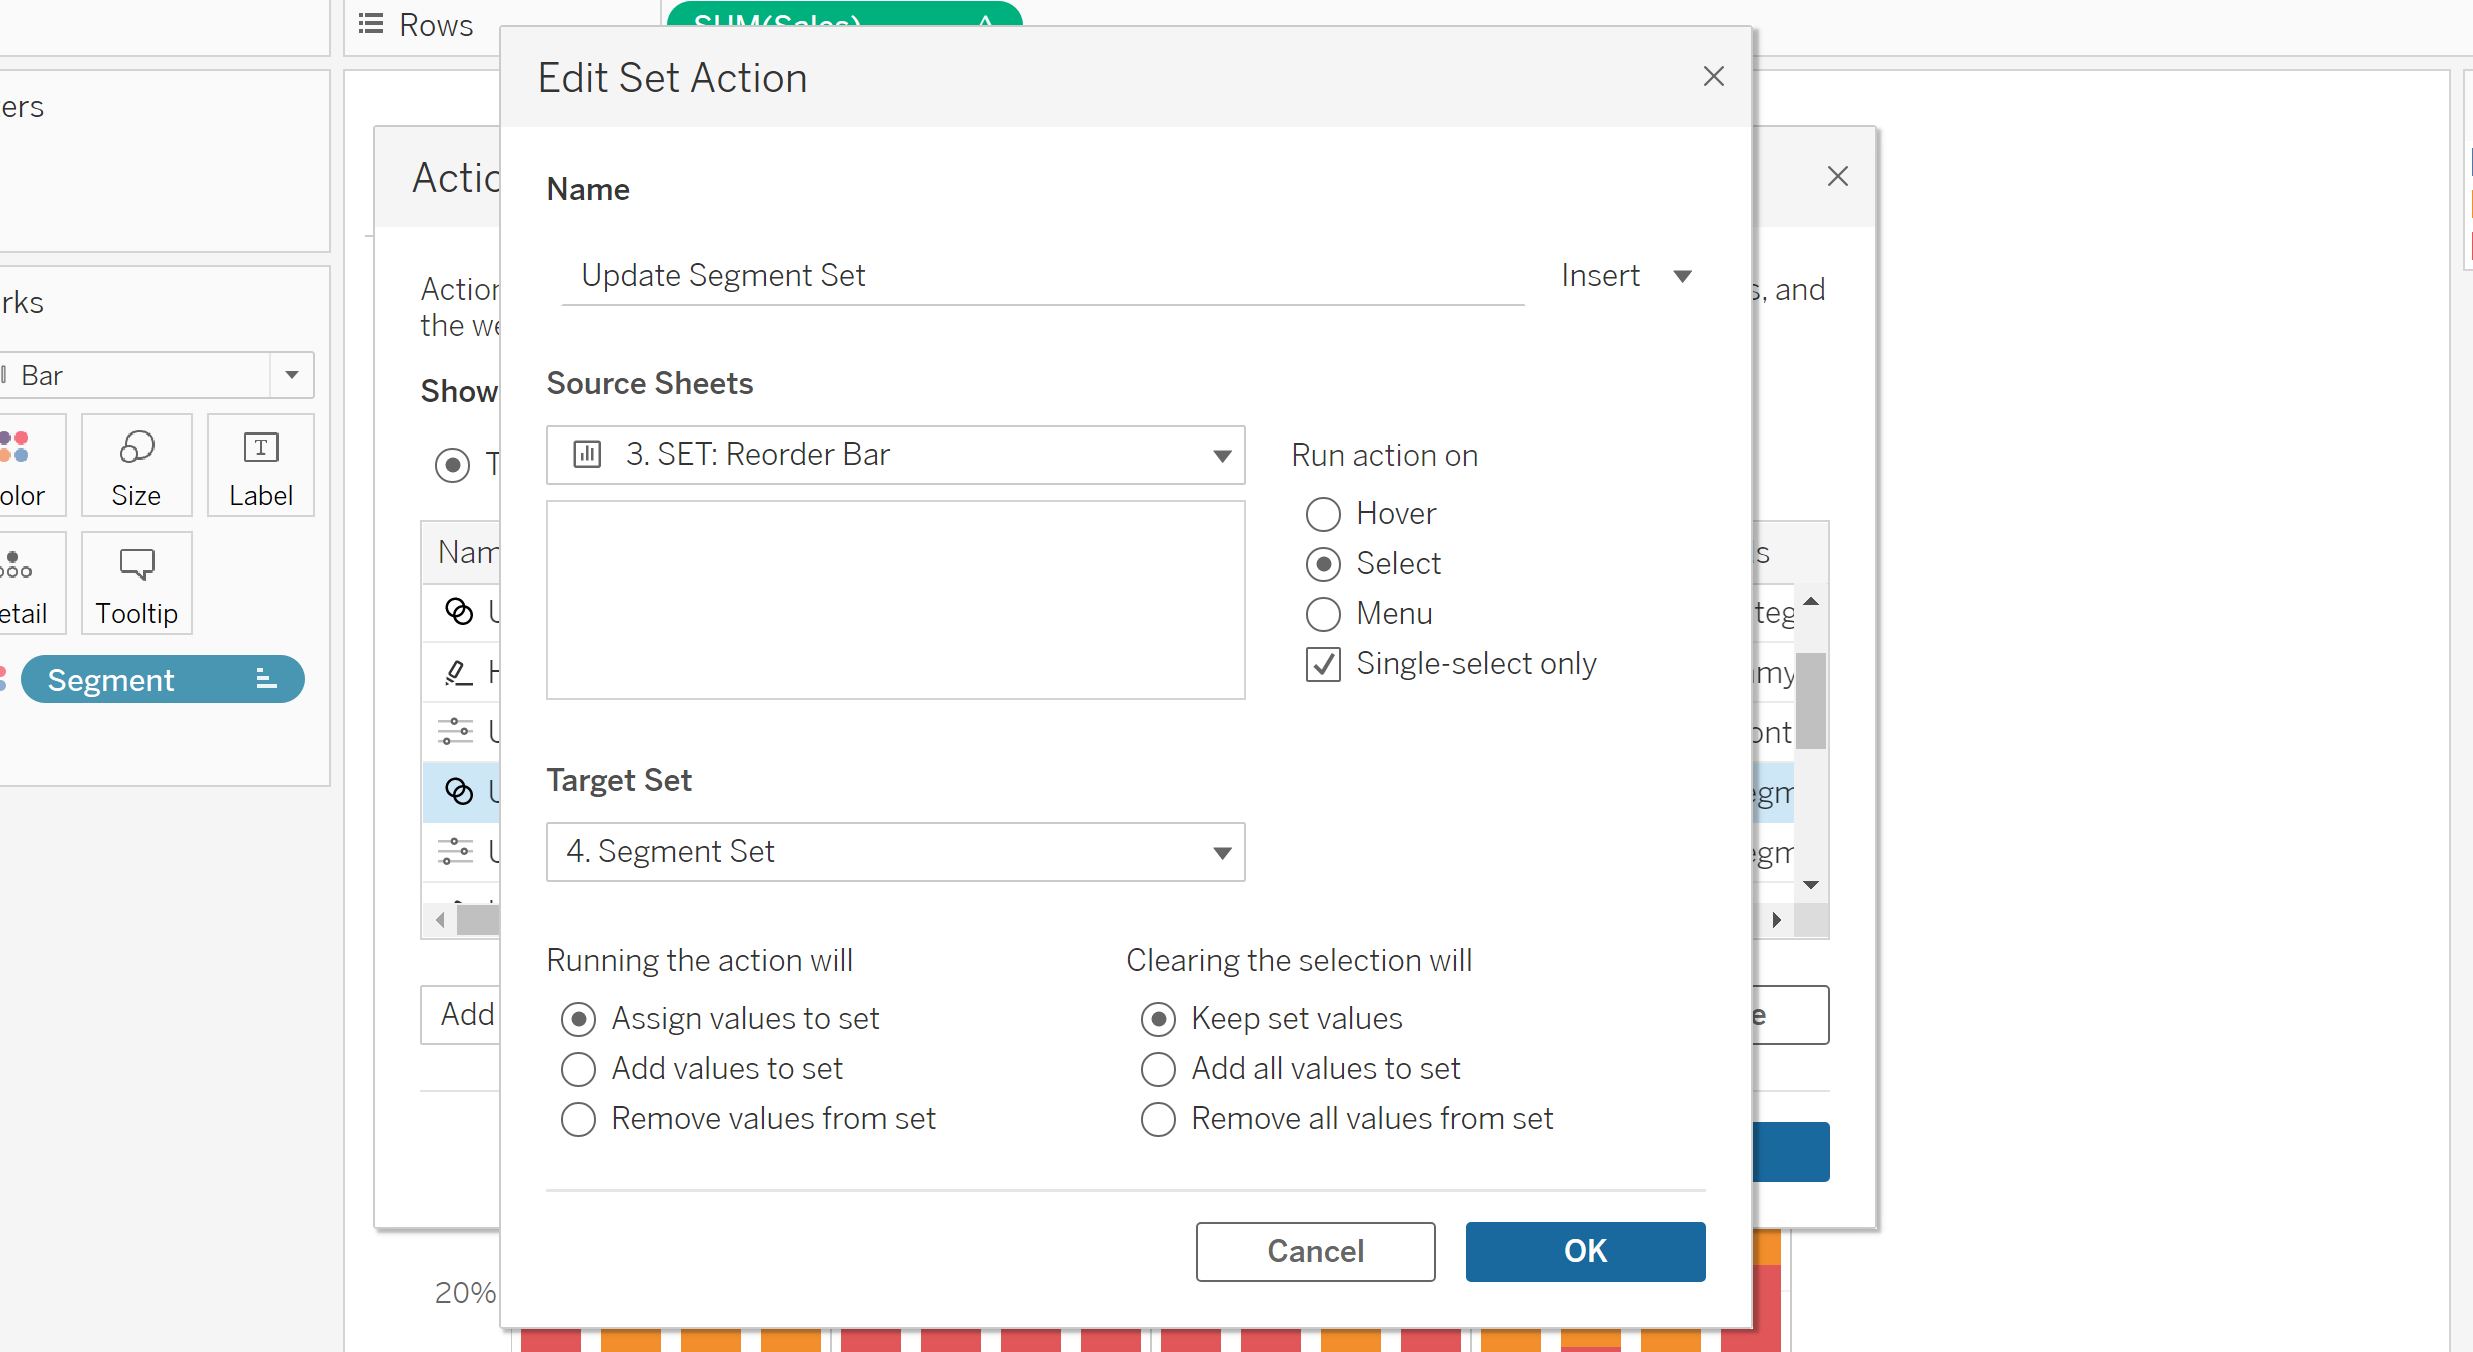
This will open up an Edit Set Action window. Name this Set action something memorable such as "Update Segment Set". In the following "Source Sheet" section, it should have automatically selected the sheet you are working on, but if not, select the sheet to which you are referencing. To the right of this drop-down, choose how you would like to run the action. Selecting "hover" will likely disorientate the user as it will routinely shift around, inhibiting analysis, and selecting "menu" will slow down the interactivity. Thus, the best and remaining option is to run action on "Select". This means any variable selected will update the Set action. Additionally, as only one variable can be at the base of the document, select the option for "Single-Select Only".
In the Target Set section, select the initially created set from part one above - likely named "Segment Set".
Select the options for "Assigning values to set" within the "running the action will:" section, and "Keep Set Values" within the "Clearing the selection will:" section.
Your window should resemble the following, before selecting the "OK" button to close the Set Action window and the "OK" button to close out of the following Action window.
Your sheet should now meet the requirements set out above, alowing the user to reorder the barchart, utilising sets.
6. Optional Extra: Removing the Grey from a Highlight
You may have noticed that when you select a Segment, all other segments result in a greyed out/out of focus view. This optional step explores remedying this.
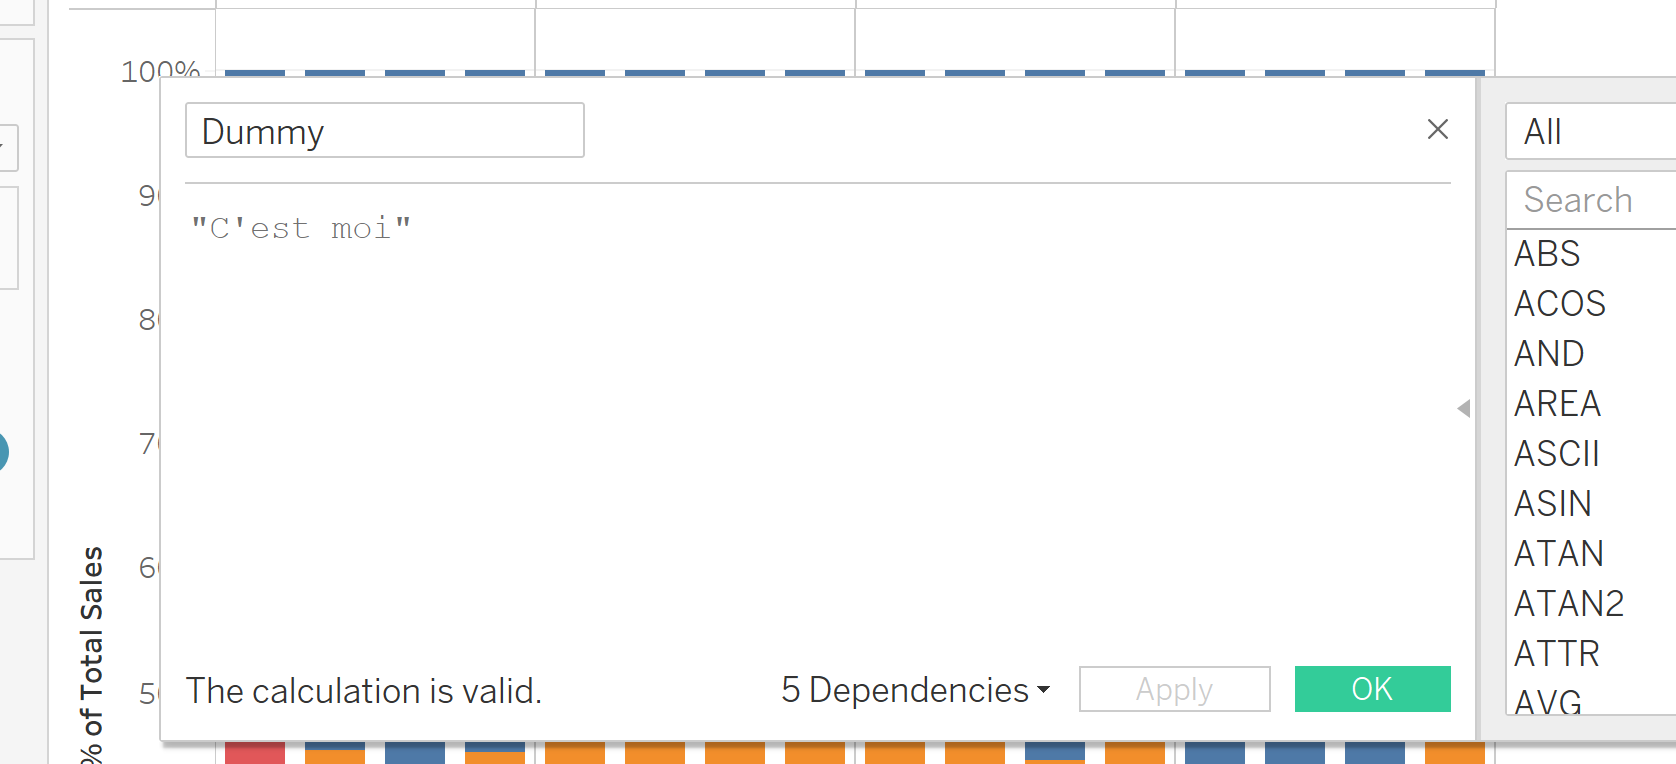
Create a new dummy calculated field as shown in step 3 above. Name this new field "Dummy", and enter a random string value (text encased in quotation marks) in the text pane as follows:
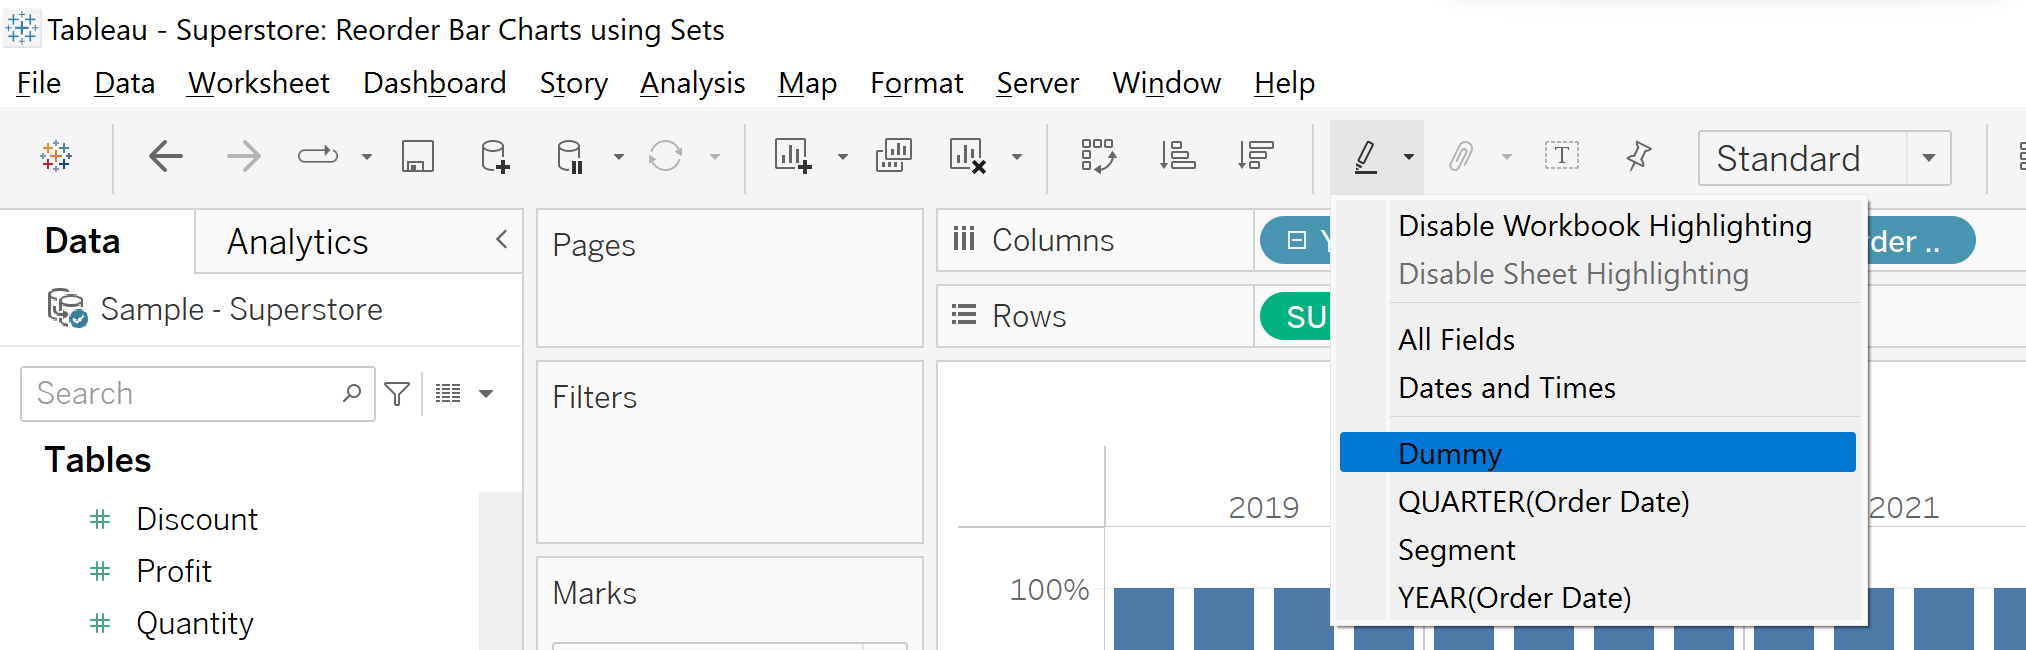
Click "OK" and move this new dimension into the details marks card. Now, at the top left of your Tableau Desktop screen, navigate to the pen icon (pictured below), this is Tableau's highlighting options. Within this dropdown, select your "Dummy" dimension. This will fix the highlighting issue, however, your dummy variable will now likely appear in your tooltip. It would be wise to remove this for presentation.
Thank you for reading!