What is aggregation?
Whilst aggregation is a topic important and relevant to many areas and software, this post will focus mainly on its impact in Tableau. Tableau does it, sometimes without you even being aware of it. So what does aggregation mean? Aggregation in a broad sense is the grouping of objects. As a more practical understanding, aggregation is how we consolidation rows of data into a single cell. This is most often used with some sort of measurement i.e. profit, deprivation score, quantity, weight, etc..
Aggregation is an important and oft misunderstood topic.
When do we use it?
When is aggregation needed? It’s often needed when the data provided/in view is too detailed – aka “granular” – to solve a question. In a data set, we may be given detail at a class level (thousands of rows) when a school level or county level would suffice. Like any good problem, there are many solutions to aggregation, some of which are more or less appropriate for a problem. Some of the main ways Tableau aggregates is by summing all the elements, or by averaging all the elements, or taking the maximum of all the elements. Any of these methods could take 1 million records and convert them down to a single record.
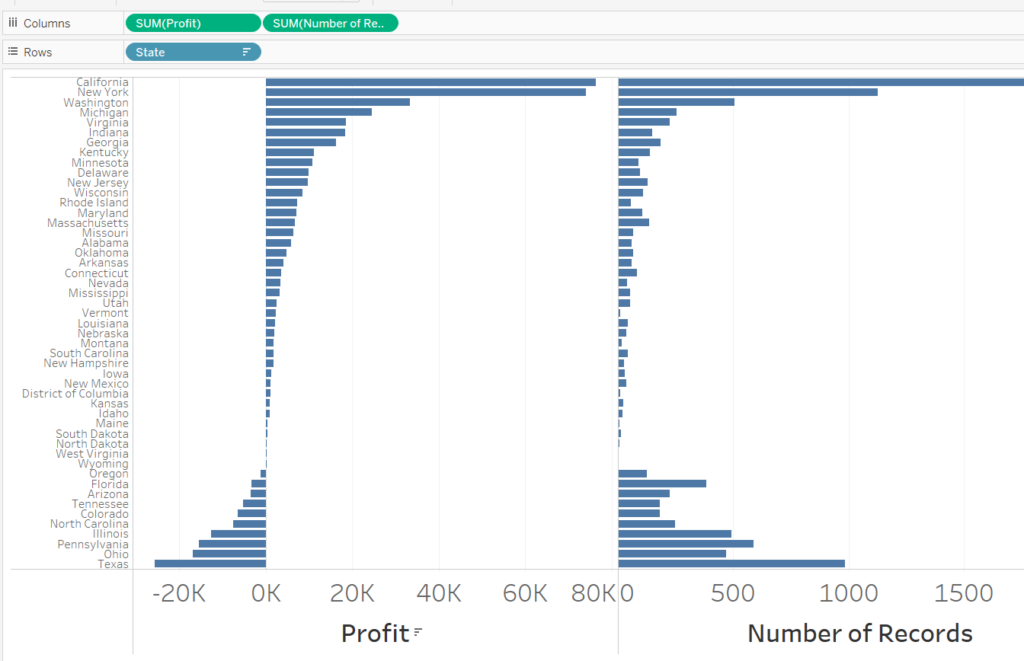
By and large, a new user’s initial engagement with aggregation is implicit. Any time a measure is thrown into Tableau’s view (without the row level of detail also in view) Tableau will spit back an aggregation. To give a more concrete example: In superstore sales, when you answer the question “which states are most profitable?”, by throwing states and profit into view, the values spit back at you and visualised by Tableau are aggregations, not contained anywhere hard coded in the data.


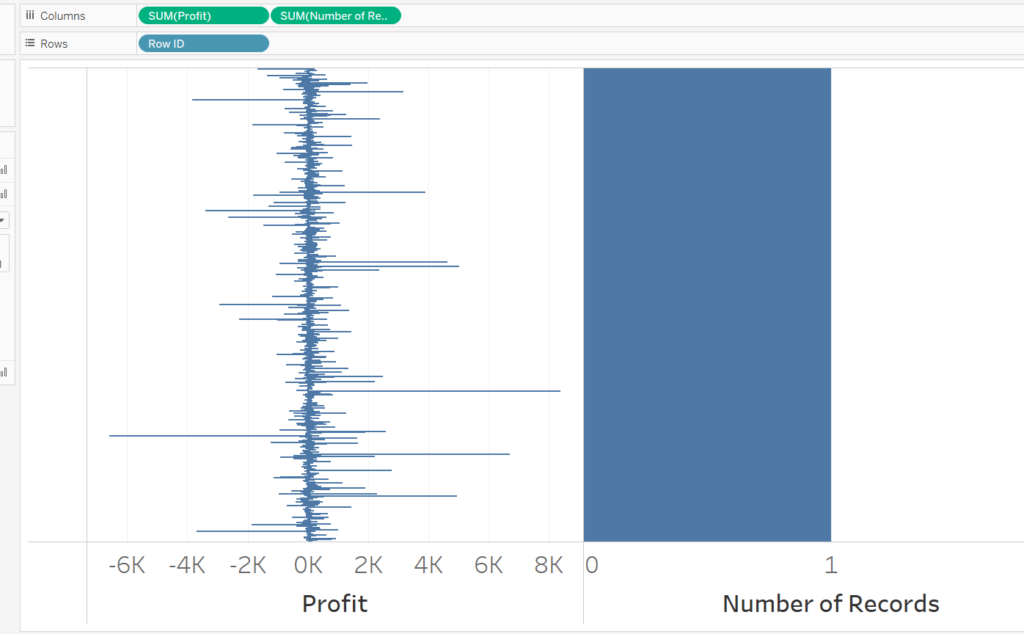
The easiest way to identify if and how much measure has been aggregate is shown above: using number of records. As can be seen above from the states’ example, some have over 1000 records each, but, in the case of row id, there is only a single record. Row ID has no aggregation in its profit output (despite the measure saying sum).
The problem of aggregation
The problem comes:
A) When you do not recognise what the aggregation is doing
B) When you cannot accurately determine whether to aggregate measures and then perform a calculation or perform a calculation and then aggregate.
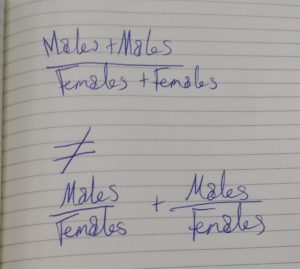
For example, if we wish to calculate a male to female ratio for the school but each row is a class, the appropriate way would be to sum all the males of all the classes and then sum all the females of all the classes and take that summed figure for males and divided it by the summed figure of females. Often people in Tableau will take SUM([Males]/[Females]) to represent this measure. This would not perform the calculation described.
Let me take you back to the basics of calculation and show you why this computation is:
A) Not the same
B) Wrong


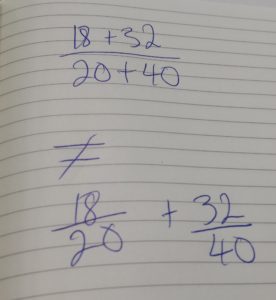
So as the pictures correctly identify, if you were to calculate each side of the equation you would find that they were not equal.
The top half of the equation is performing the calculation described above: summing all the males of all the classes, summing all the females of all the classes and then calculating the ratio. This is the way that a school wide male to female ratio has to be calculated.
The bottom half of the equation, by contrast, calculated the ratio of each class (each row) and then sums these class ratios to provide a school wide ratio WHICH IS VERY WRONG!
The bottom equation is the problem that occurs often because people:
A) Do not realise that calculating first makes a difference to the result/do not understand that the two equations above are not equal
B) Do not realise that Tableau will perform the calculation at the row level before aggregating
This is a fundamental topic of Tableau if my explanation did not bring back some memories of high school maths to help you understand it, I hope that you will read further on the topic.
NB: If you still manage to find some inexplicable results in Tableau I suggest reading about the order of operations in Tableau, this is another major element which can cause “incorrect” values to be returned.
https://onlinehelp.tableau.com/current/pro/desktop/en-us/order_of_operations.html
