


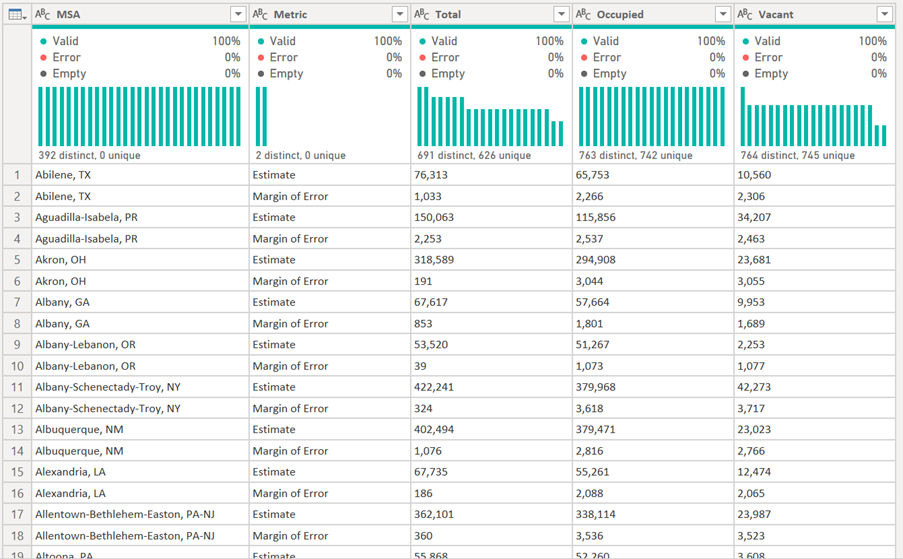
- Data Profile and Data Prep
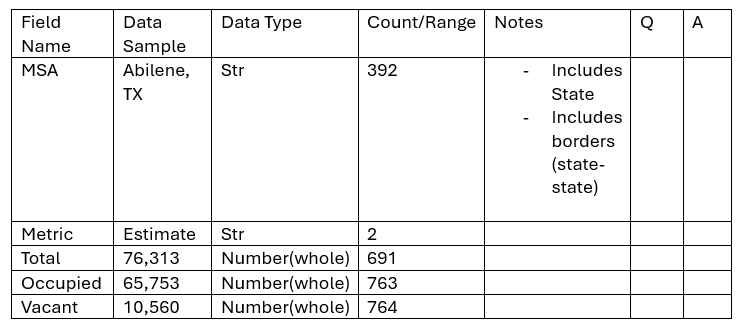
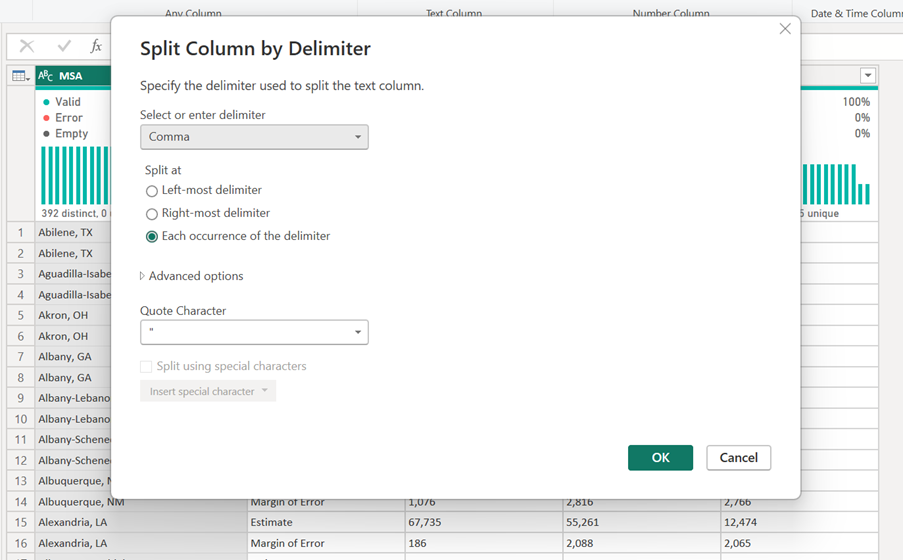
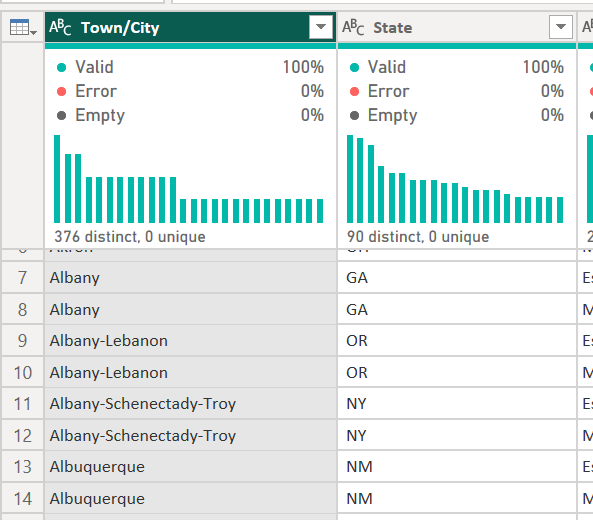
Split MSA into town/city and State
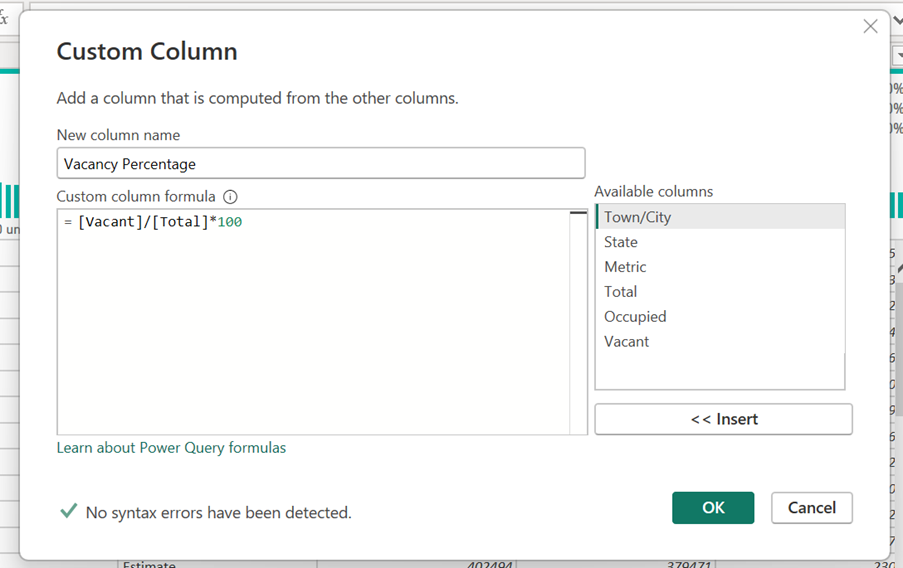
Create new column - vacancy percentage = vacant / total * 100
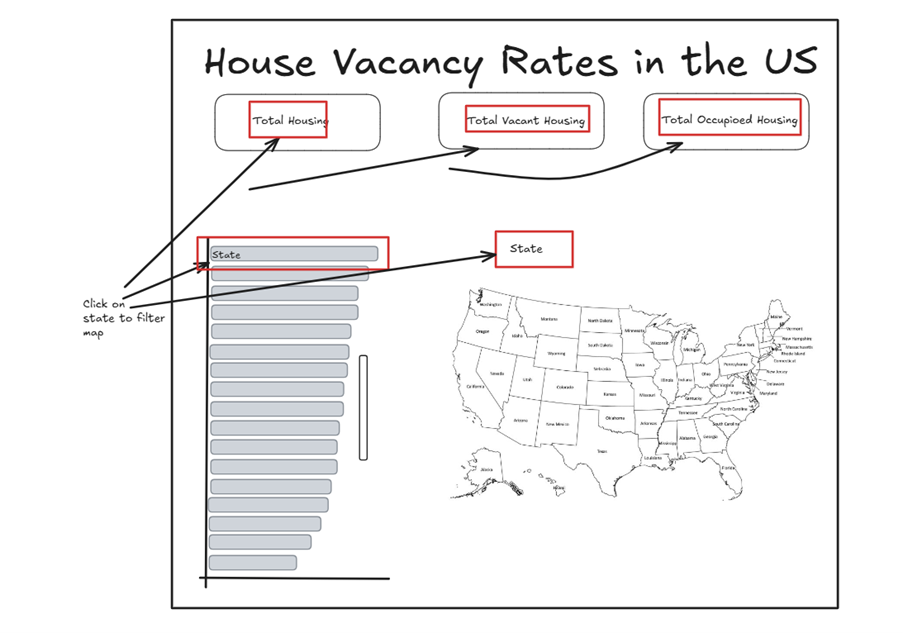
- Sketch Report
- Finished PowerBI report
- Future Changes
When filtering state, drill down into town/city in the map.
Change circle size as total and colour as percentage of vacancy rate (sequential colouring; dark higher percentage – light lower percentage).