


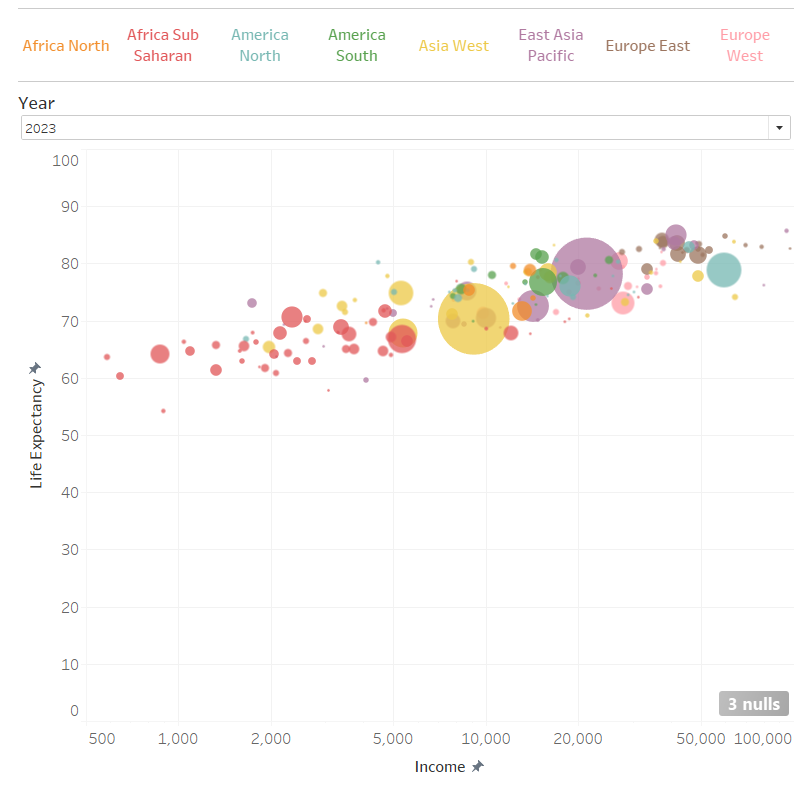
This guide provides step-by-step instructions for the advanced Tableau users to implement dynamic axis range adjustments in any scatter plot using parameters.
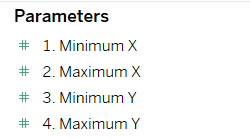
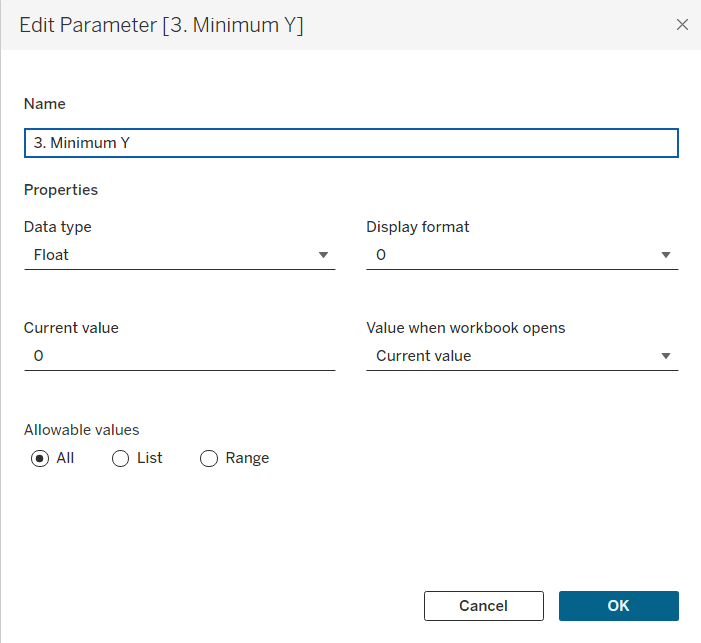
- Create 4 parameters corresponding to:
- Minimum value of the X axis of your scatter plot
- Maximum value of the X axis
- Minimum value of the Y axis
- Maximum value of the Y axis
Set the parameters to the data type 'Float' and ensure that All values are allowable.
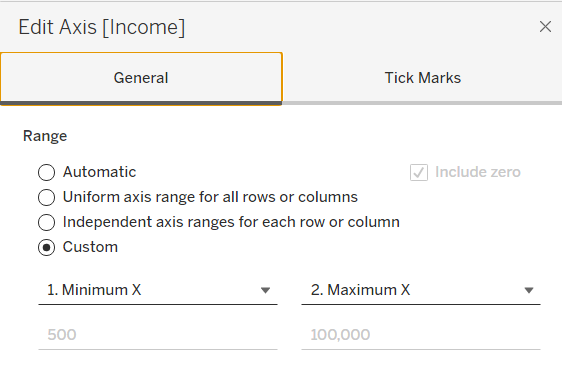
- Adjust the settings of both the X and Y axes [Right-click on axis -> Edit Axis...] by switching from the Automatic range to a Custom range defined by the parameters you've established.
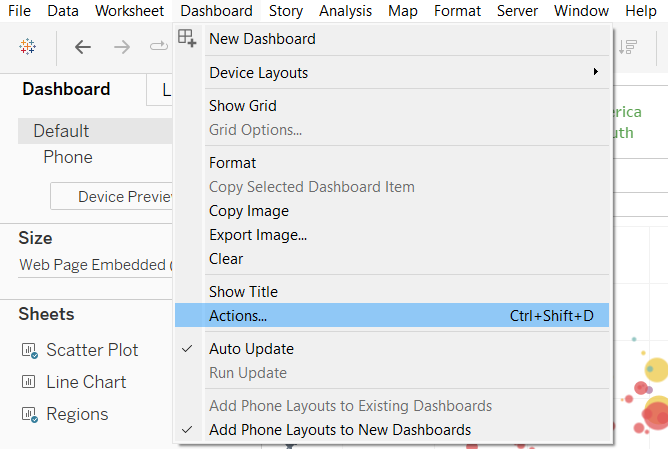
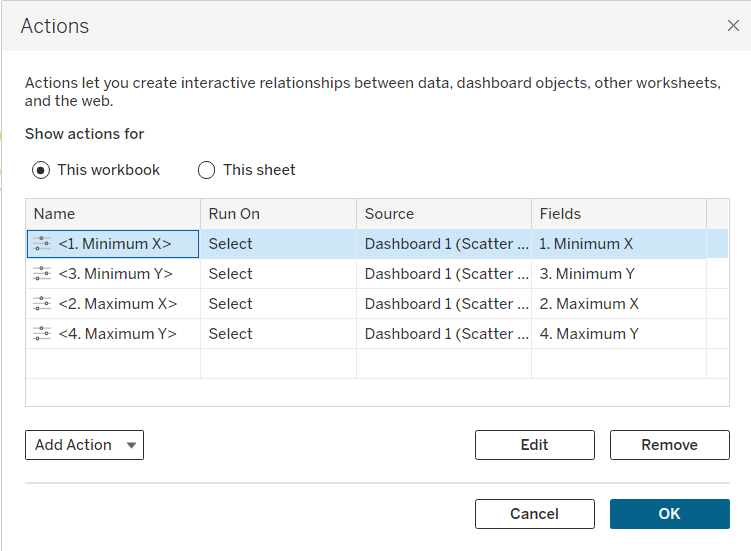
- Go to the Dashboard containing the Scatter Plot.
- Select the Action option from the Dashboard drop down menu at the top bar.
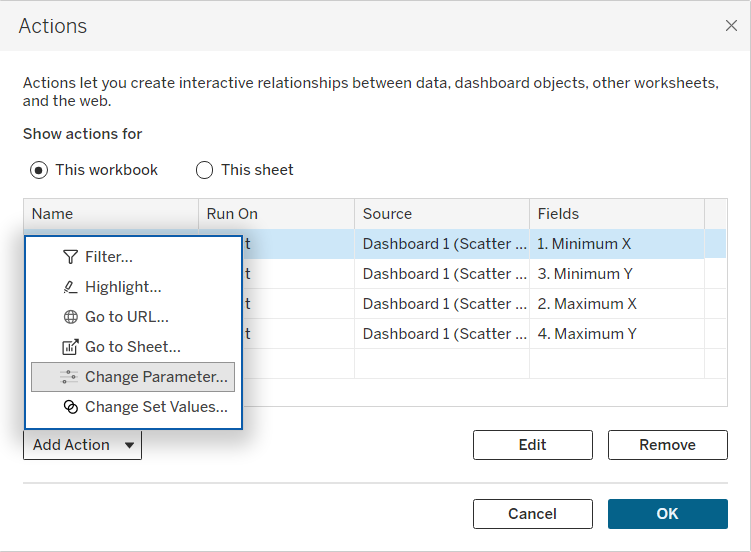
- Add 4 new "Parameter Change" Actions:
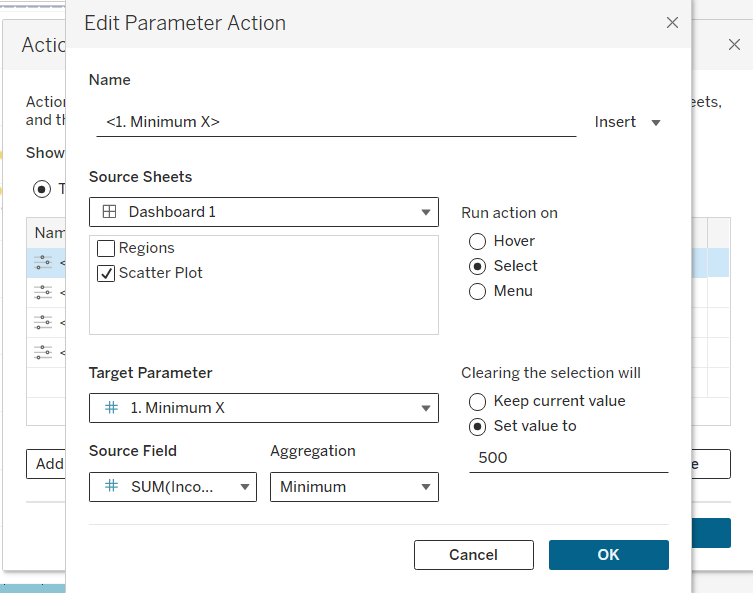
- Set Source Sheet to the Scatter Plot from your Dashboard (NOT from the original Sheet containing the Scatter Plot);
- Set the Run Action upon Select;
- Set the Target Parameter to each created parameter;
- Set the Source Field to the Measure that determines the corresponding axis;
- Set the Aggregation to either Minimum or Maximum, depending on whether the Action applies to the Minimum X/Y Parameter or Maximum X/Y Parameter.
- Upon clearing the selection, parameter should Set Value to the one You've specified as the Current during the parameter creation step (either Maximum or Minimum value of the X or Y axis of the Scatter Plot). That has to be specified manually in the Edit Parameter Action window.
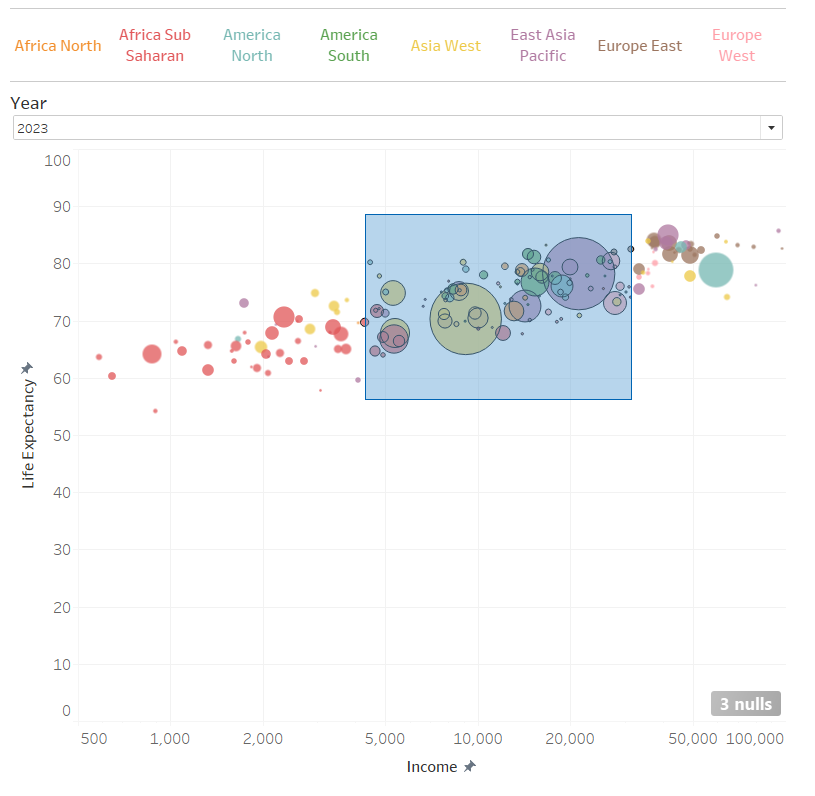
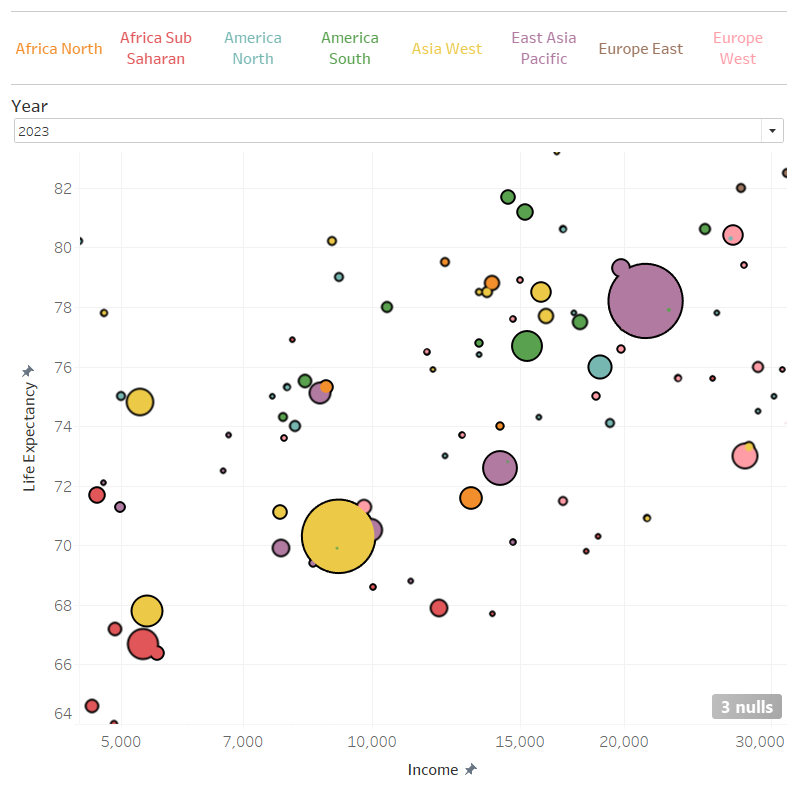
User should now be able to seamlessly adjust the area of view of the scatter plot to focus on specific data points of interest.