


Recently I took on the Makeover Monday challenge for week 40 in 2026: https://makeovermonday.vercel.app/dataset/songs-with-cowbell
The week's topic covers songs that feature the cowbell instrument, and here is the original viz that we were asked to makeover:
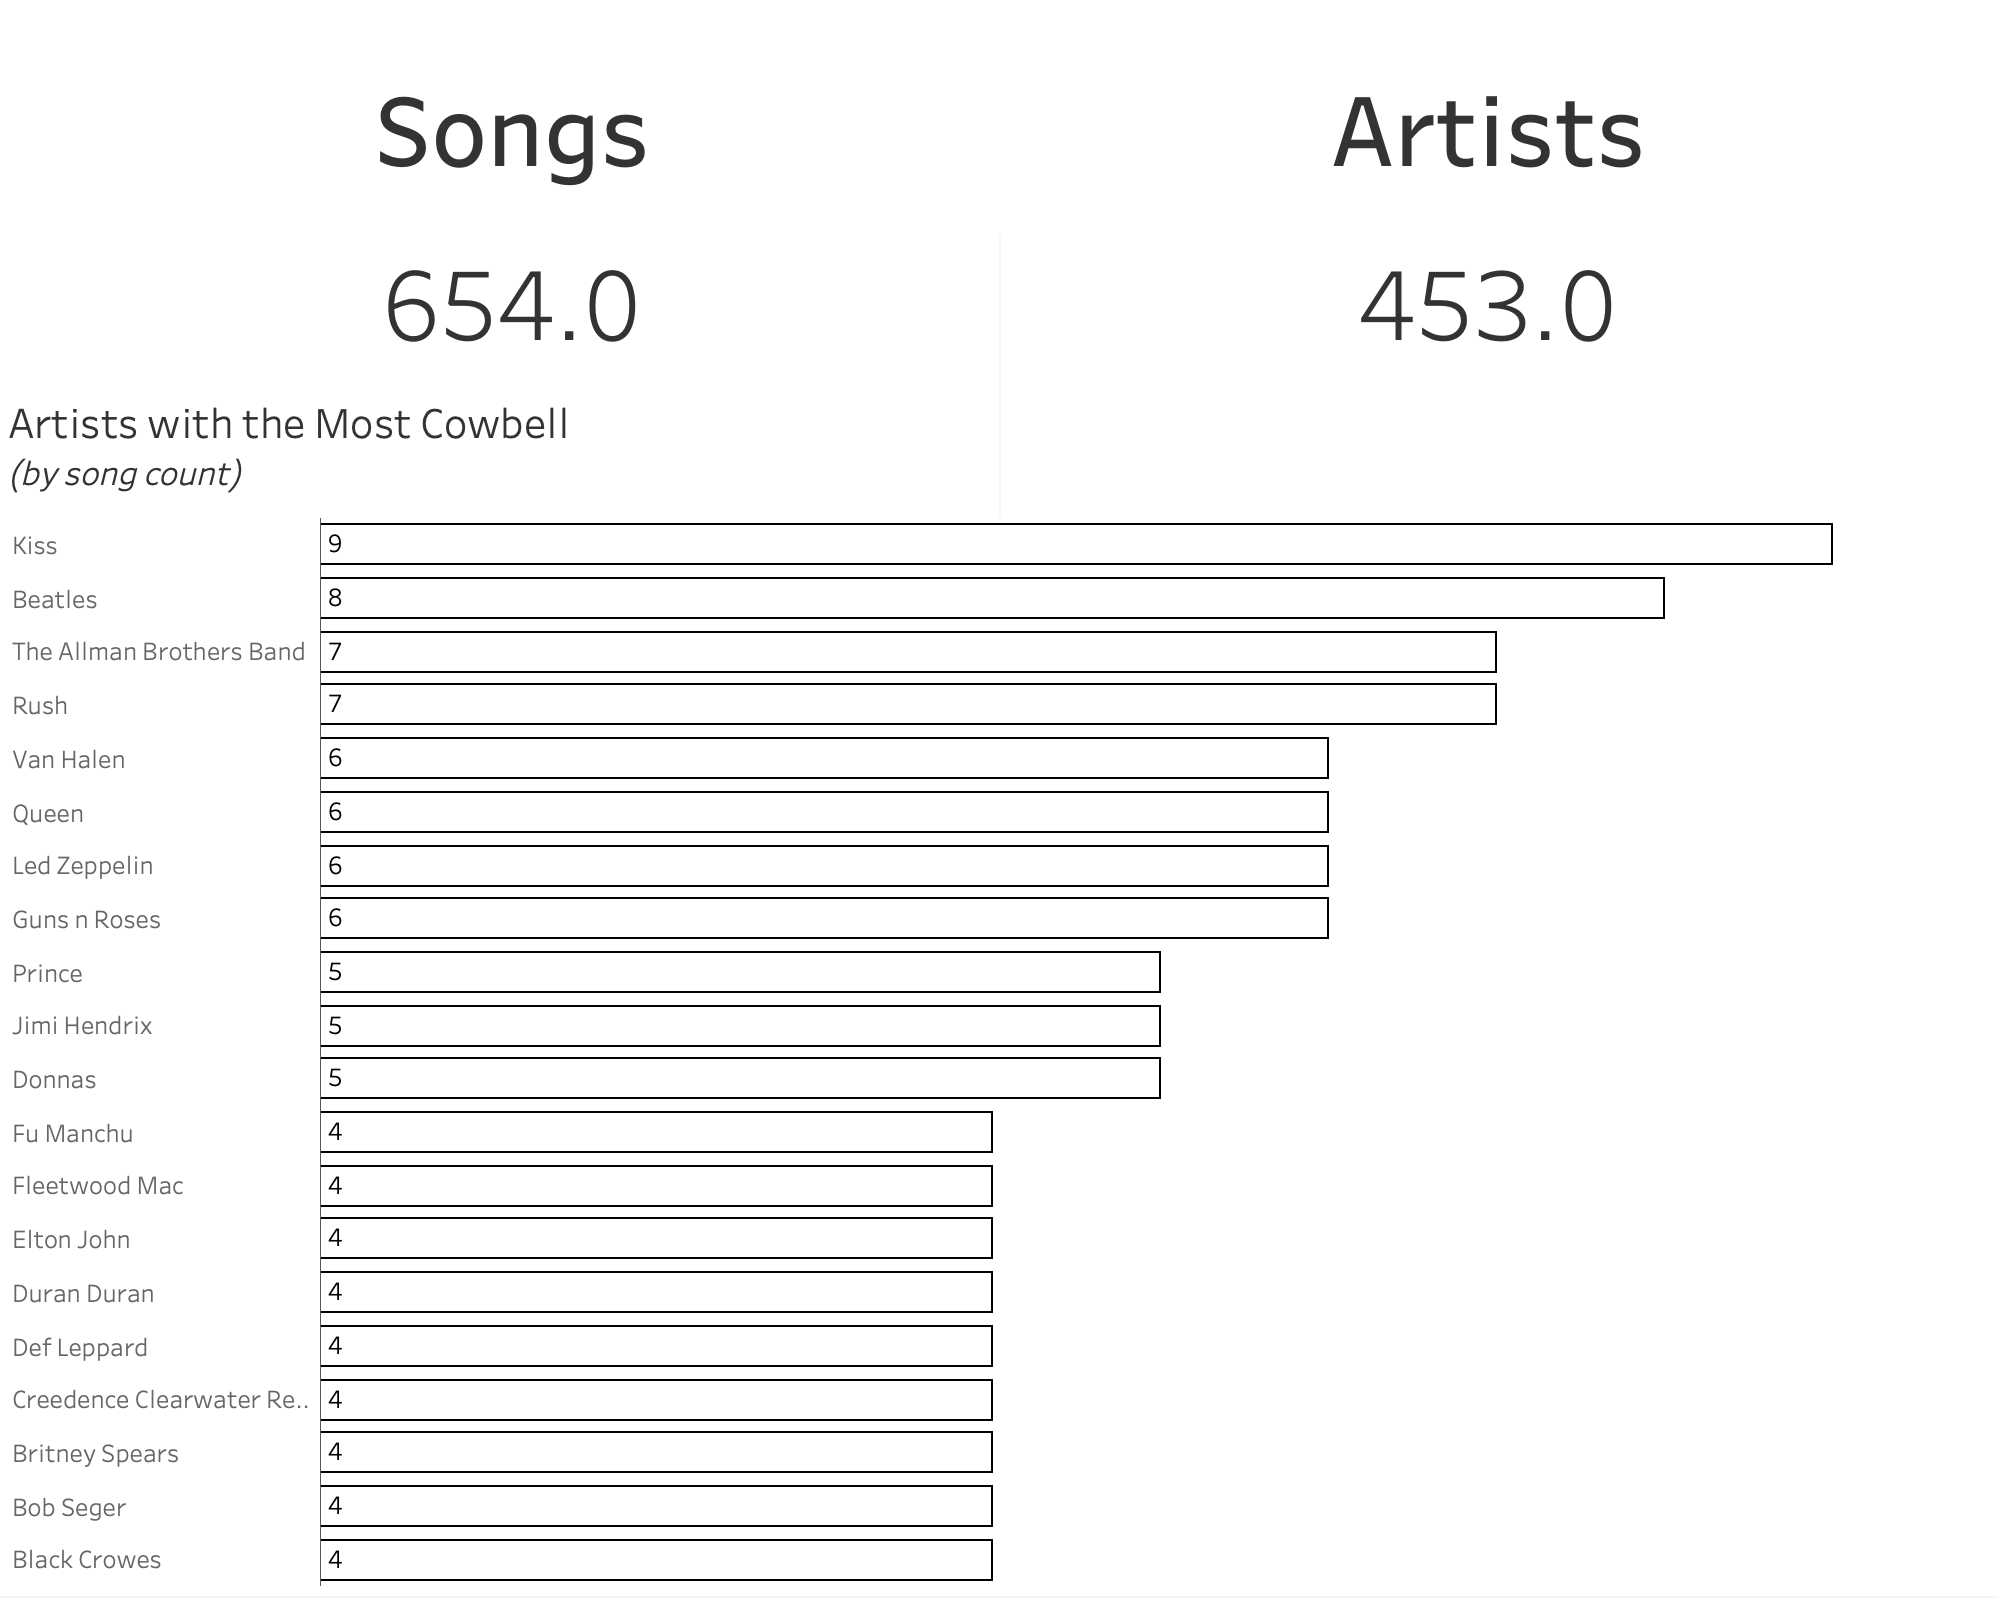
The Dataset and Ideas
I downloaded the dataset, and quickly realised that there wasn't much to work with! 600+ songs and artists and that was it. So I got my thinking cap on...
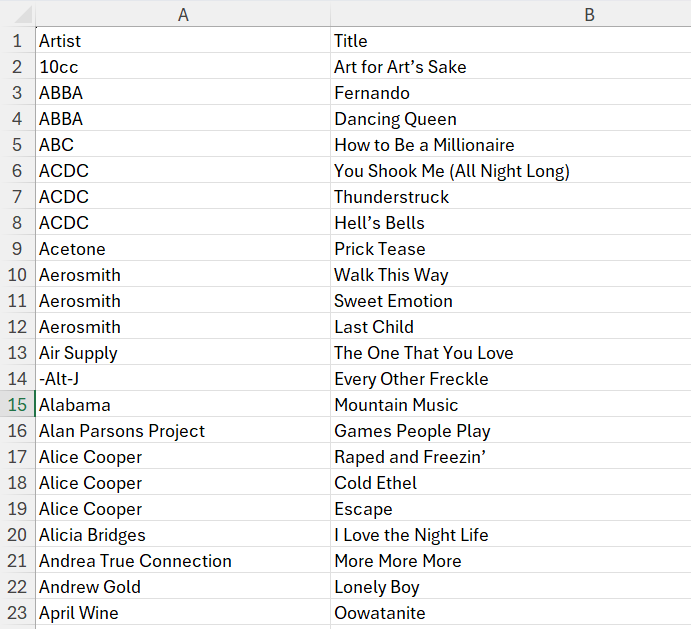
I’ve always wanted to try my hand at Tableau artistry using custom X and Y coordinates to create illustrations. And (perhaps hilariously) this is what I came up with in my first attempt:
PS. I love this actually, and in time I hope to get better! Full explanation of the steps below for how I arrived at this...
So, how did I do it?
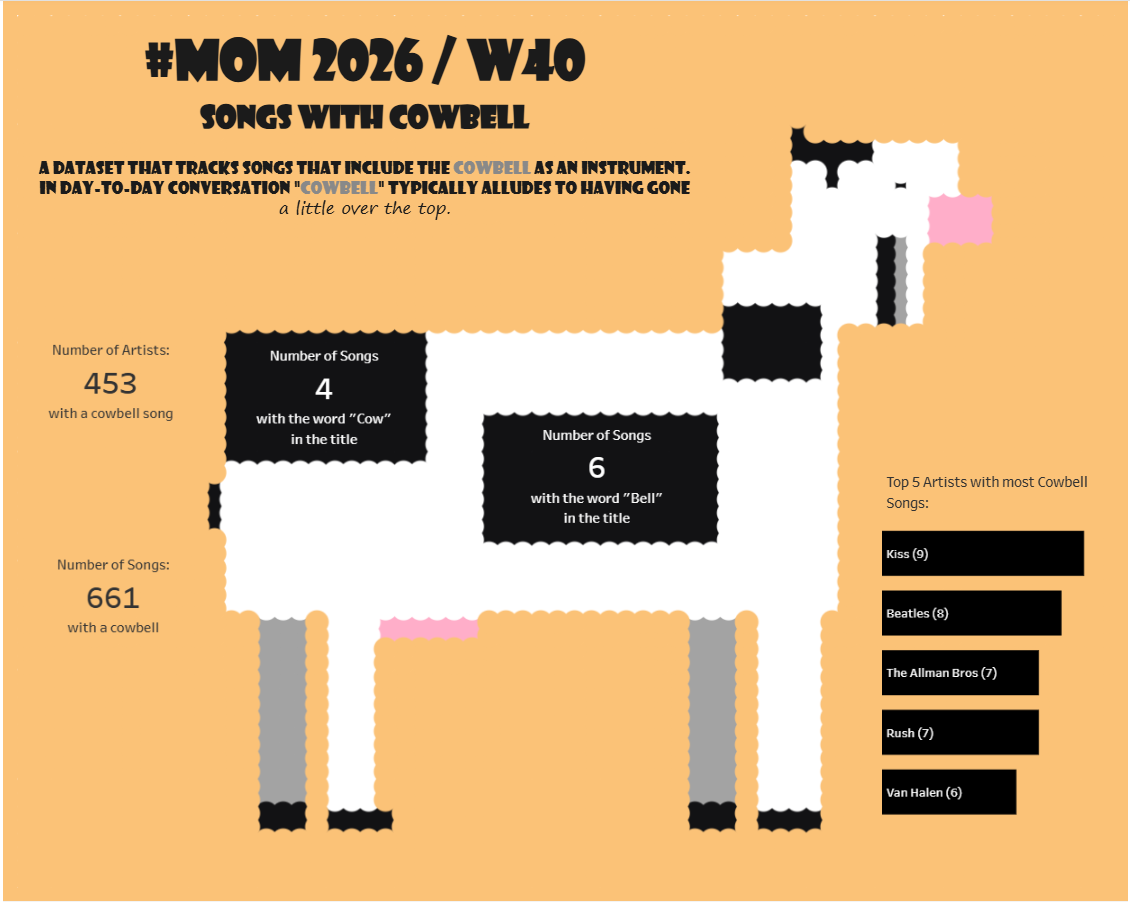
Firstly I created two additional sheets in the Excel file. The first will be for all of the co-ordinates for the entire image, the second will be purely for the colour of the cow.

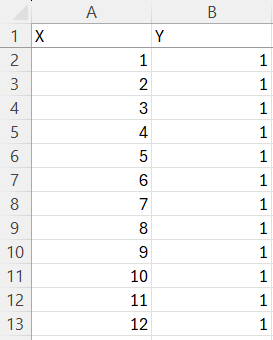
In the first sheet I created a column for X and one for Y. X was populated with numbers from 1 to 64 and the adjoining Y repeated 1. This provided the first sets of co-ordinates (1,1 / 2,1 / ... 64,1). I then repeated this, incrementing Y by 1 for each set of X, until the final row showed (64,64).
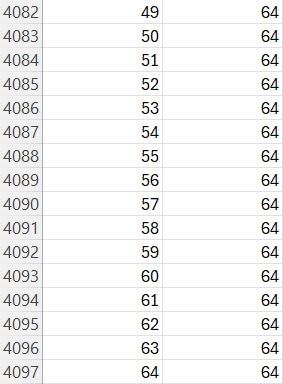
The next step was to work out the colour scheme and the structure that would allow the image to be displayed in Tableau.
For this I first created unique* co-ordinates for the combinations of X and Y using concatenate: =CONCATENATE(A2,B2)
*I later realised that this wouldn't create a completely unique co-ordinate list as X1,Y11 would be 111, the same as X11,Y1! This could be fixed by adding a delimiter such as =CONCATENATE(A2,"-",B2), but it doesn't seem to have affected this particular project.
The ColourDon'tUse column was created in order to have a comparison field. This field will purely be used as part of the final stage of preparation and not brought over into Tableau (hence the very obvious header name!).
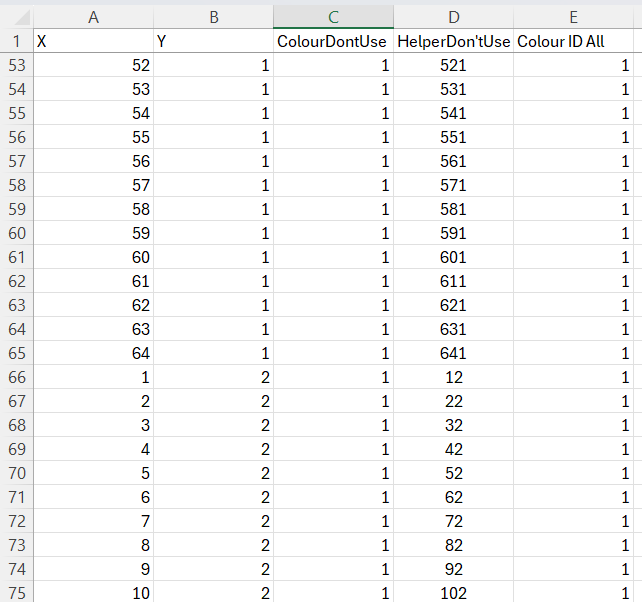
The final step was to go back to the first sheet to create a column named Colour ID All. This would lookup the unique co-ordinates from the cow only sheet and if it found a match it would return the new colour assigned number, otherwise it would remain as 1:
=IFERROR(VLOOKUP(D2,'Cow Only Grid Coords'!$D$2:$E$1145,2,FALSE),C2)
Naturally this could all have been completed via Tableau Prep, but hopefully those following along and without access to Prep will appreciate the explanation here 😄
I next found a suitable image online; one with a single colour as the background along with the image of a cow. I ran this through AI in order to quickly source the specific co-ordinates that would add the cow's colours to the right places across X and Y.
The prompt I used was: "I am building an image in Tableau using specific X and Y co-ordinates. From the attached image, please could you provide the co-ordinates only when the colour is of the cow, and not of the background. I will then place this into an Excel file to be connected to Tableau. Please also provide the Hex codes for the colours that you assign each co-ordinate to."
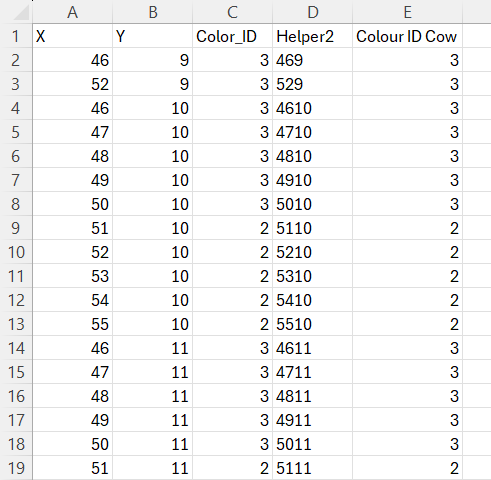
I then pasted the provided X and Y co-ordinates into the cow only sheet in my Excel file, Helper2 was populated with =CONCATENATE(A2,B2), and Colour ID Cow was a simple =C2, =C3 etc (simply to get the VLOOKUP to work). This left me with:
Inside Tableau
The Excel file was now ready to be connected to Tableau.
I first opened a new sheet and placed discrete X and Y onto Columns and Rows respectively.
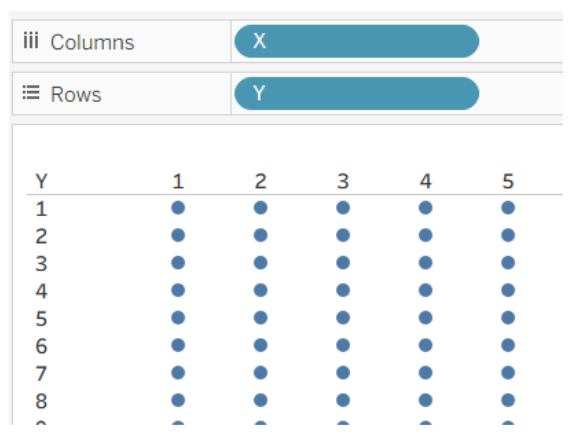
View became Entire View, Size was increased, the Mark was changed to a Circle, and Colour ID All was placed onto colour (unsurprisingly!).
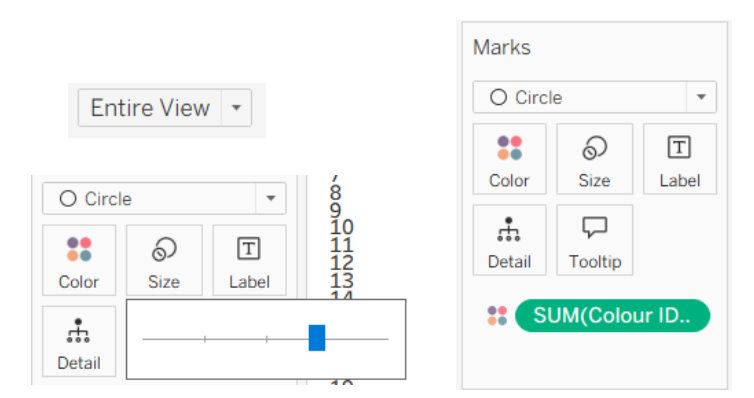
The image then looked like this:
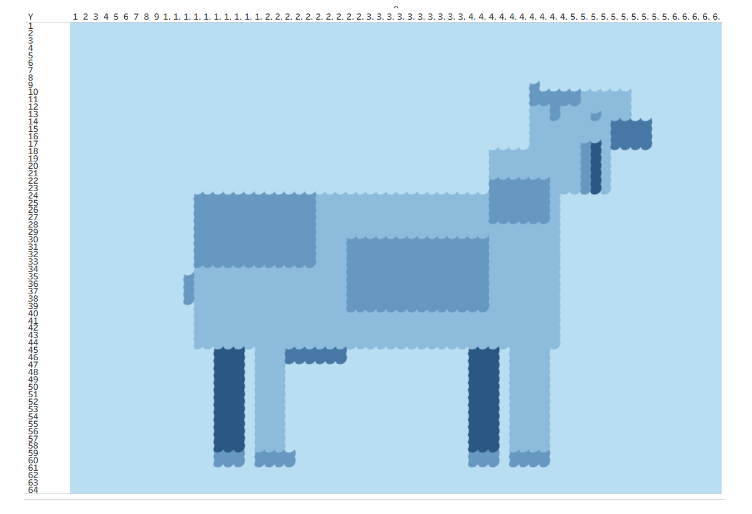
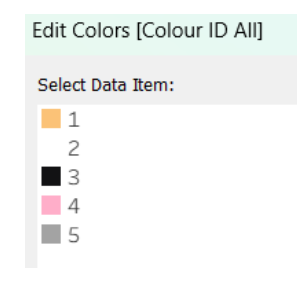
The next step was to change Colour ID All to discrete & dimension, and then assigned the colours to the following palette:
• 1 (Background Orange): #FBC277
• 2 (Cow White): #FFFFFF
• 3 (Cow Black): #121214
• 4 (Pink Accent): #FFAEC9
• 5 (Shadow Gray): #A3A3A3
Final Steps & Tidy-up
I added a Dummy calc field and ensured it was activated on the screen (this is to ensure that an accidental click on any of the 4000+ co-ordinates doesn't dim the other 4000 points!).
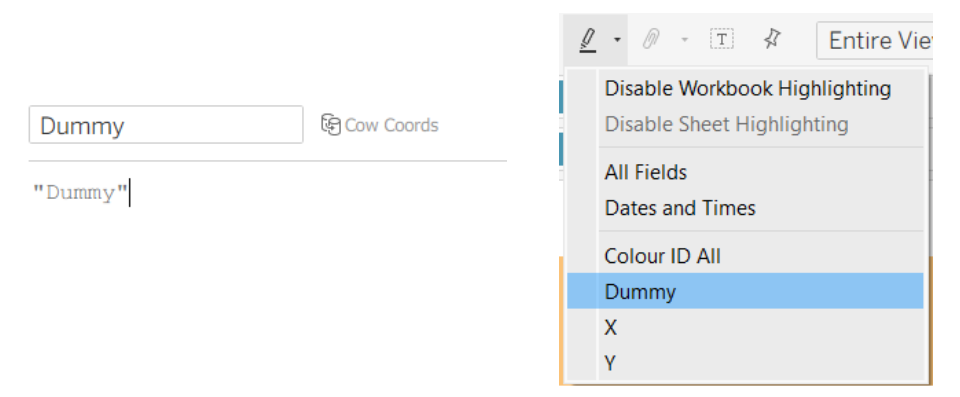
On the dashboard I added some extra sheets of interesting points (such as songs with cow or bell in the title), formatted the title, changed the size, hid the titles and headers of the sheets etc. I also at the very end added a floating blank that I used to cover the whole dashboard (which is a different option to using the dummy calculation above). As this is not intended to be an interactive dashboard, this works very well to prevent unintended consequences from a stray click.
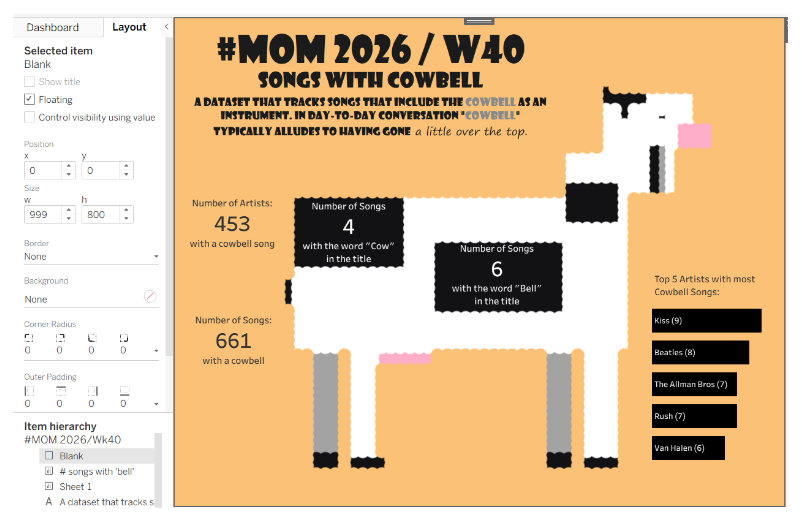
All in all, for my first attempt I really like this. Feel free to get in touch if I've inspired you to have a go at something similar 😃🐮🔔