


Crosstab a tool that will let you transform rows to columns. So, let’s jump right into Alteryx and get started.

So here we have our data set where we have state, the week, the company name and the avg price for that week. This data set is hard to understand because all the avg prices are in one long row, making it hard to compare between companies, state or week. So, what we could do is crosstab one of the columns here to expand the data set to make these comparisons. To get the crosstab tool we go up and click transform and drag the crosstab tool down onto the workflow.
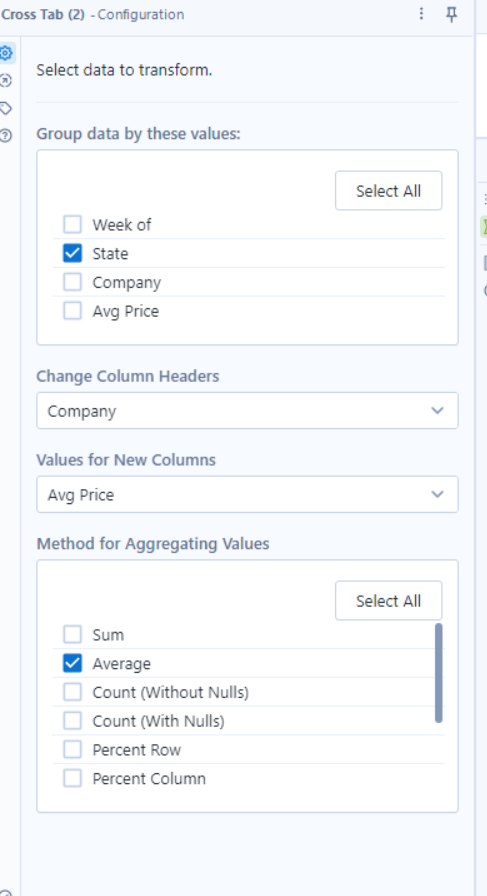
In the configuration panel, the first setting we see is group by.
This setting shows us the columns in the data set to group by. So, if I select state then all of these Arizona will combine into one row. If i were to press week of as well, then all rows that have the same week and same state will be combined into one row.
Next, you need to select what your new headers will be. I will select companies, and what this does is every unique value in the row, which in this case is the four different companies will become a new column.
Next you must assign the values to the new columns, which in this case will be the avg price, because that is the measure we are using to compare companies.
Lastly, you must tell Alteryx how to aggregate these new values. The reason why this is needed is because, when we group by something Alteryx needs something to do with the duplicate values, does it add it, average it, or even take the maximum value. If you were to choose a string column the options here would be concatenate, first or last. We’ll click average and press run and what you’ll see is a row for each state and the avg price for each company by state.
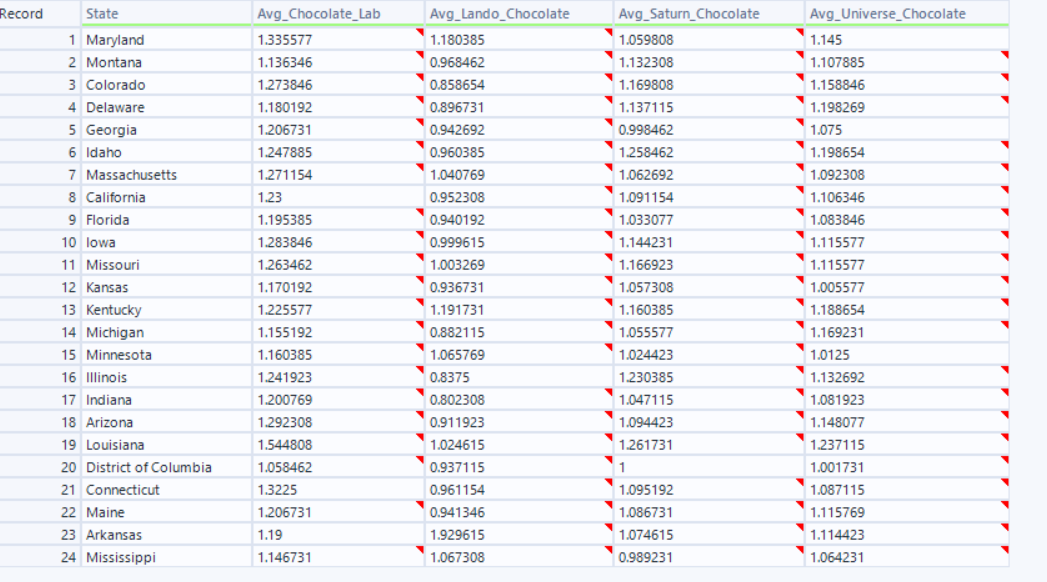
Notice the week column is completely gone, this is because it wasn’t grouped or chosen to be a column it was dropped from the data set, if nothing is clicked then it will be discarded.
There is your final product, a data set that is much easier to read.