


For day 2 of dashboard week, we were asked to explore some survey data looking at the preferences, interests, habits, opinions, and fears of young people… fun fun!
Data:
Overview of the dataset from Kaggle ( see here):
In 2013, students of the Statistics class at FSEV UK were asked to invite their friends to
participate in this survey.
- The data file (responses.csv) consists of 1010 rows and 150 columns (139
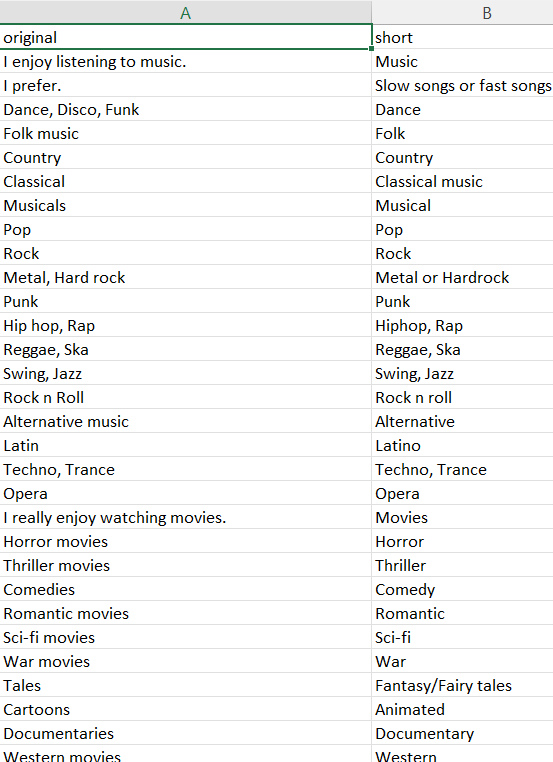
integer and 11 categorical). - For convenience, the original variable names were shortened in the
data file. See the columns.csv file if you want to match the data with the original names. - The data contain missing values.
- The survey was presented to participants in both electronic and written form.
- The original questionnaire was in Slovak language and was later translated
into English. - All participants were of Slovakian nationality, aged between 15-30.
Snippets of the data before data prep:

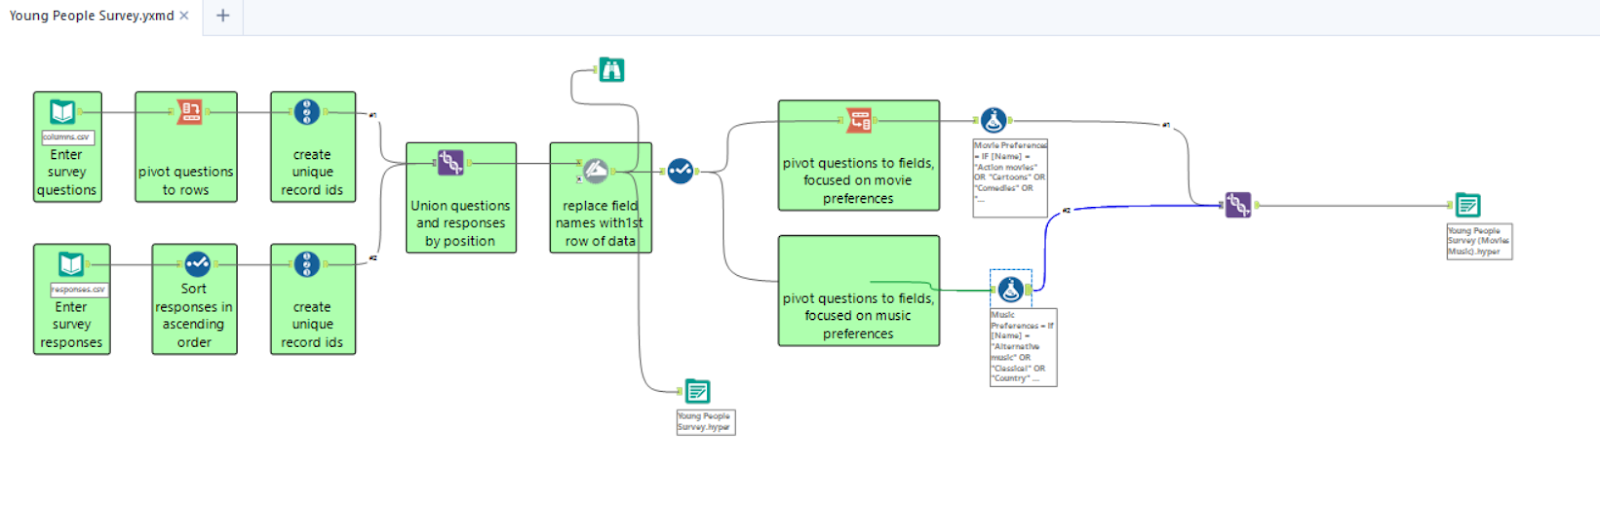
Step 1: Prepare Survey Data in Alteryx

Alteryx Output:

I ended up not liking the direction of the dashboard with the way the data had been grouped/pivoted so I adjusted my Alteryx flow, see below:
Step 2: Wireframe
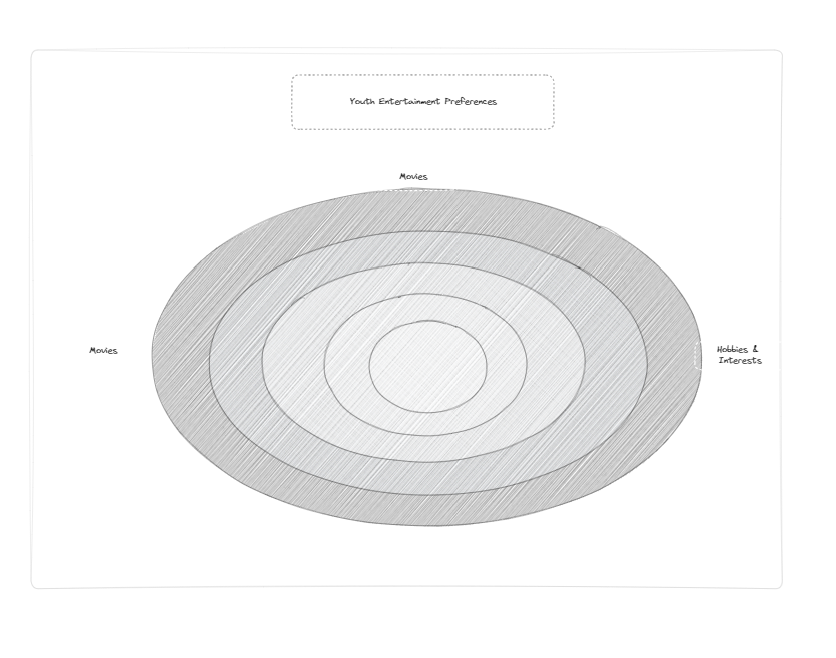
The initial idea for my dashboard was a sunburst chart but that quickly changed as the survey responses did not allow for a dynamic visualization. I switched gears and decided to use a jitter chart to focus on music and movie preferences.
Step 3: The Dashboard (Tableau Public)
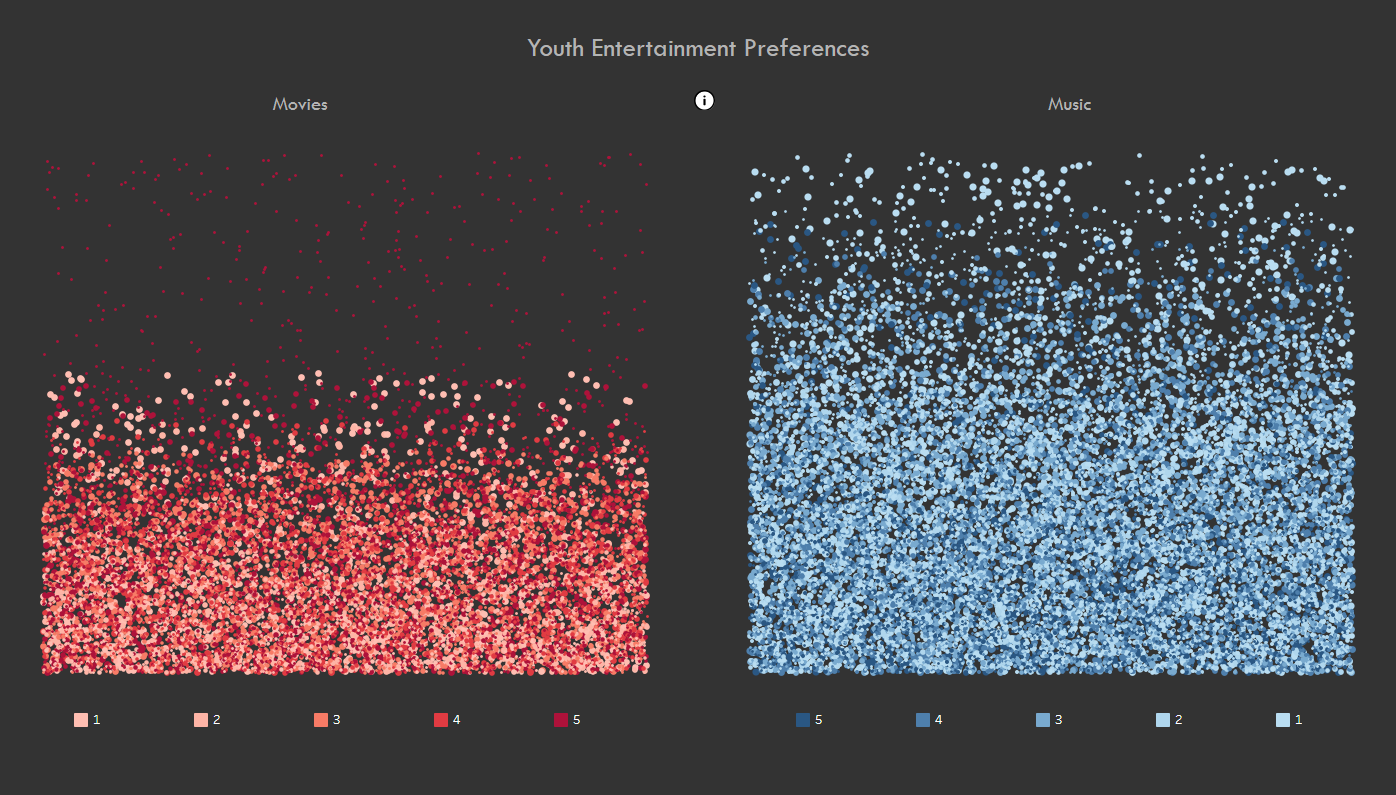
Dashboard week day 2 was fun, I got to create a jitter chart for the first time.