


During our first week of training at The Data School New York, DSNY 4 completed the Preppindata Challenge - 2021 Week 2, we had the task of analyzing bike sales data. The objective was to generate two separate outputs, one focusing on Sales by Brand and Bike Type, and the other on Sales by Brand and Store. Using Tableau Prep, we built a workflow that aggregated the data according to the requirements for each analysis.
The Tableau Prep workflow was designed with two distinct branches, each dedicated to answering a particular question. One branch focused on analyzing sales by store, while the other delved into sales by bike type. By creating these separate flows, we ensured that the data was appropriately organized and aggregated based on the desired dimensions.
This is the final workflow:
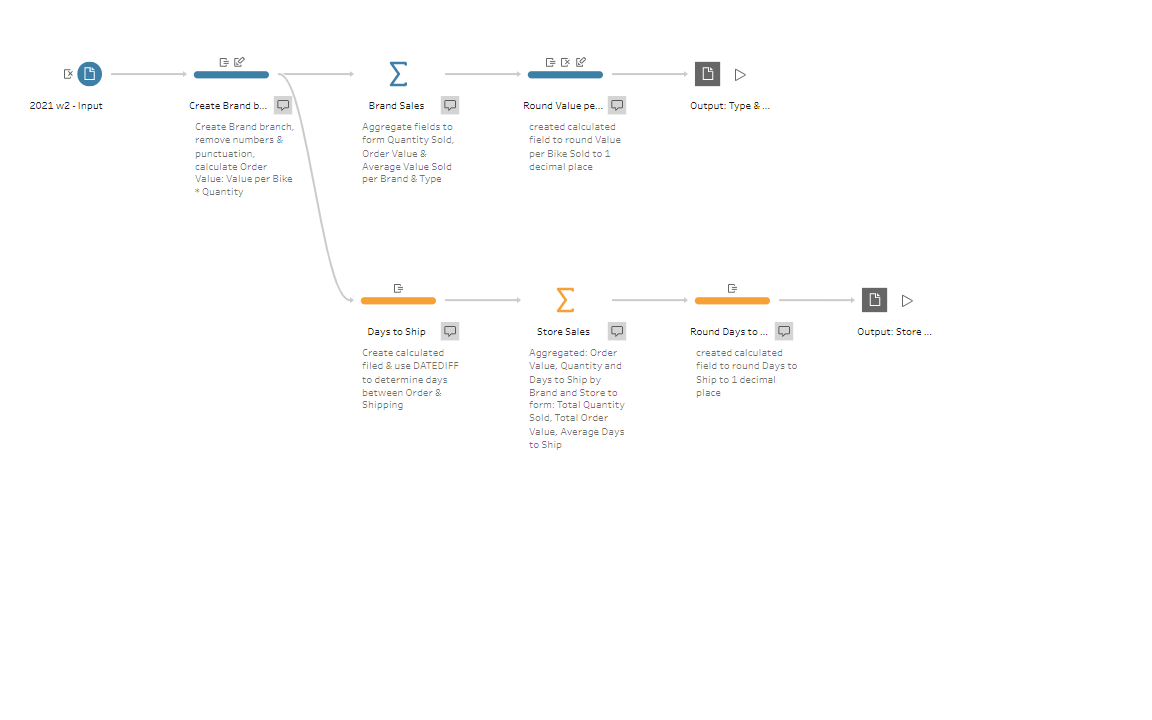
The workflow can be summarized as follows:
- Data Input: We imported the raw bike sales data into Tableau Prep. This included information on brands, bike types, stores, and corresponding sales figures.
- Branch 1: Sales by Brand and Bike Type: In this branch, we cleaned, filtered, and grouped the data to calculate the Order Value, Total Sales, and Average Value per Bike Sold for each brand and bike type combination. By aggregating the data at this level, we gained insights into which brand and bike type combinations were the most popular by sales.
- Branch 2: Sales by Brand and Store: Moving to the second branch, we focused on sales by brand and store. Here, we determined the number of days it took for an order to ship (Days to Ship) and aggregated the data to determine the Total Order Value, and Total Quantity Sold for each brand and store pairing. This analysis shed light on the performance of each brand across different store locations.
- Data Output: Our analysis resulted in two separate outputs, each formatted to allow for easy analysis and visualization using Tableau Desktop. These outputs provide a comprehensive overview of sales by brand and bike type and sales by brand and store.
The Preppindata Challenge - 2021 Week 2 gave us the opportunity to explore and execute the functionalities in Tableau Prep. We were able to create a well-structured workflow and successfully generated two outputs full of insights that enable us to analyze and visualize bike sales data accurately in Tableau Desktop.
You can practice similar challenges on the Preppindata Challenge website here.