Early on in our Tableau training, we were introduced to the concept of wireframing, a technique that lays the foundation for your final visualization. Our coach has nicknamed it Paper Tableau, I immediately thought of Paper Mario. This is a version of the popular Nintendo role-playing and action-adventure series of the Super Mario which has a distinctive visual style, which consists of 2D paper cutout characters in 3D papercraft environments.
In the world of data visualization, the adage "a picture is worth a thousand words" couldn't be more accurate. Crafting effective and impactful visualizations is an art that requires a well-structured design process. One crucial step in this journey is wireframing. When creating visualizations in Tableau, Excalidraw emerges as an indispensable tool, allowing users to refine their concepts and streamline the development process.
Wireframing serves as the blueprint for your visualization, defining the layout, structure, and interactions before diving into the nitty-gritty details and technical aspects of Tableau. Excalidraw is a versatile online whiteboard tool with a user-friendly interface and flexibility. It offers a seamless platform to sketch out your ideas, enabling you to visualize the arrangement of various elements on your Tableau dashboard.
There are many advantages of incorporating Excalidraw into your Tableau design process. Excalidraw’s simplicity fosters quick iterations, allowing you to experiment with different layouts and arrangements. The drag-and-drop functionality ensures that you can easily reposition components, gauge their impact, and optimize the user experience.
Excalidraw also encourages collaborative design discussions. Whether working with team members on a project or engaging with stakeholders in real time, Excalidraw allows you to implement immediate feedback and align with the vision of the user. This collaborative environment eliminates misunderstandings early in the process, ensuring a more refined and accurate visualization later.
By wireframing with Excalidraw, you can prioritize the distribution of information effectively. You'll be able to define the placement of charts, filters, and other interactive elements in Tableau, ensuring a coherent narrative and enhancing the user's understanding of the data.
Transitioning from Excalidraw to Tableau is also very smooth. With a well-structured wireframe in hand, you can focus on translating your design into reality without getting bogged down in the tool's intricacies. It also helps with outlining how containers will be laid out in your Tableau Dashboard. This efficient workflow accelerates the development process, leading to quicker turnaround times and more timely insights.
By leveraging the power of Excalidraw, you'll embark on a journey to craft captivating and insightful Tableau visualizations that make data come alive. Here are a few examples of wireframing in Excalidraw.
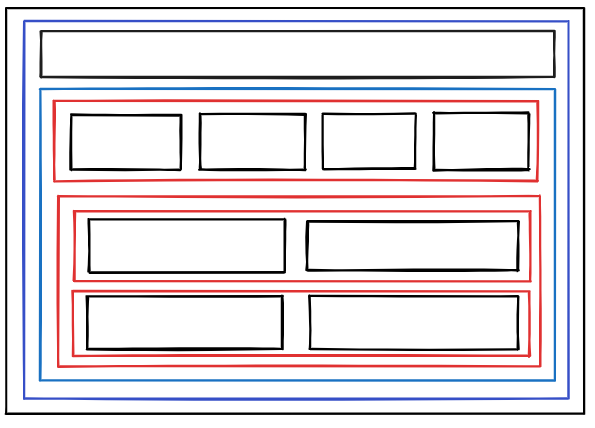
Visualizing containers in Tableau:
Early design template:

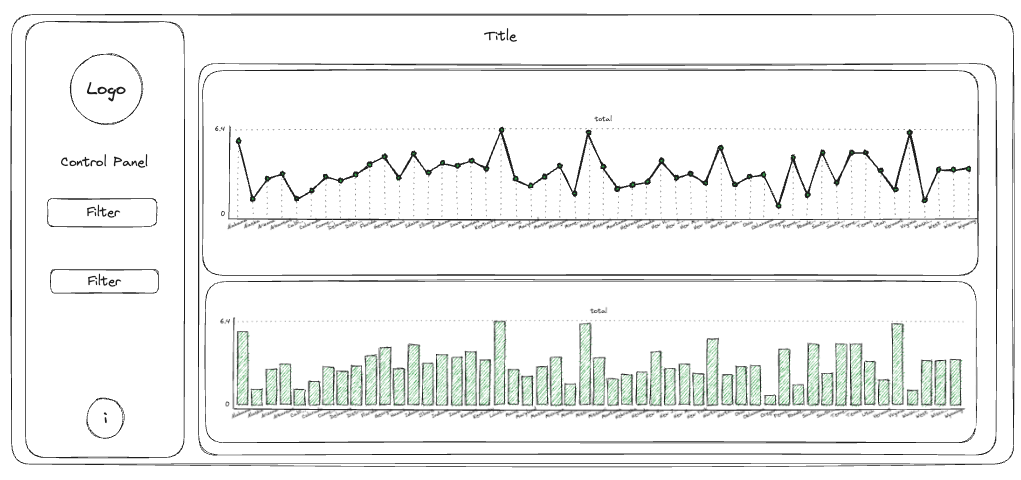
Tableau dashboard template:
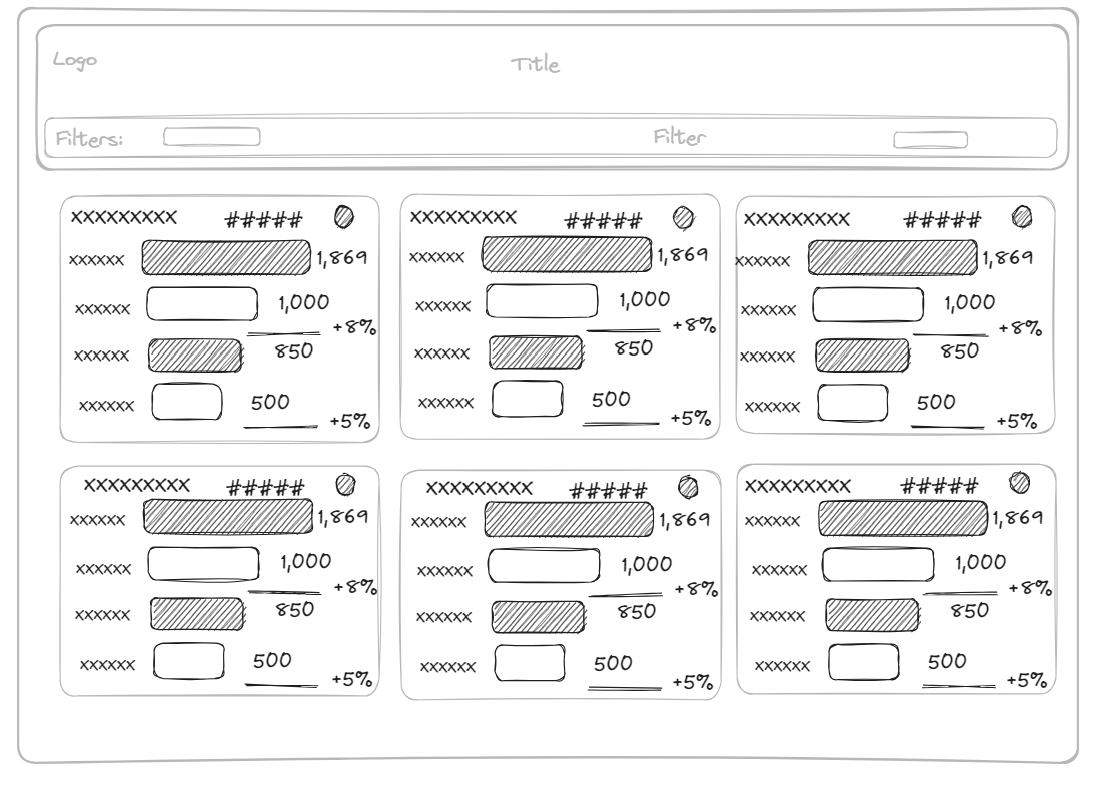
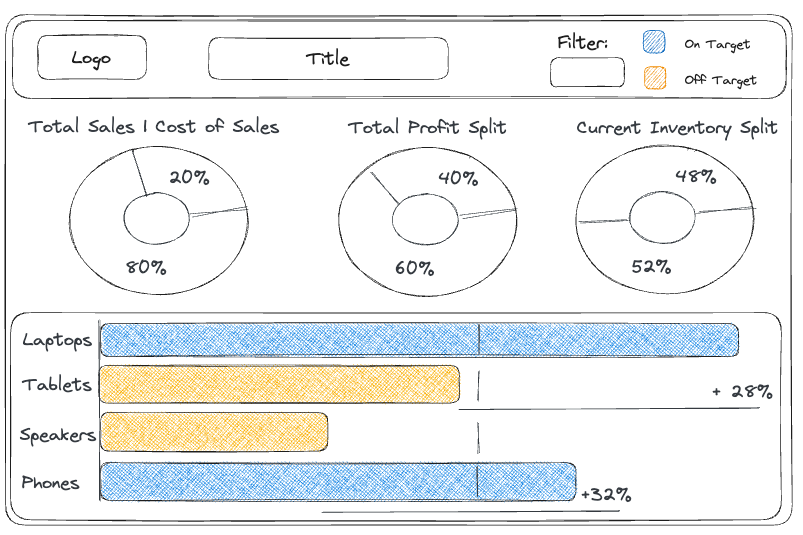
Chart preview:
Refining a dashboard: