


On the last day of Dashboard Week, we were given the task of creating a Tableau Dashboard using inspection data from NYC Open Data for cafeterias permitted in public, private, and parochial schools in NYC.
Overview of the Dataset from NYC Open Data: (https://data.cityofnewyork.us/Health/DOHMH-School-Cafeteria-inspections-2020-Present-/5ery-qagt ):
The dataset was broken down as follows:

Data Extraction and Cleaning:
NO DATA PREP!!!!
Design and Wireframing:
I began the design process by creating a wireframe to get my ideas onto the screen before diving into Tableau Desktop. My initial idea for a design was to focus on the distribution of inspection violations across the five boroughs in New York.
A screenshot of my wireframe can be seen below:

Dashboard Creation
Leveraging the wireframe as a guide, I crafted the final dashboard using Tableau Desktop. My focus for the Dashboard had been cemented from the wireframe.
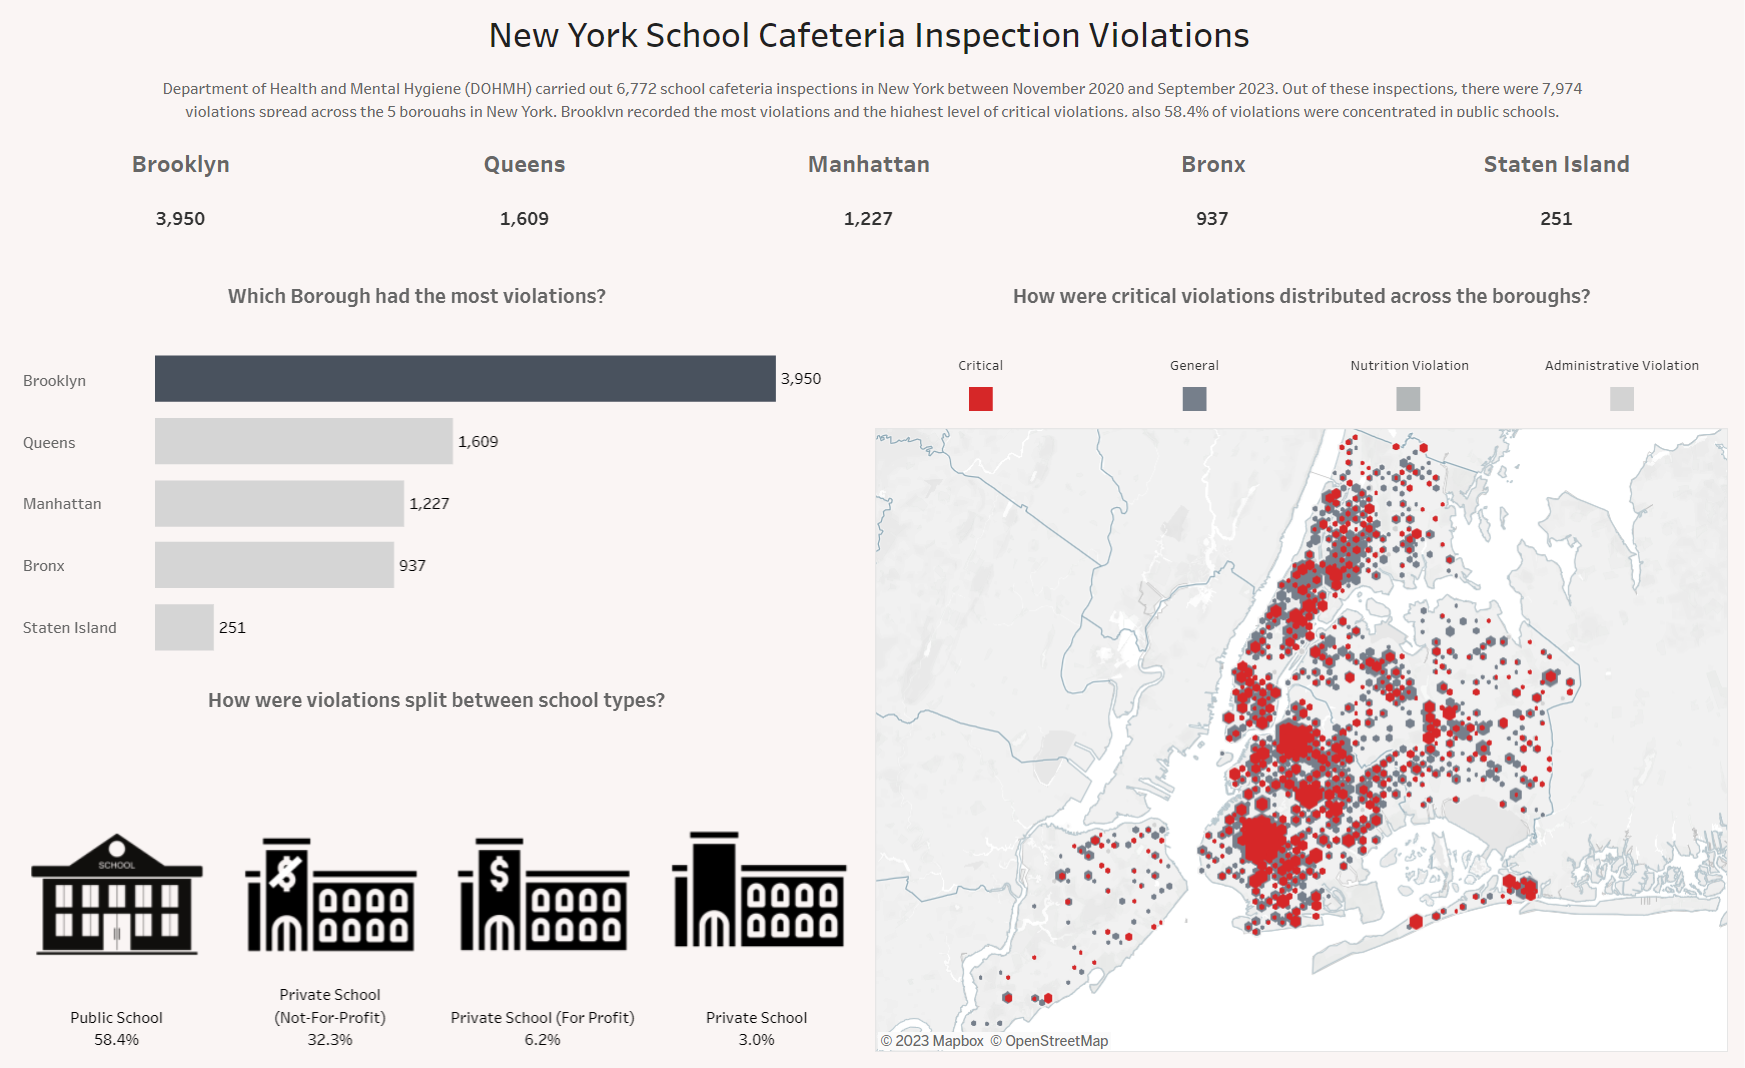
You can see the dashboard on Tableau Public here: https://public.tableau.com/app/profile/mbellamybb/viz/NewYorkSchoolCafeteriaInspections2020to2023/Dashboard1?publish=yes