


On the fourth day of Dashboard Week, we were given the task of creating a Tableau Dashboard using statistics for the top 10 songs (as of February 7, 2023) of various Spotify artists and their YouTube videos.
Overview of the Dataset from Kaggle (https://www.kaggle.com/datasets/salvatorerastelli/spotify-and-youtube ):
The dataset consisted of songs of various artists in the world and for each song there are:
- Several statistics of the music version on Spotify, including the number of streams;
- Number of views of the official music video of the song on YouTube.
It includes 26 variables for each of the songs collected from Spotify. These variables are:
- Track, Artist, Url_spotify, Album, Album_type, Uri, Danceability, Energy, Key, Loudness, Speechiness, Acousticness, Instrumentalness, Liveness, Valence, Tempo, Duration_ms, Stream, Url_youtube, Title, Channe, Views, Likes, CommentsDescription, Licensed, official_video.
Data Extraction and Cleaning:
Minimal data prep...
Design and Wireframing:
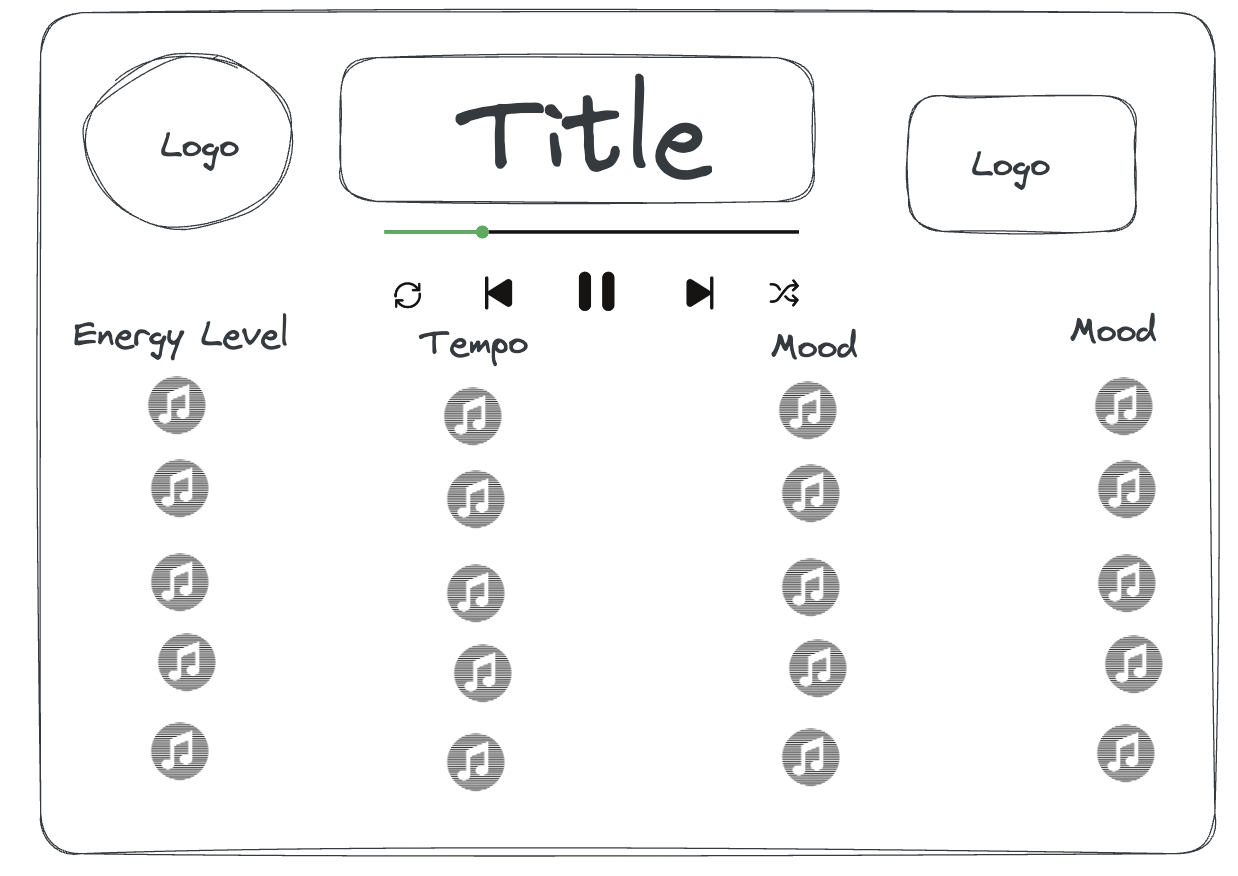
I began the design process by creating a wireframe to get my ideas onto the screen before diving into Tableau Desktop. My initial idea for a design was to focus on how different elements such as energy, tempo, and valence impacted how a playlist could be created for different segments of a day as a Data Analyst. That design idea was out of scope for this task so I decided to focus on designing a Dashboard that allowed Data Analysts to curate a playlist for each step of the data preparation process based on their energy level, the tempo of the music, and the mood.
A screenshot of my wireframe can be seen below:
Dashboard Creation
Leveraging the wireframe as a guide, I crafted the final dashboard using Tableau Desktop. My focus for the Dashboard had been cemented from the wireframe and I decided to title the Dashboard “Curate a Playlist for Your Data Prep Session”.
The Data prep session is broken down into 4 sections:
- Data Discovery - with the option to choose your energy level to filter the songs displayed,
- Data Exploration - with the option to choose your tempo to filter the songs displayed
- Data cleaning - with the option to choose your mood to filter the songs displayed
- End of Data Prep - with the option to choose your level of elation to filter the songs displayed
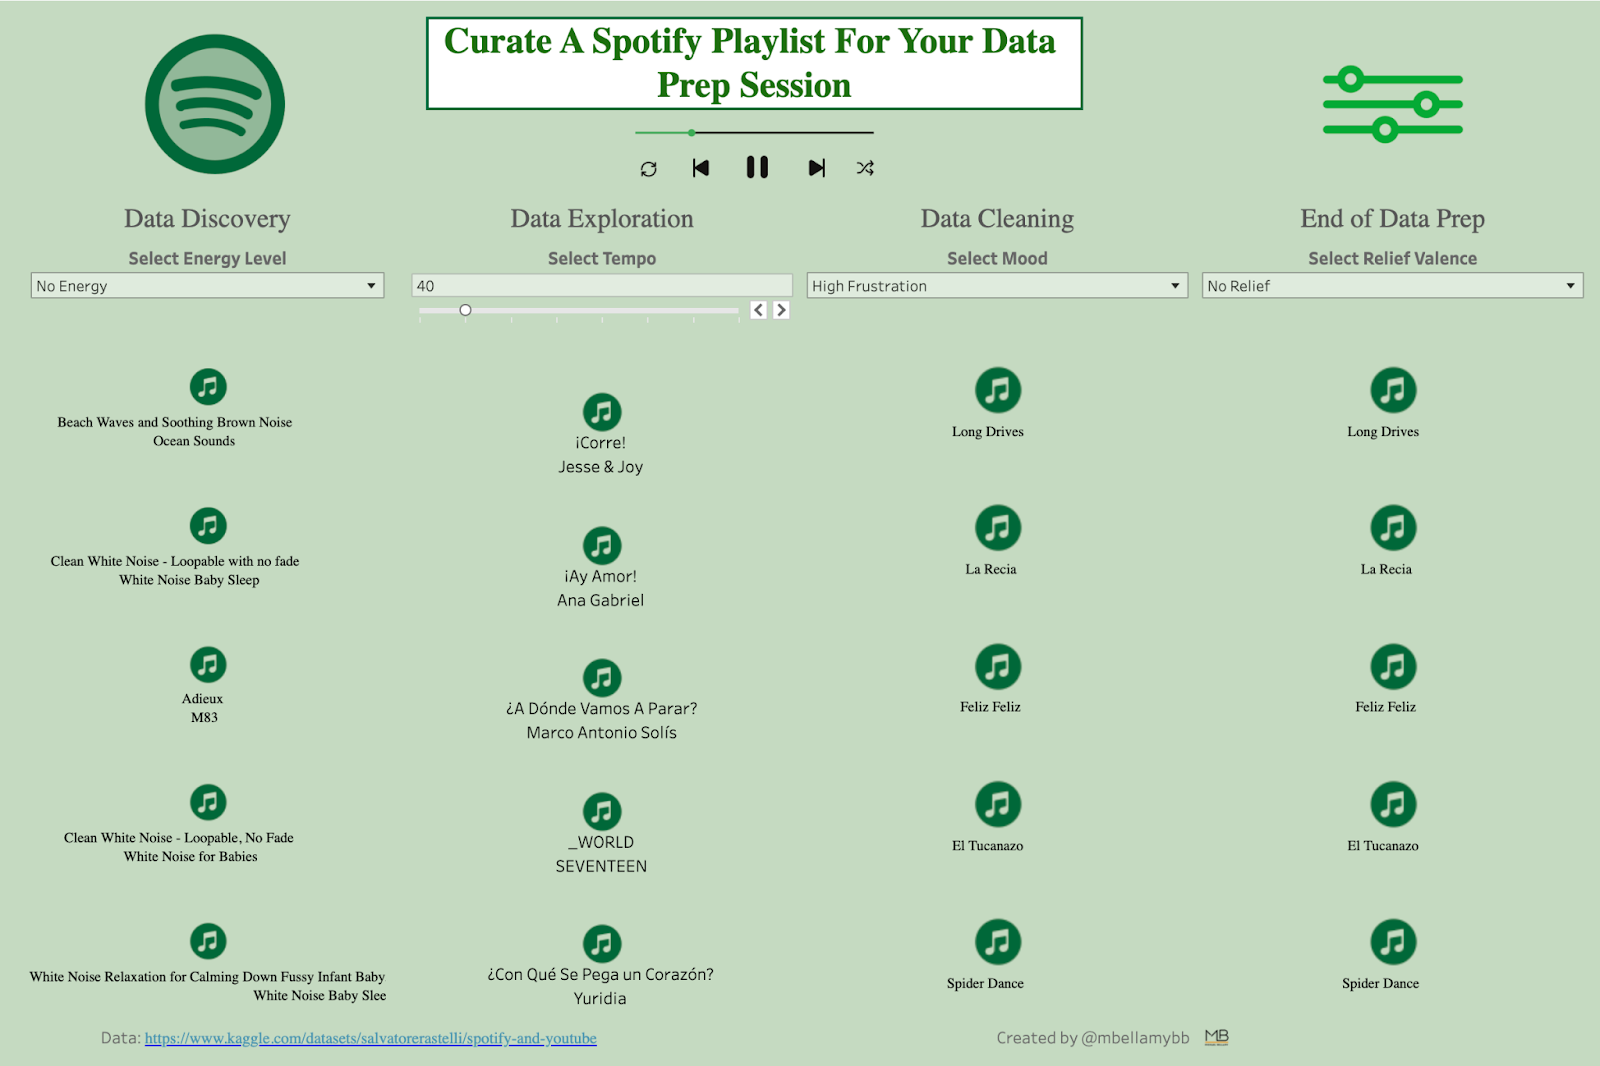
You can see the dashboard on Tableau Public here: Tableau Public