


During the first day of Dashboard Week, the task laid out for us involved the extraction of performance-related data for German Bundesliga teams across a span of 20 seasons from the official Bundesliga website.
Data Extraction and Cleaning:
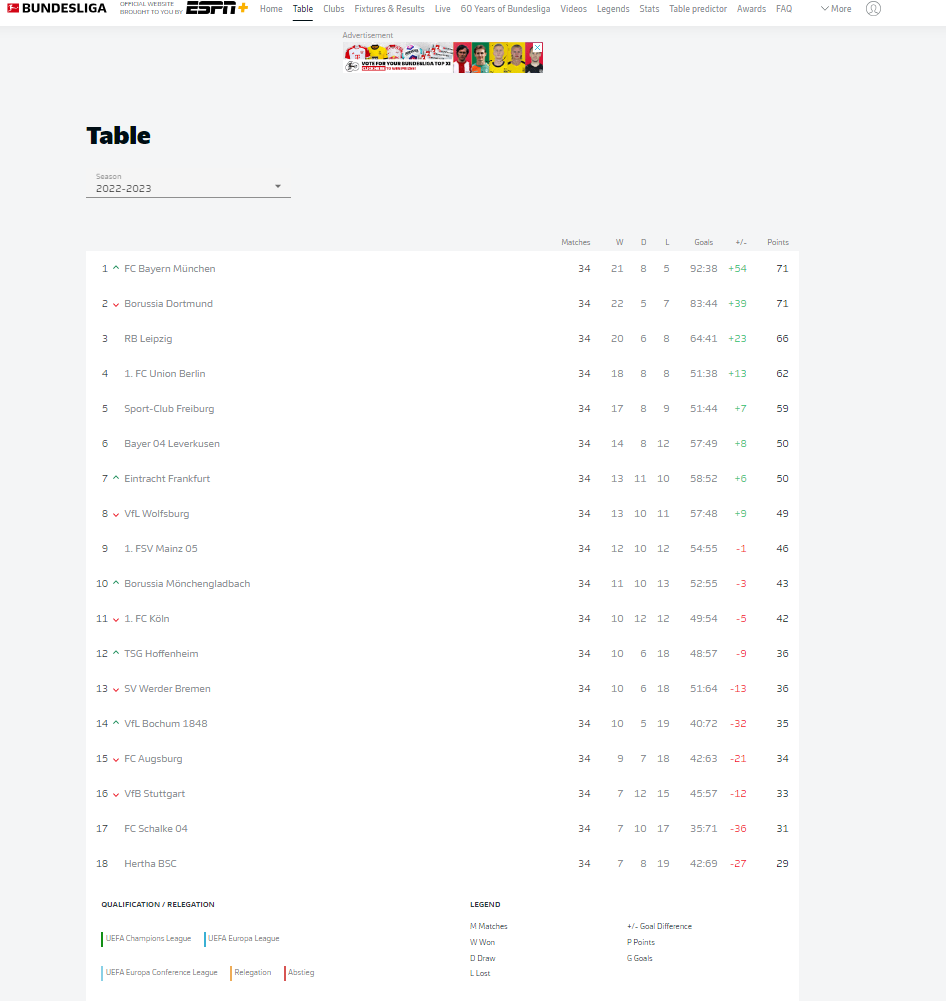
In the initial step, my focus was on web scraping the German Bundesliga website to gather information regarding team performance over two decades. This data served as the basis for my analysis and visualization efforts.
Take a look at the website here: https://www.bundesliga.com/en/bundesliga/table
Alteryx Data Prep & Web Scrapping:
I utilized Alteryx for the web scrapping and data extraction portion of this project. In addition, Alteryx was used to streamline and cleanse the obtained dataset. This step ensured that the data was structured and ready for integration into Tableau Desktop for the creation of the dashboard.
Below is a snapshot of my Alteryx flow, the steps involved were:
- Downloading the data using the Input tool with the website URL, then downloading the HTML using the Download tool.
- Using the Text Input tool containing the 20 years of Bundesliga seasons in the format on the website and using the Append tool to add an additional field with this information
- The Formula tool was then used to make a full URL for each season being examined and then the Download tool was used to download a web page for each season.
- The Regex tool to extract the league winner for each season
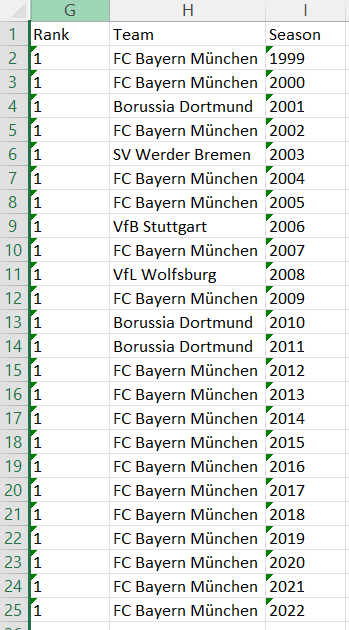
- Finally, I used a Select tool to clean up some fields and remove any unnecessary fields the Formula tool to create a field for the year of each Bundesliga season, and the Output tool to output the data as an Excel file.

Alteryx Output:
Design and Wireframing:
I then began the design process by creating a wireframe to get my ideas onto the screen before diving into Tableau Desktop.
A screenshot of my wireframe can be seen below:

Dashboard Creation
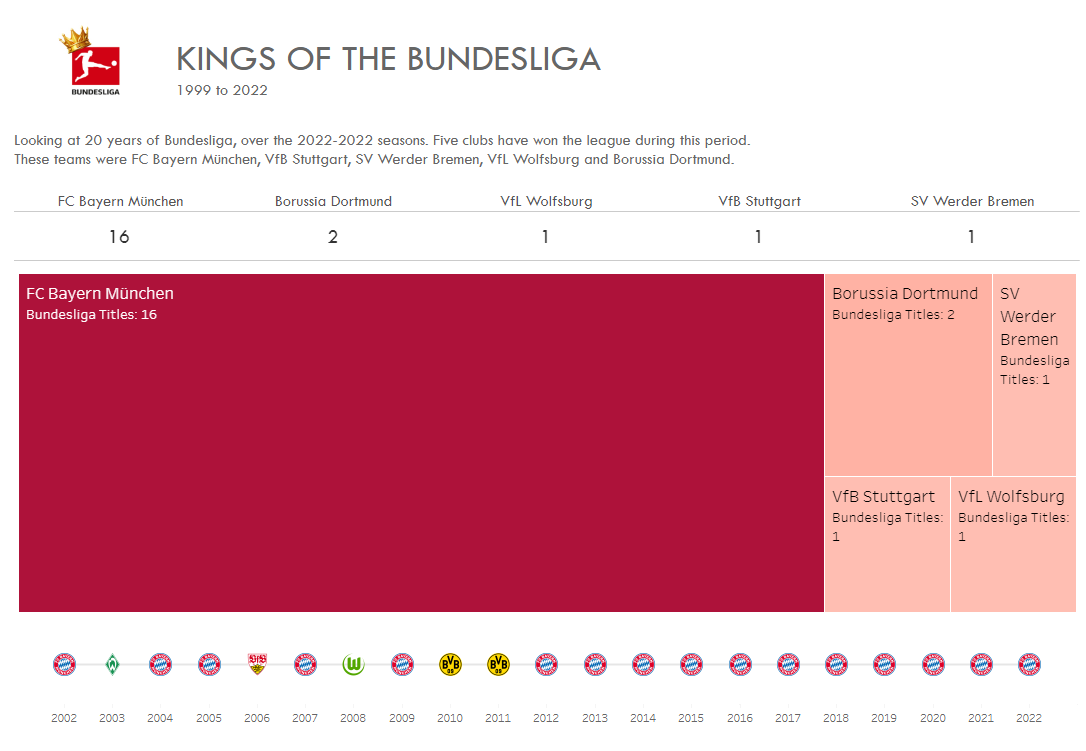
Leveraging the wireframe as a guide, I crafted the final dashboard using Tableau Desktop. My focus for the Dashboard was on the title winners of the German Bundesliga over the past 20 years. I found that between the 2002 and 2022 seasons, there were five clubs have won the league during this period.
These teams were FC Bayern München, VfB Stuttgart, SV Werder Bremen, VfL Wolfsburg and Borussia Dortmund.
Here is a snapshot of the Tableau Dashboard:
You can see the dashboard on Tableau Public here: Tableau Public
Challenges Encountered:
During this project, I encountered hurdles in the web scraping process, requiring a few attempts to extract the desired data accurately. The initial challenges were eventually overcome with the aid of Regrex 101 ( https://regex101.com/ ), a valuable resource that helped in refining the scraping process through effective Regex expressions.
In retrospect, the first day of Dashboard Week presented its share of challenges, particularly with web scraping and data extraction. However, I was pleased with the resulting dashboard and the meeting of the requirements of the project.