I recently bumped into a tableau problem which explicitly needed to use Table Calculations in answering these three questions using Superstore data.
Q1: How many sub-categories in each region had sales above a certain threshold?
Q2. What is the total sales for those sub-categories in Q1 per region?
Q3. What is the % of total sales for those sub-categories in Q1 per region?
This activity could have been easily solved with LOD's but due to the restriction to use Table Calculations, it took me a while to solve it; the essence of sharing.
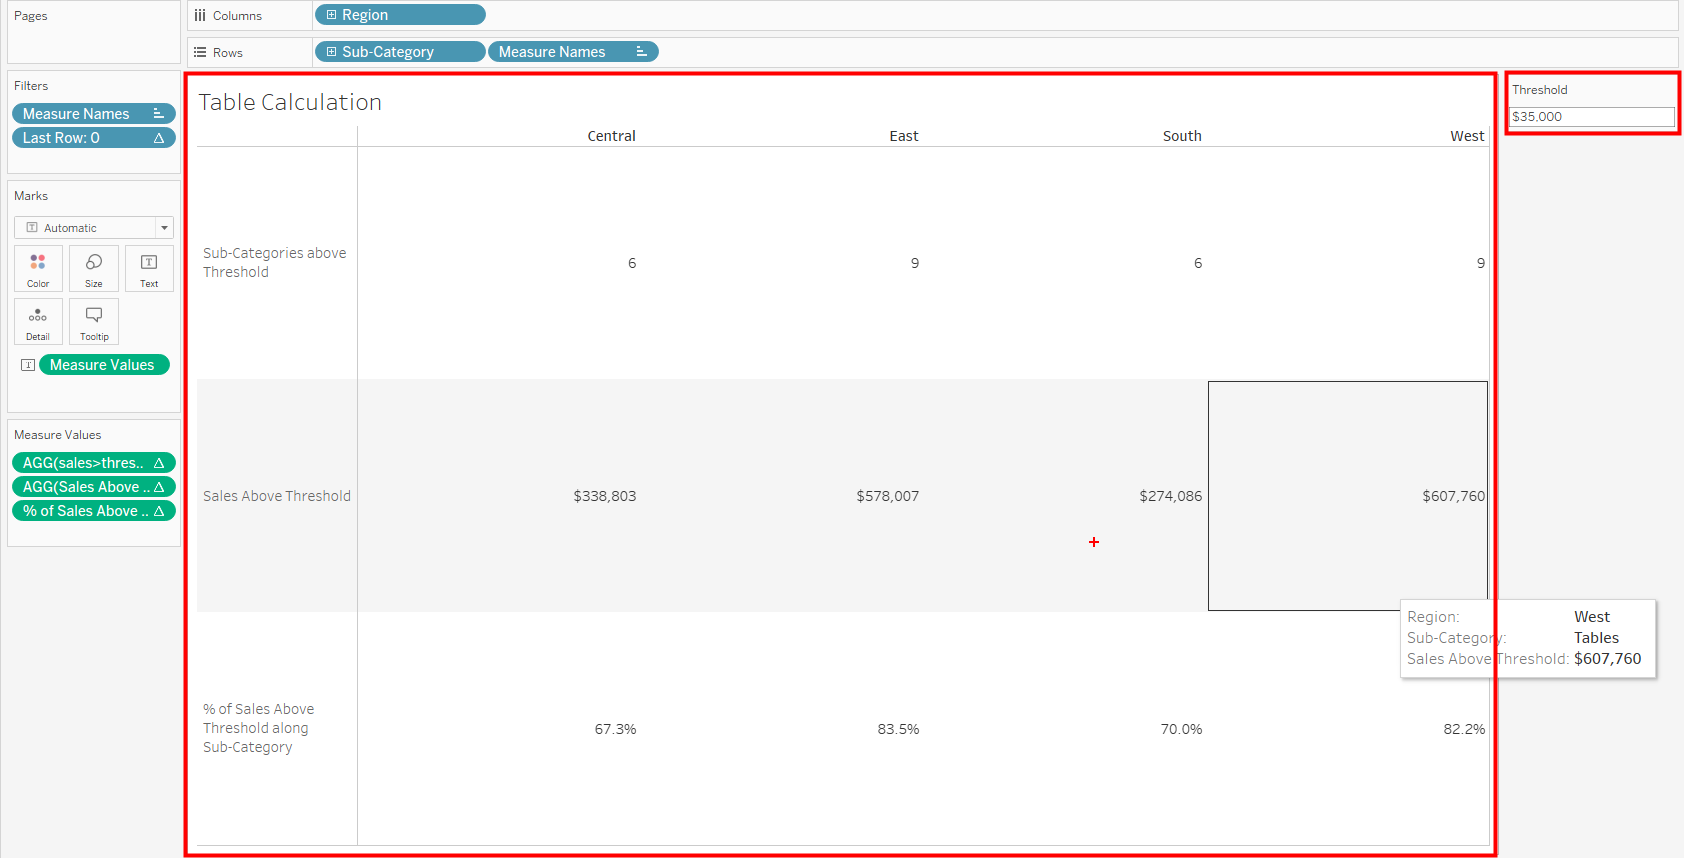
The final output was supposed to be in this form:

To do this, I first brought on my two dimensions and measure unto the view. Sub-categories on row, regions on column and sales unto text.
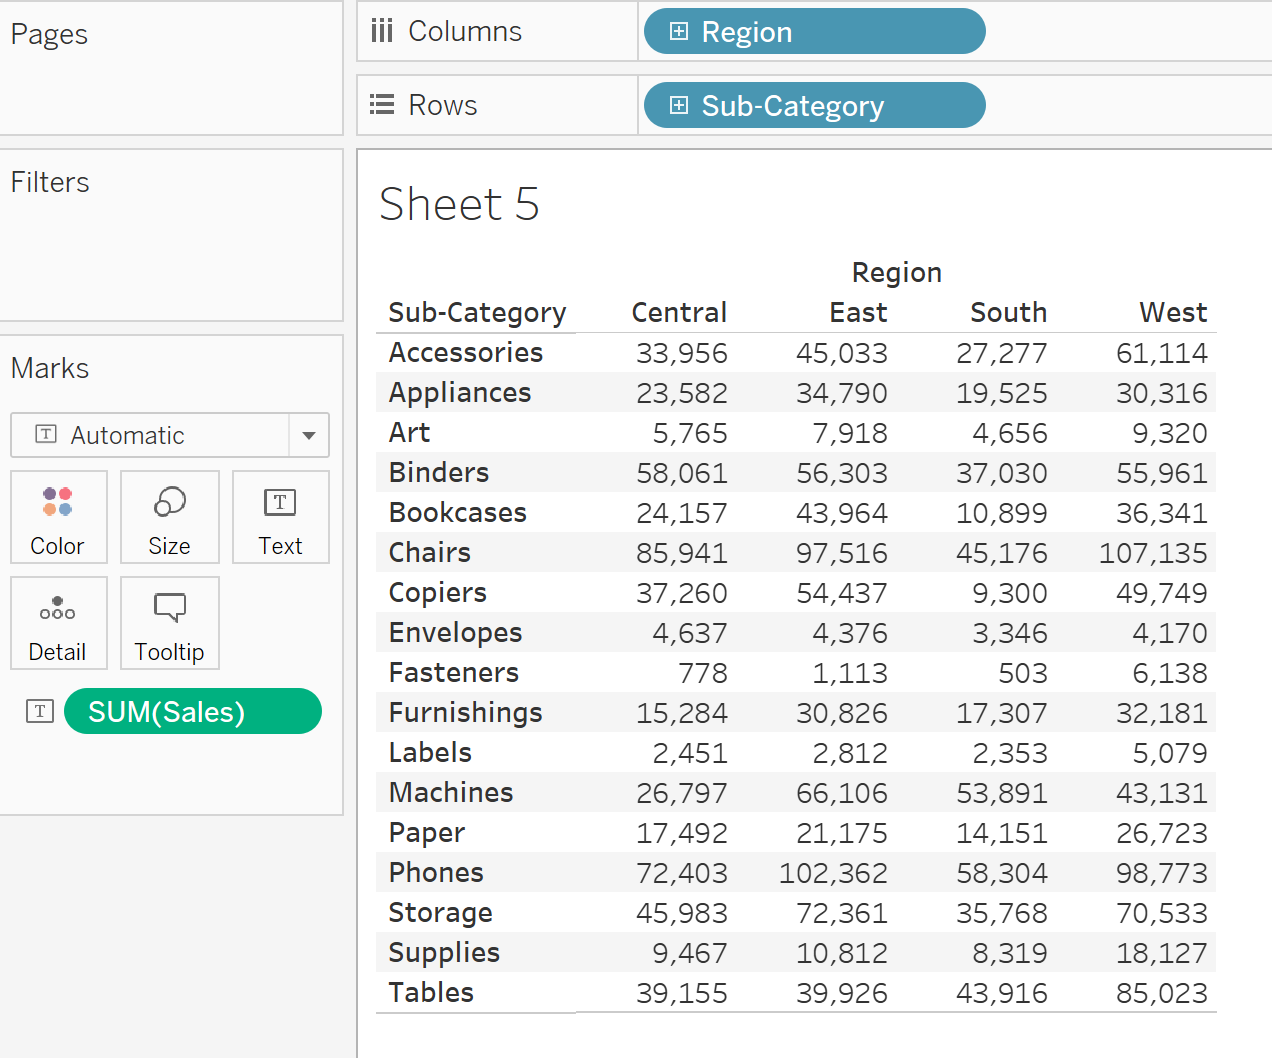
Next I created a threshold parameter which would help switch the threshold at any point in time. Click on the dropdown and select create parameter which brings up the Parameter window.
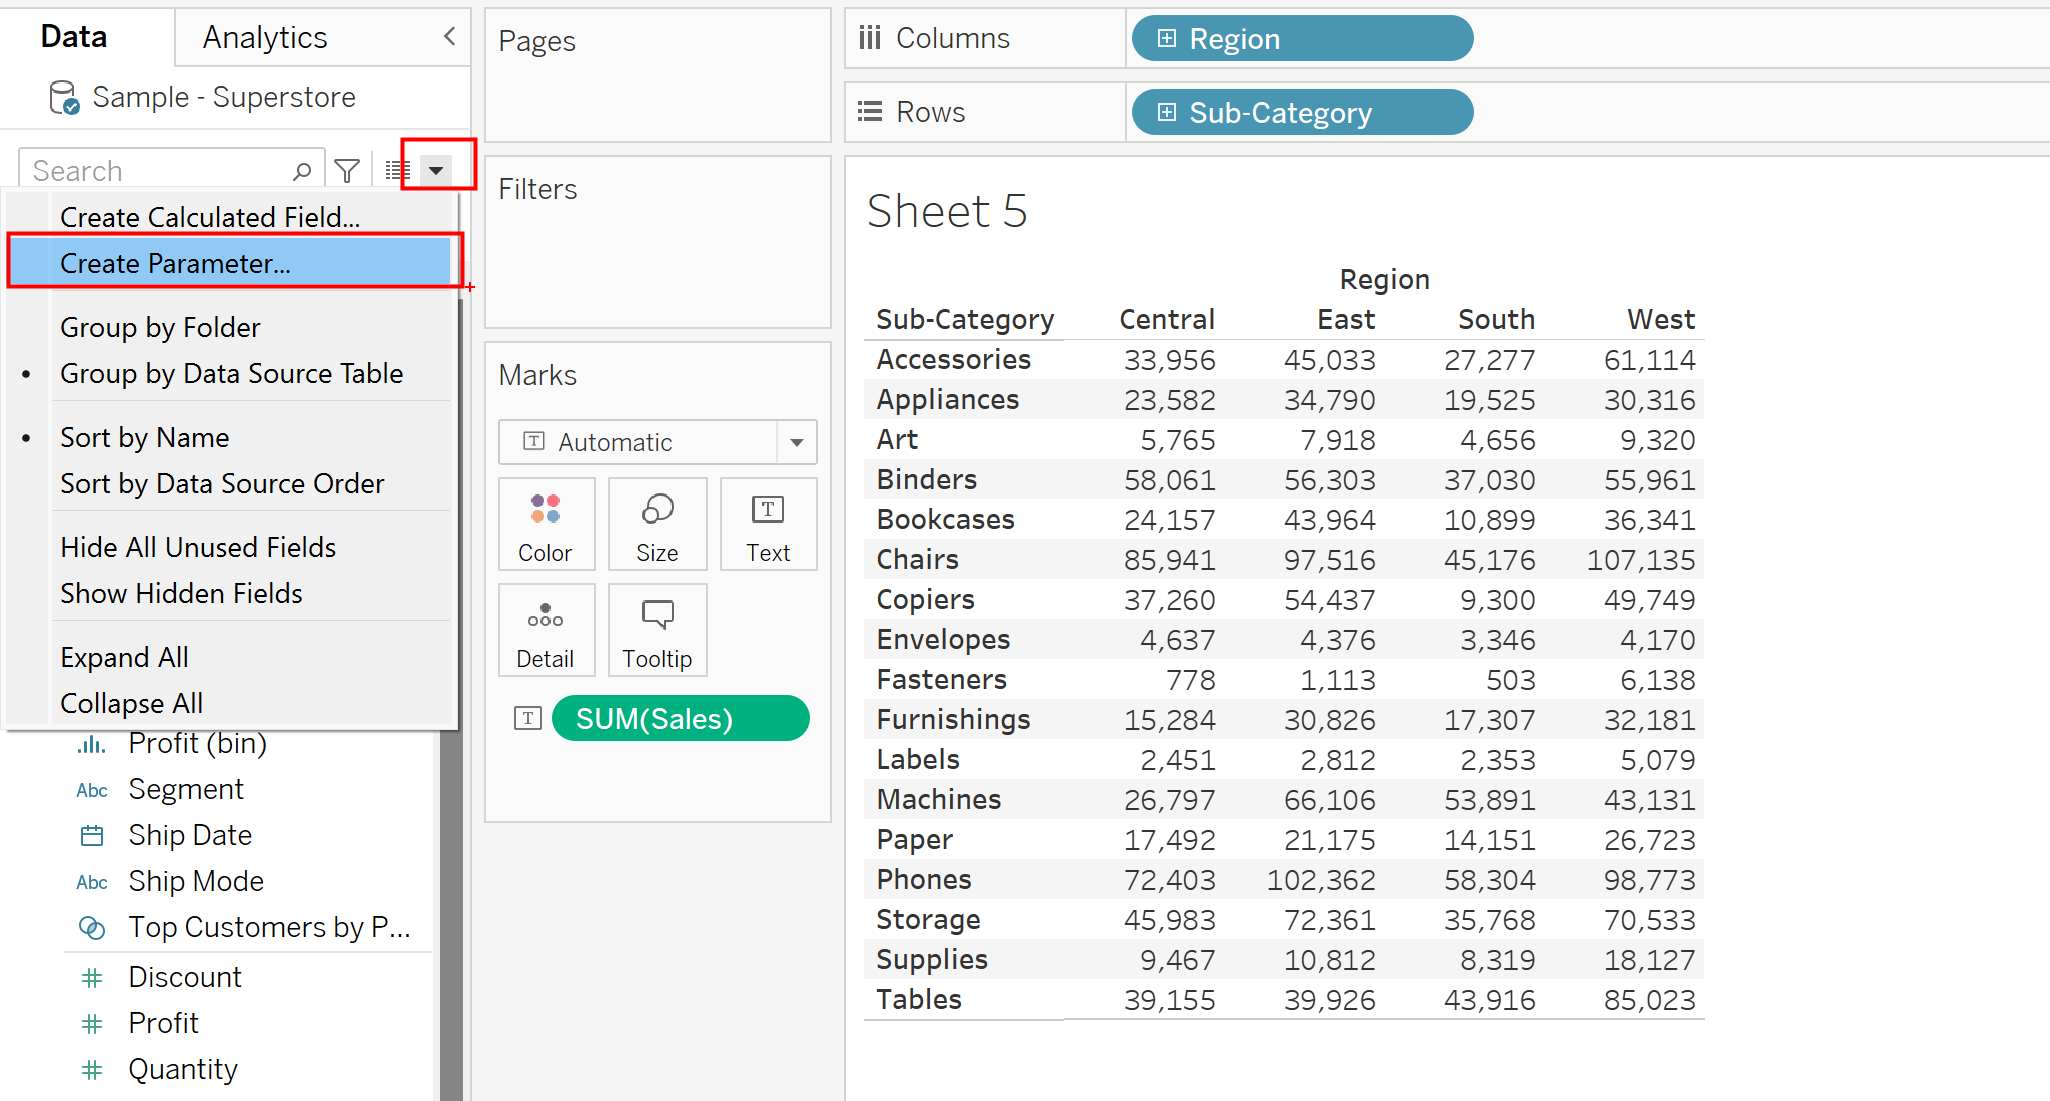
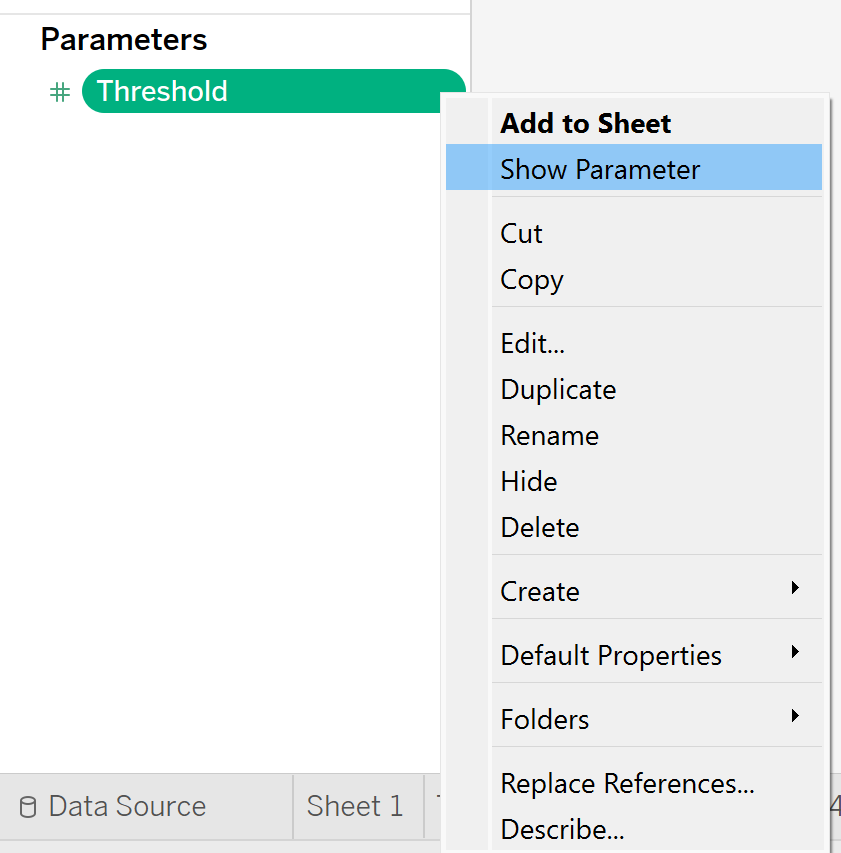
In the Parameter window, give it a name, set data type to integer, set current value to 25,000 and customize display format using $ as a prefix and setting decimal places to 0. Lets show Parameter after creating it.
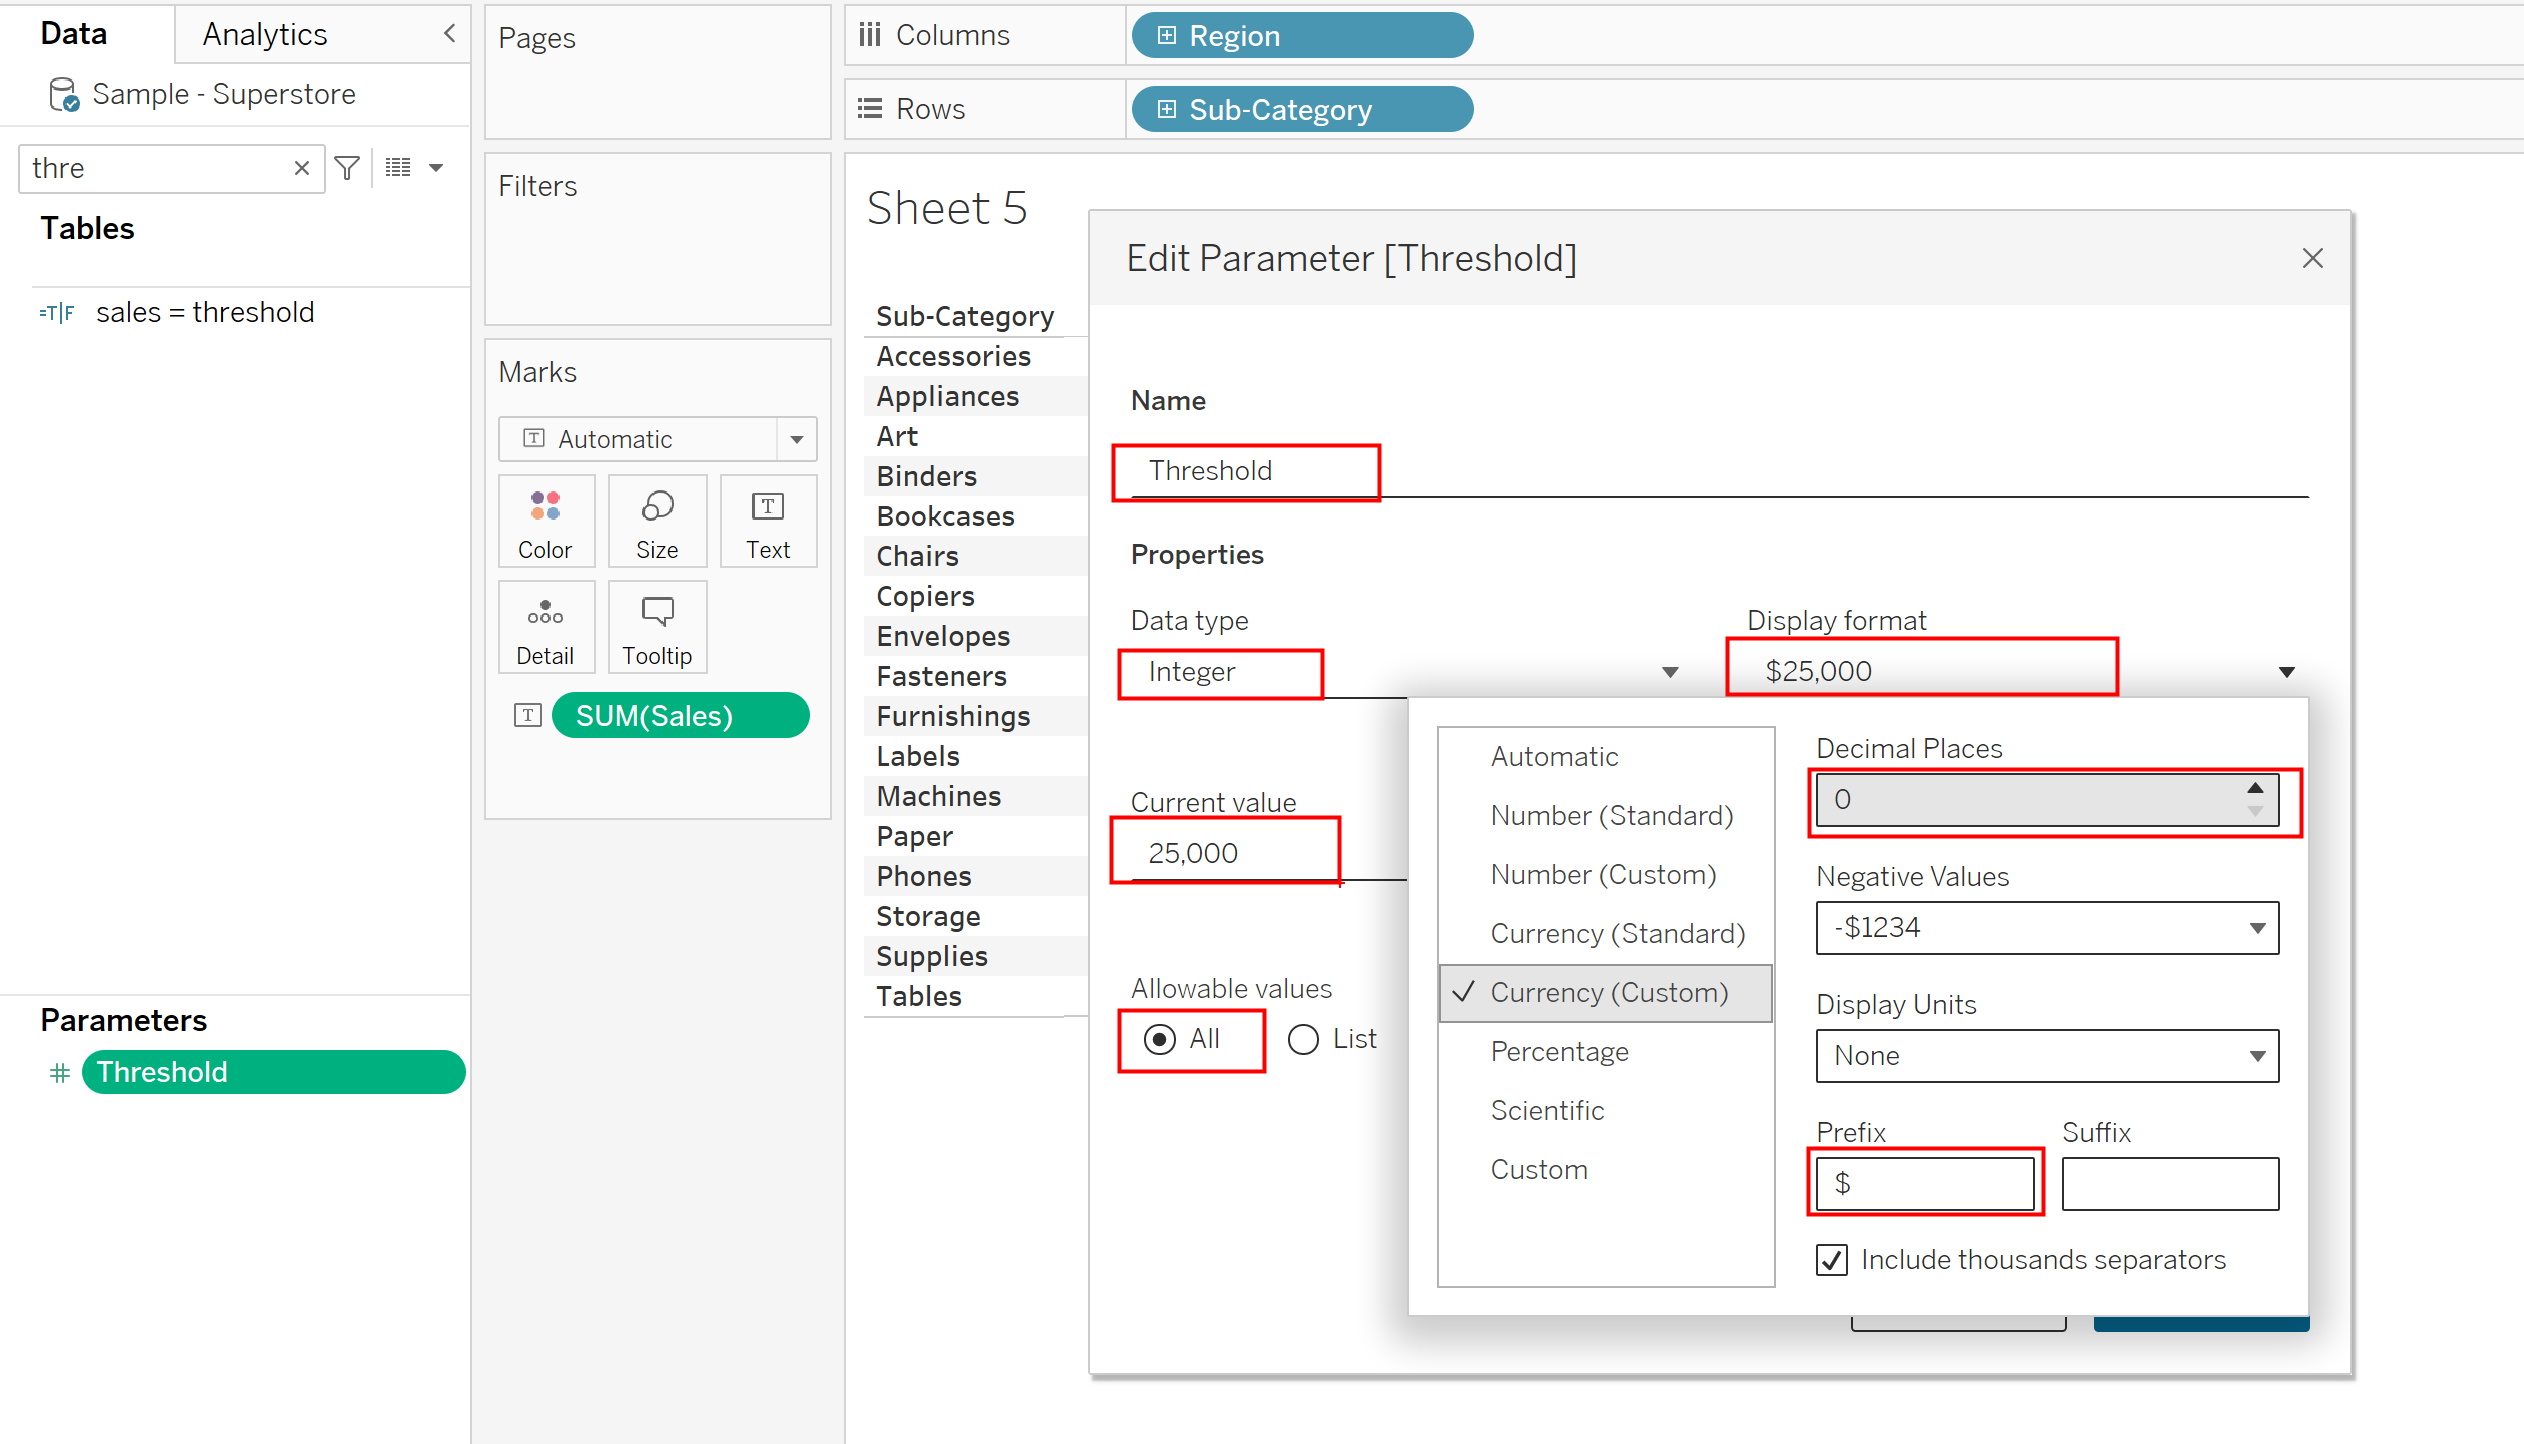
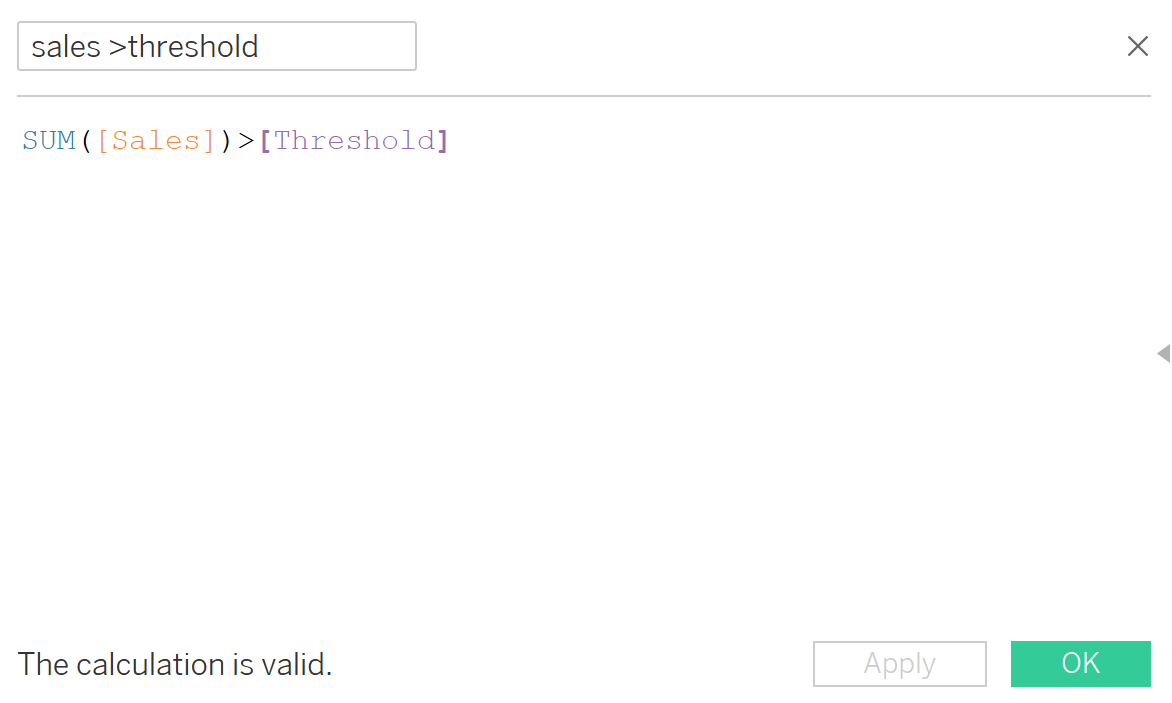
The parameter does nothing unless it is linked to the viz in a way. This time we create a Boolean calculation which tests for all sub-categories with sales greater than the threshold per region and click ok. Lets call the calculation sales > Threshold.
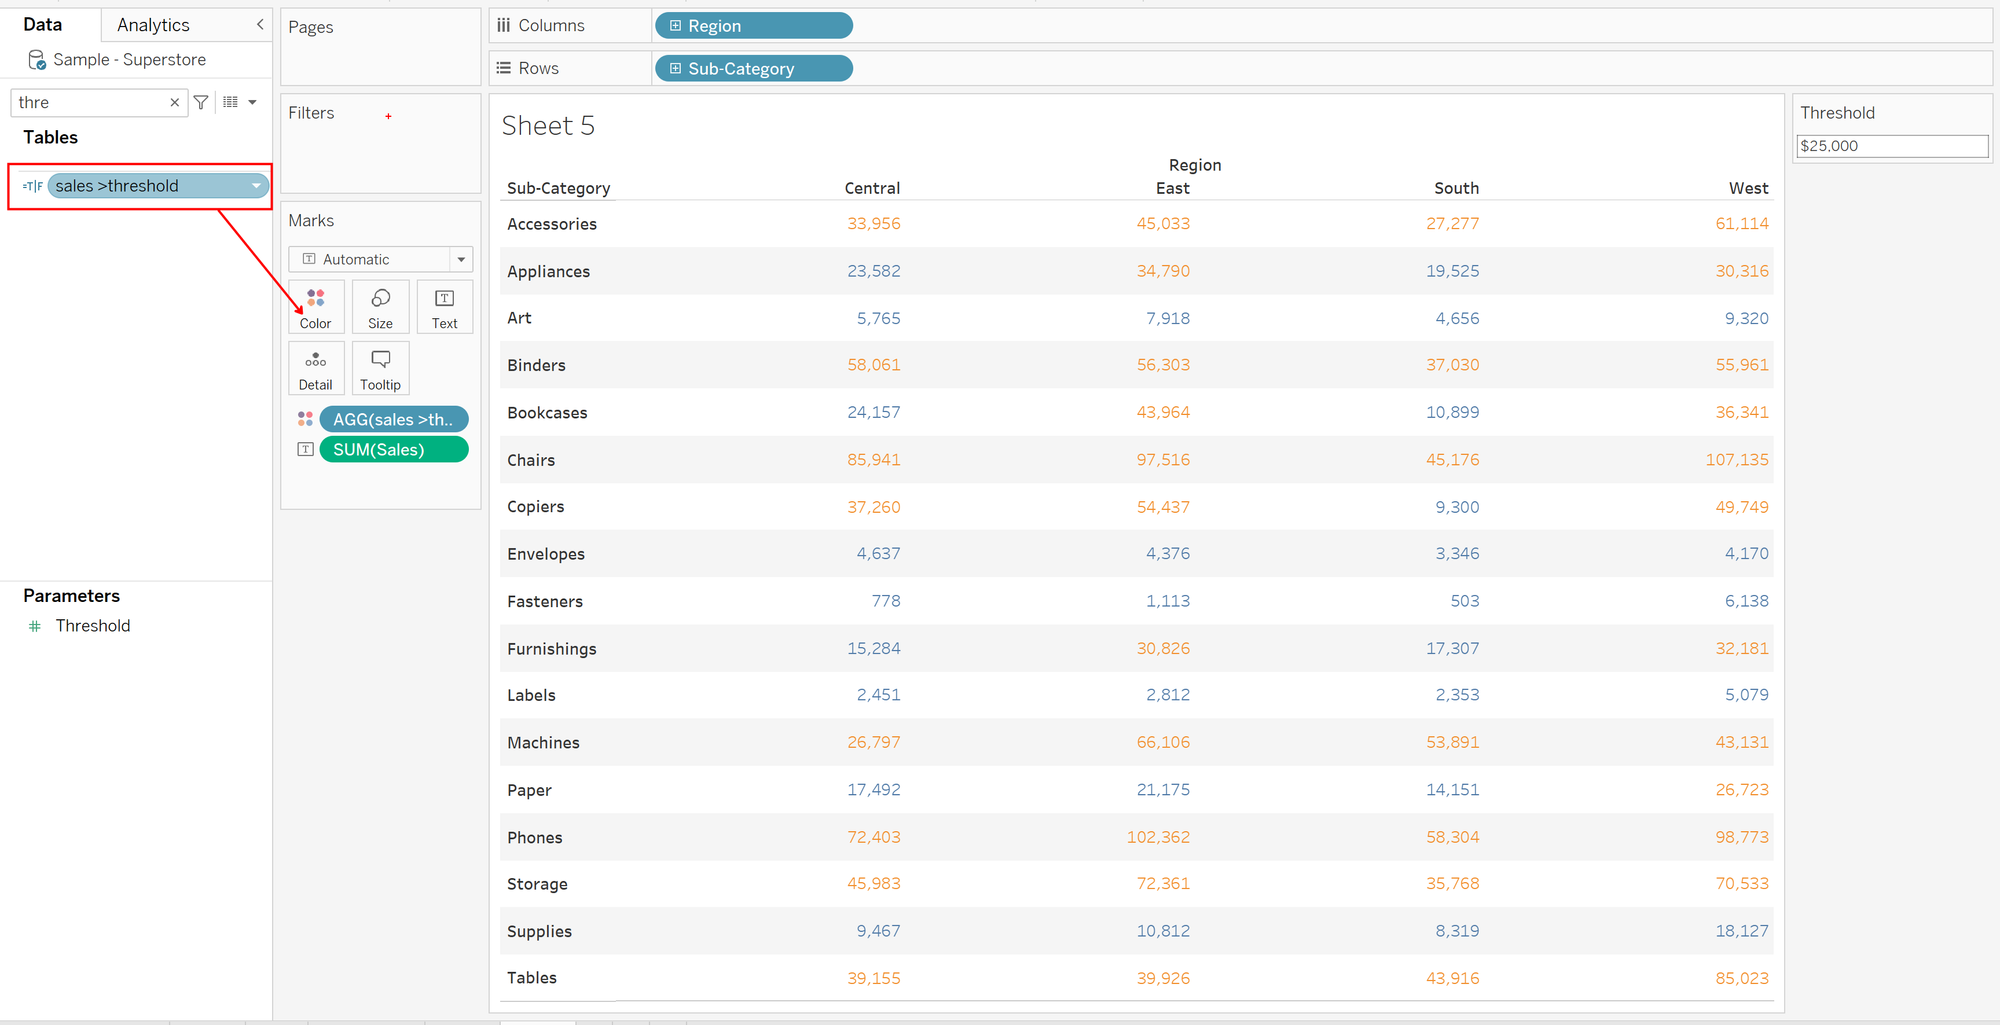
Dragging this calculation unto color will show two colors: blue=false and orange=true.
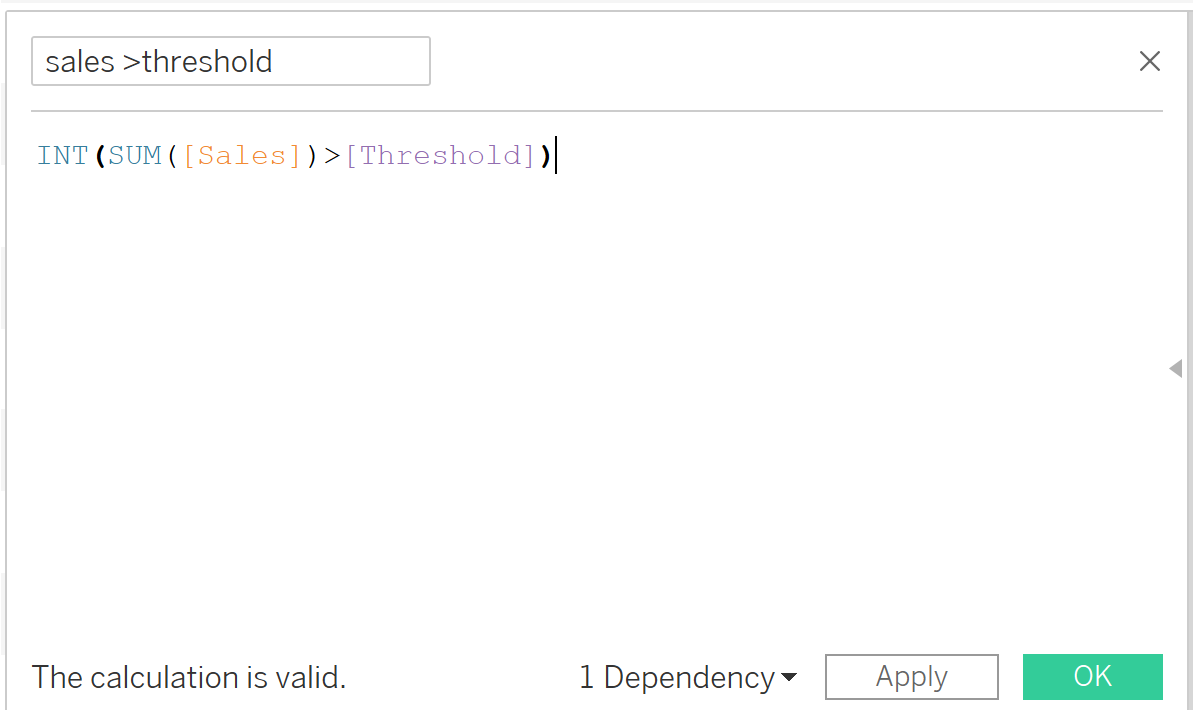
Since an indication of above or below threshold has been made through this Boolean calculation, we can wrap the whole calculation in an INT function which then converts our TRUE to 1 and our False to 0. This changes our data type from Boolean(T/F) to a whole number (#).
Take off the calculation from color and convert the altered calculation from discrete to continuous by right clicking on it and selecting convert to continuous.
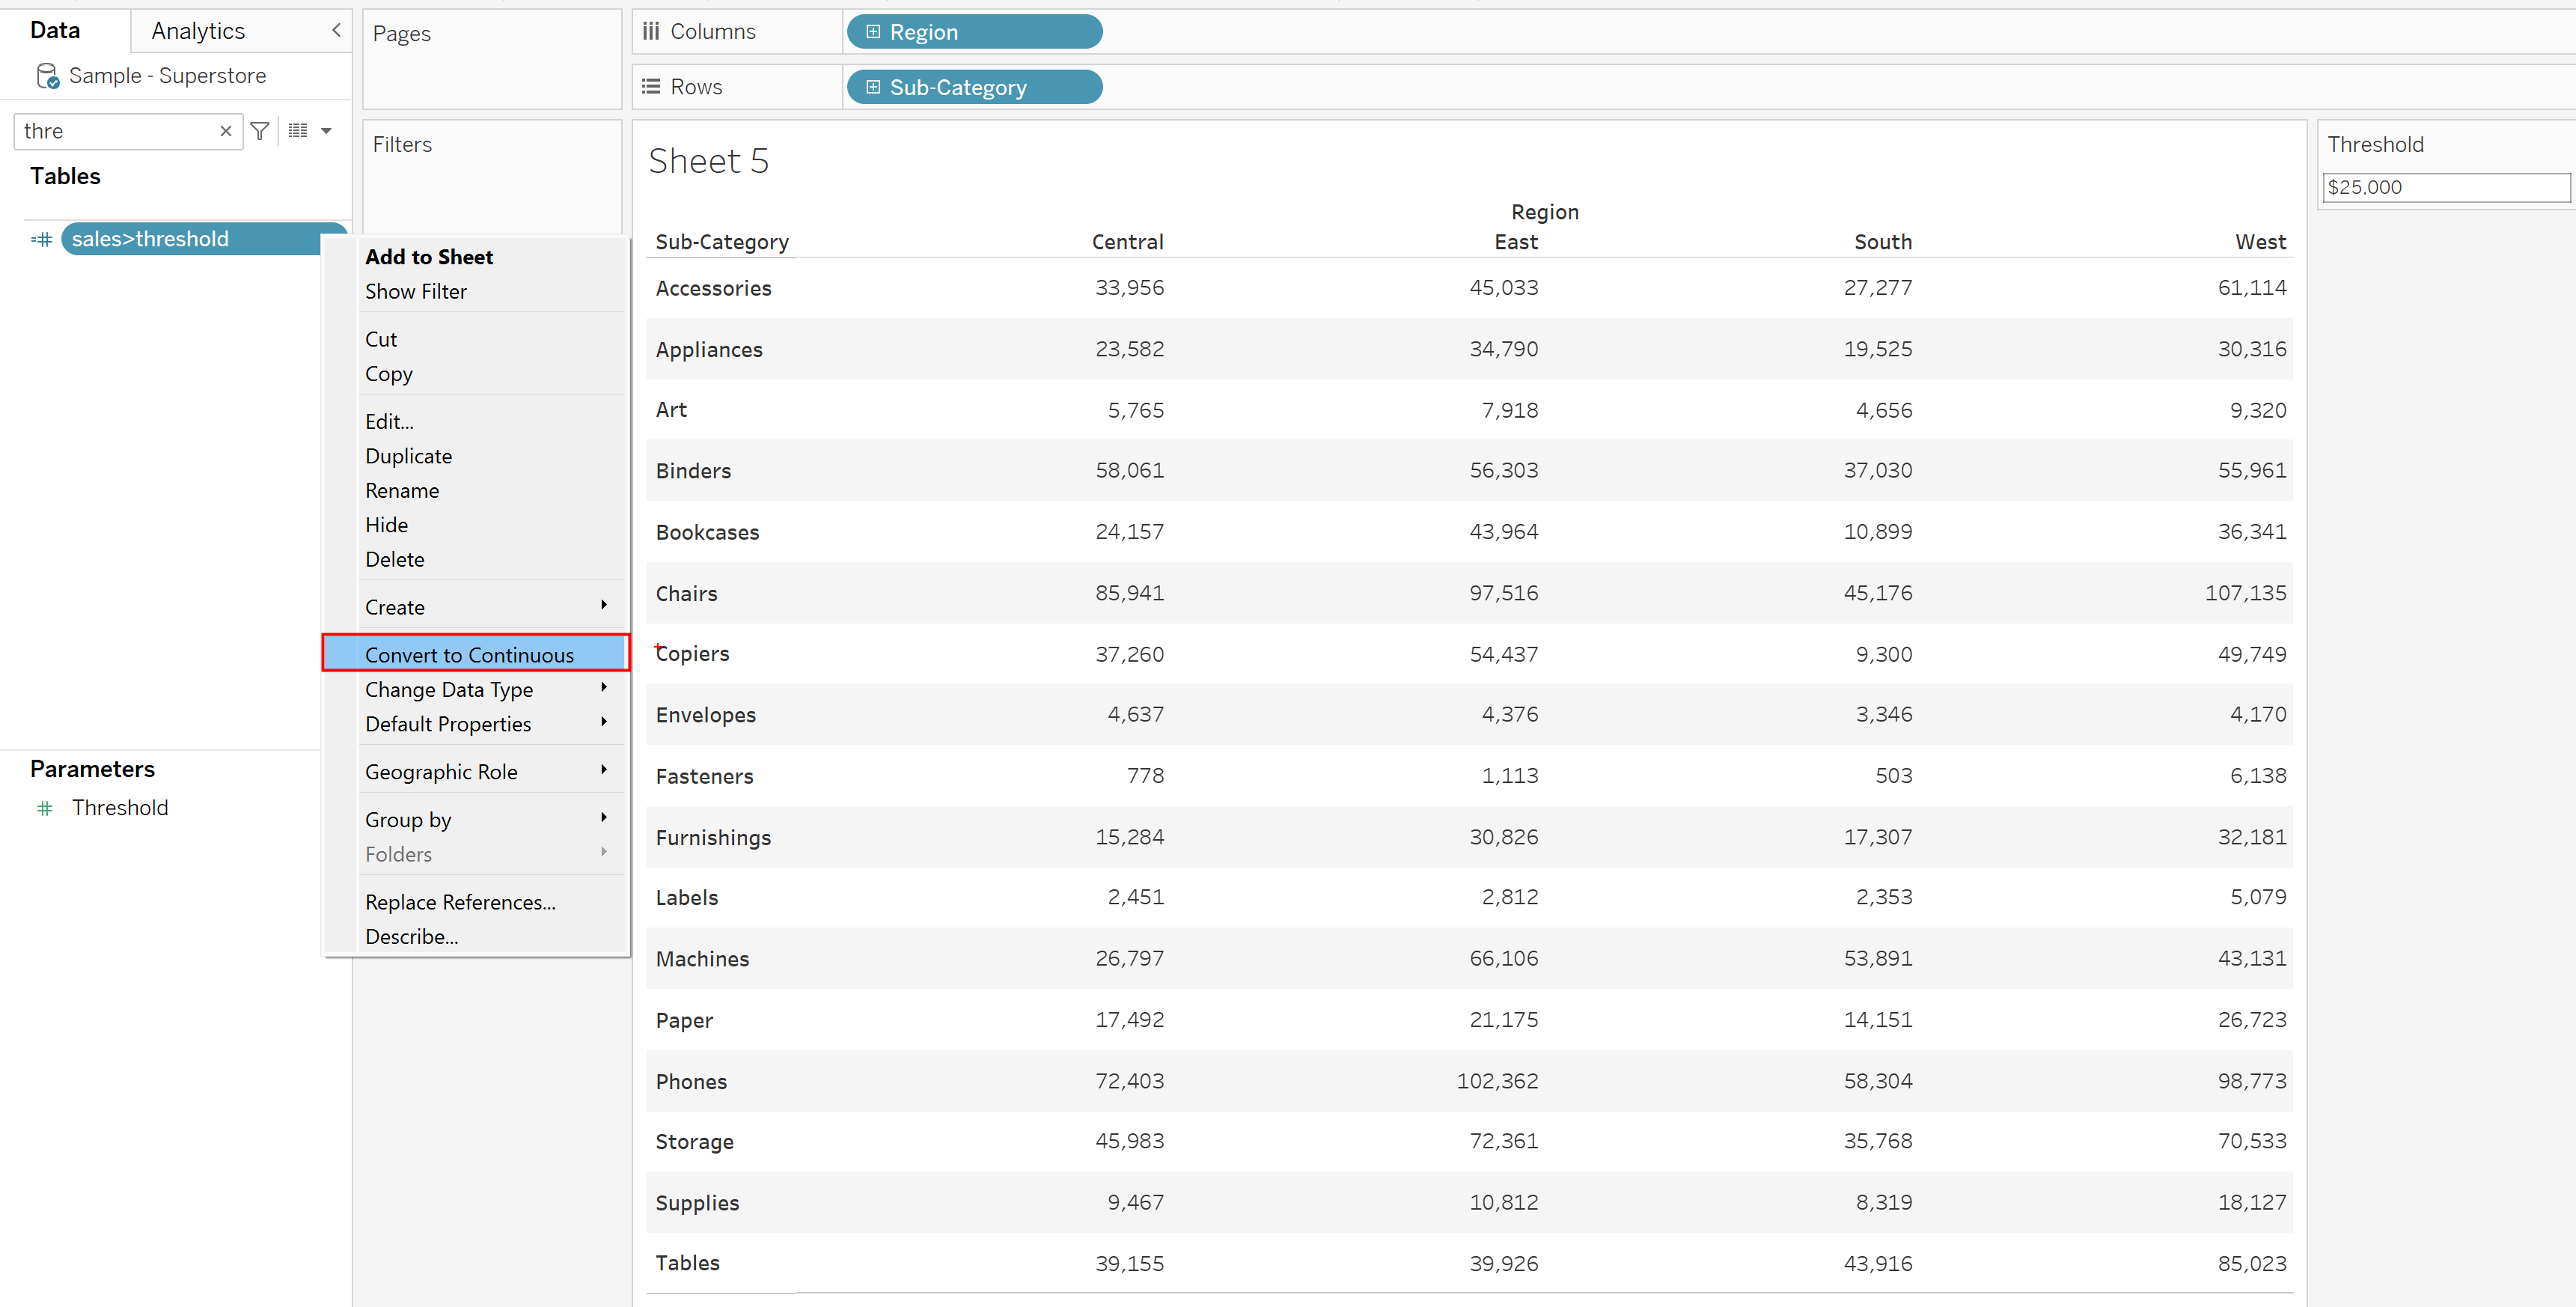
Drag this pill unto the view and release it when a show me sign pops up.
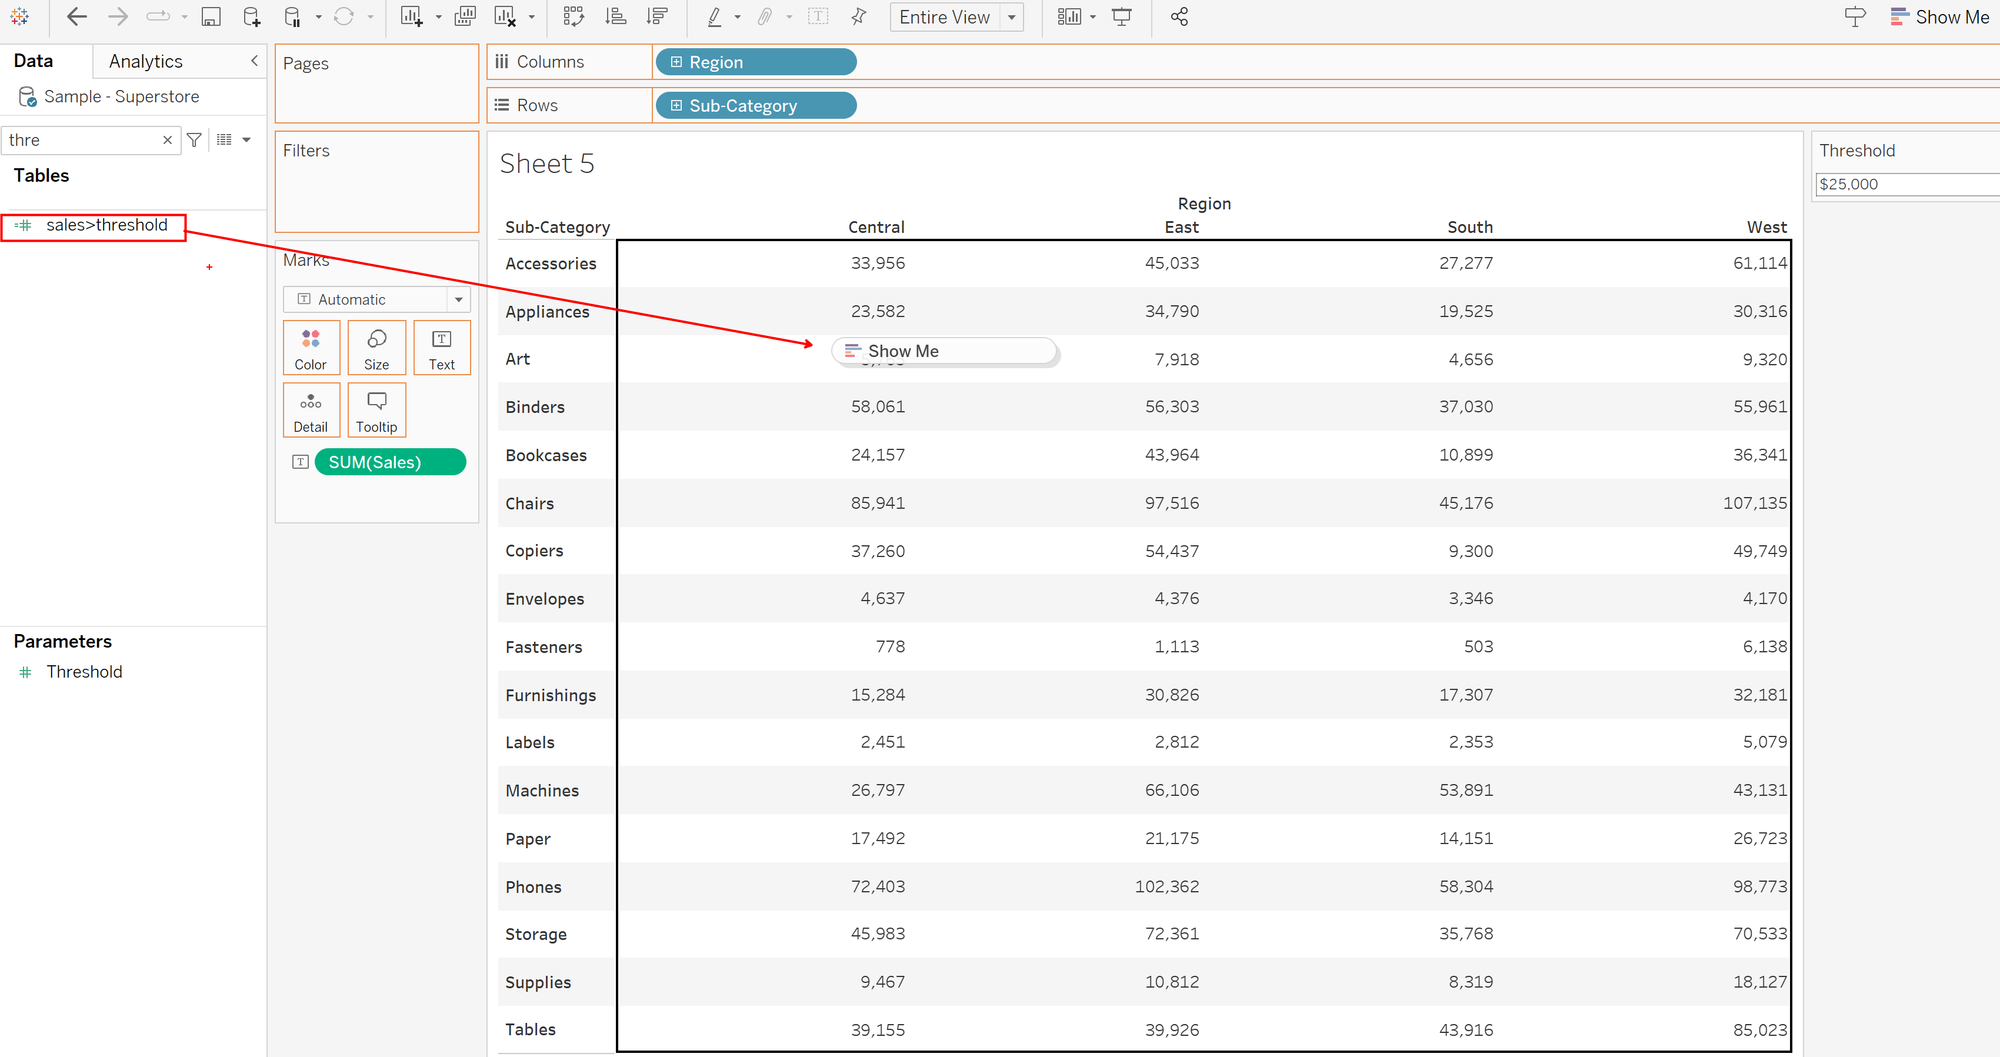
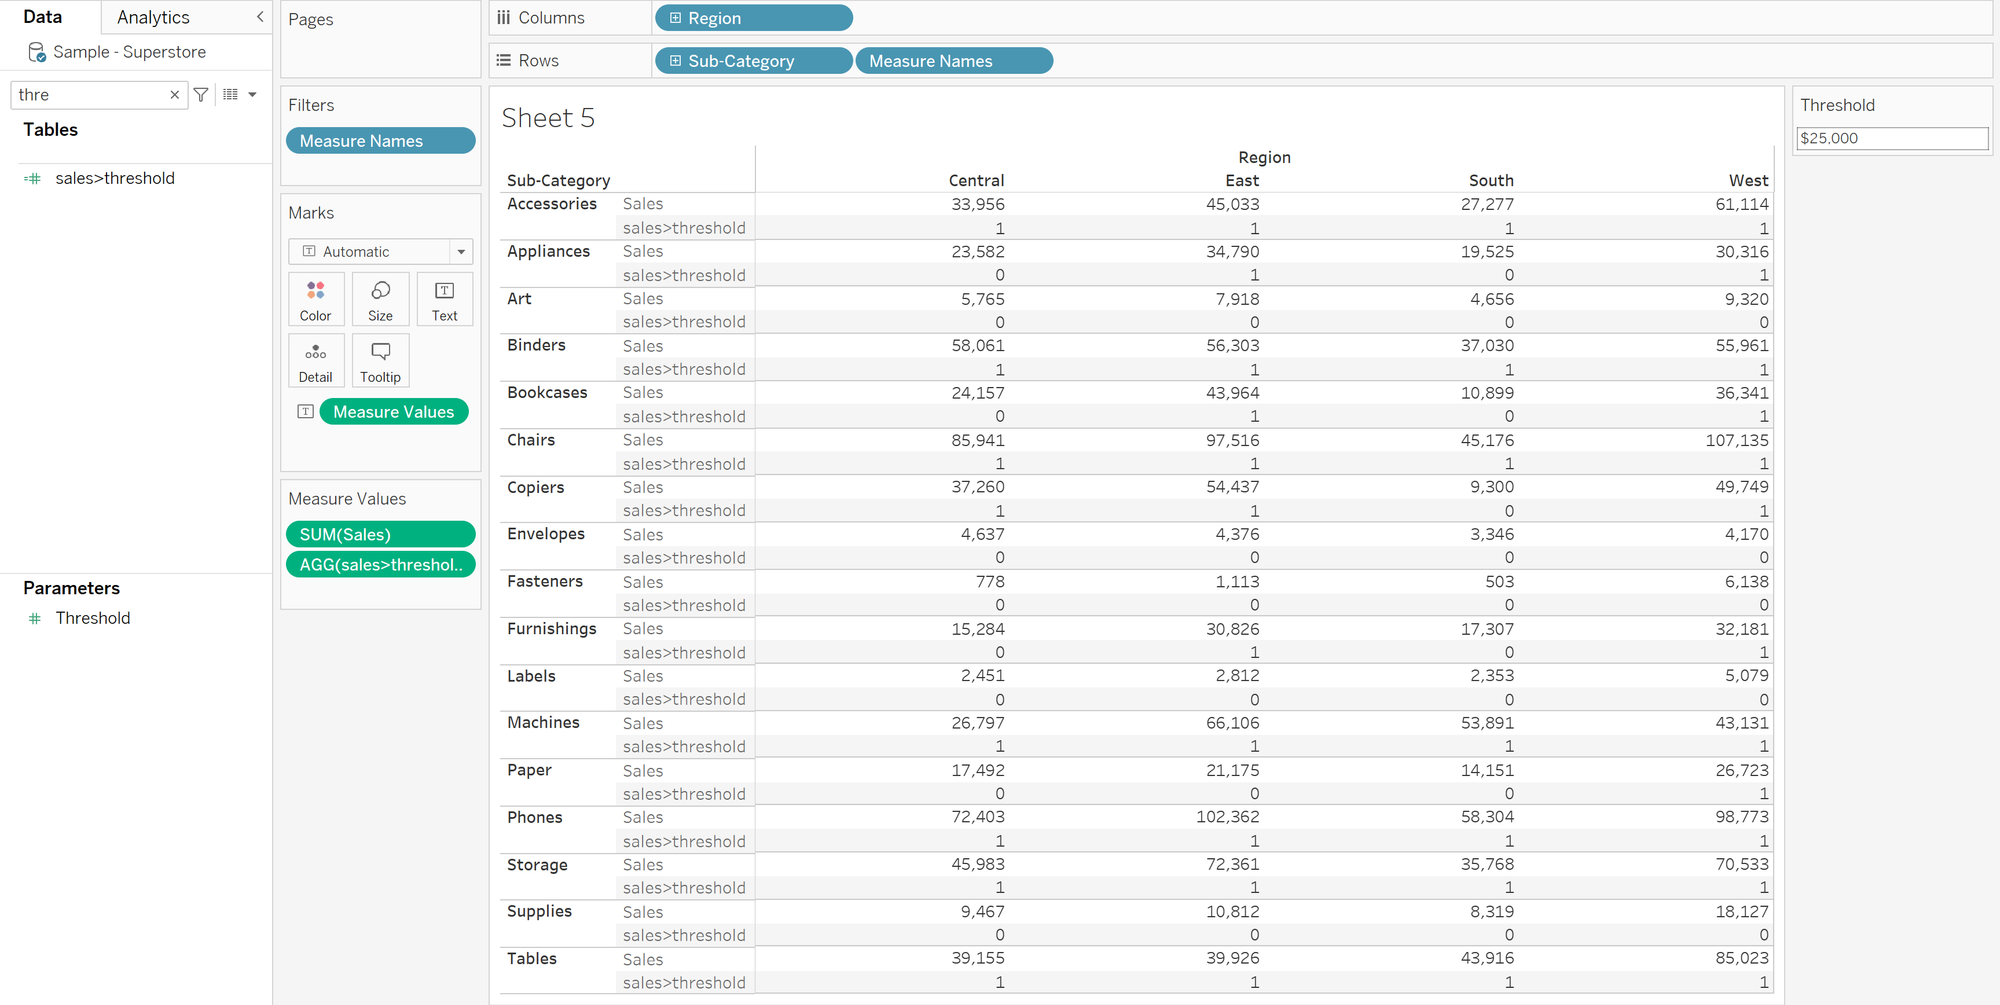
This now shows us sales above threshold as 1 and below as 0.
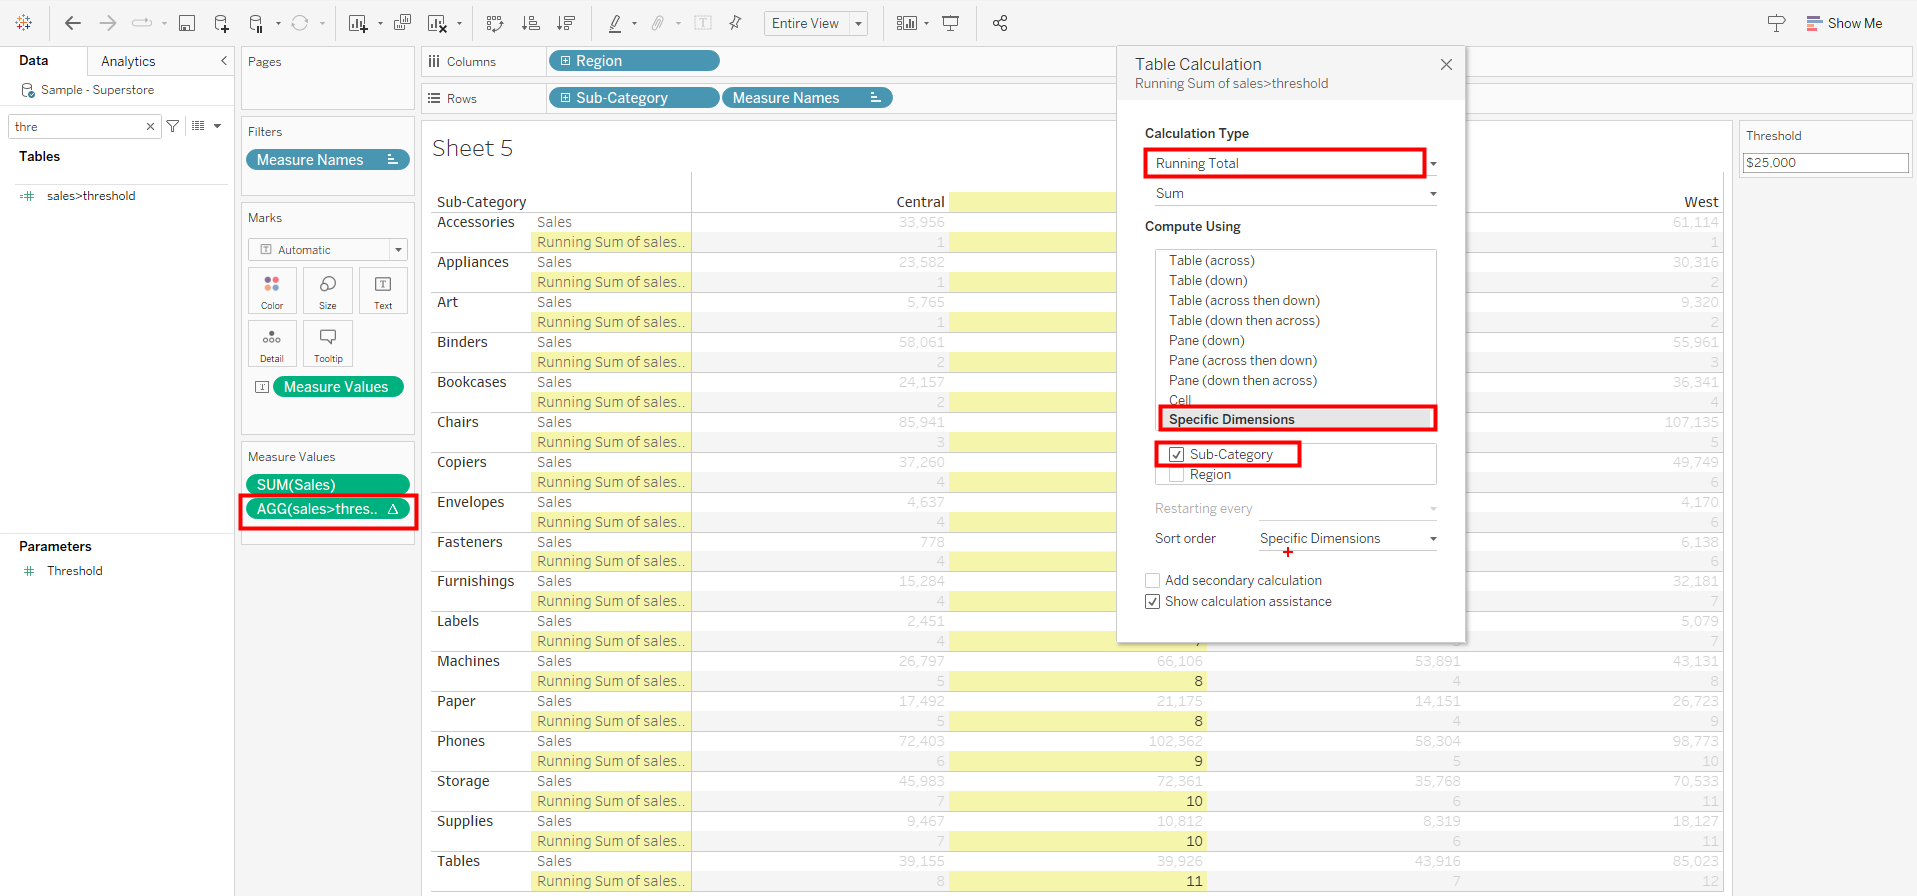
With this view, we can answer Q1 by right clicking on the measure, and adding a table calculation which computes a running total for all sub-categories and restarts for each region.
Right click on the header and select edit alias. Change to Sub-Categories above Threshold.
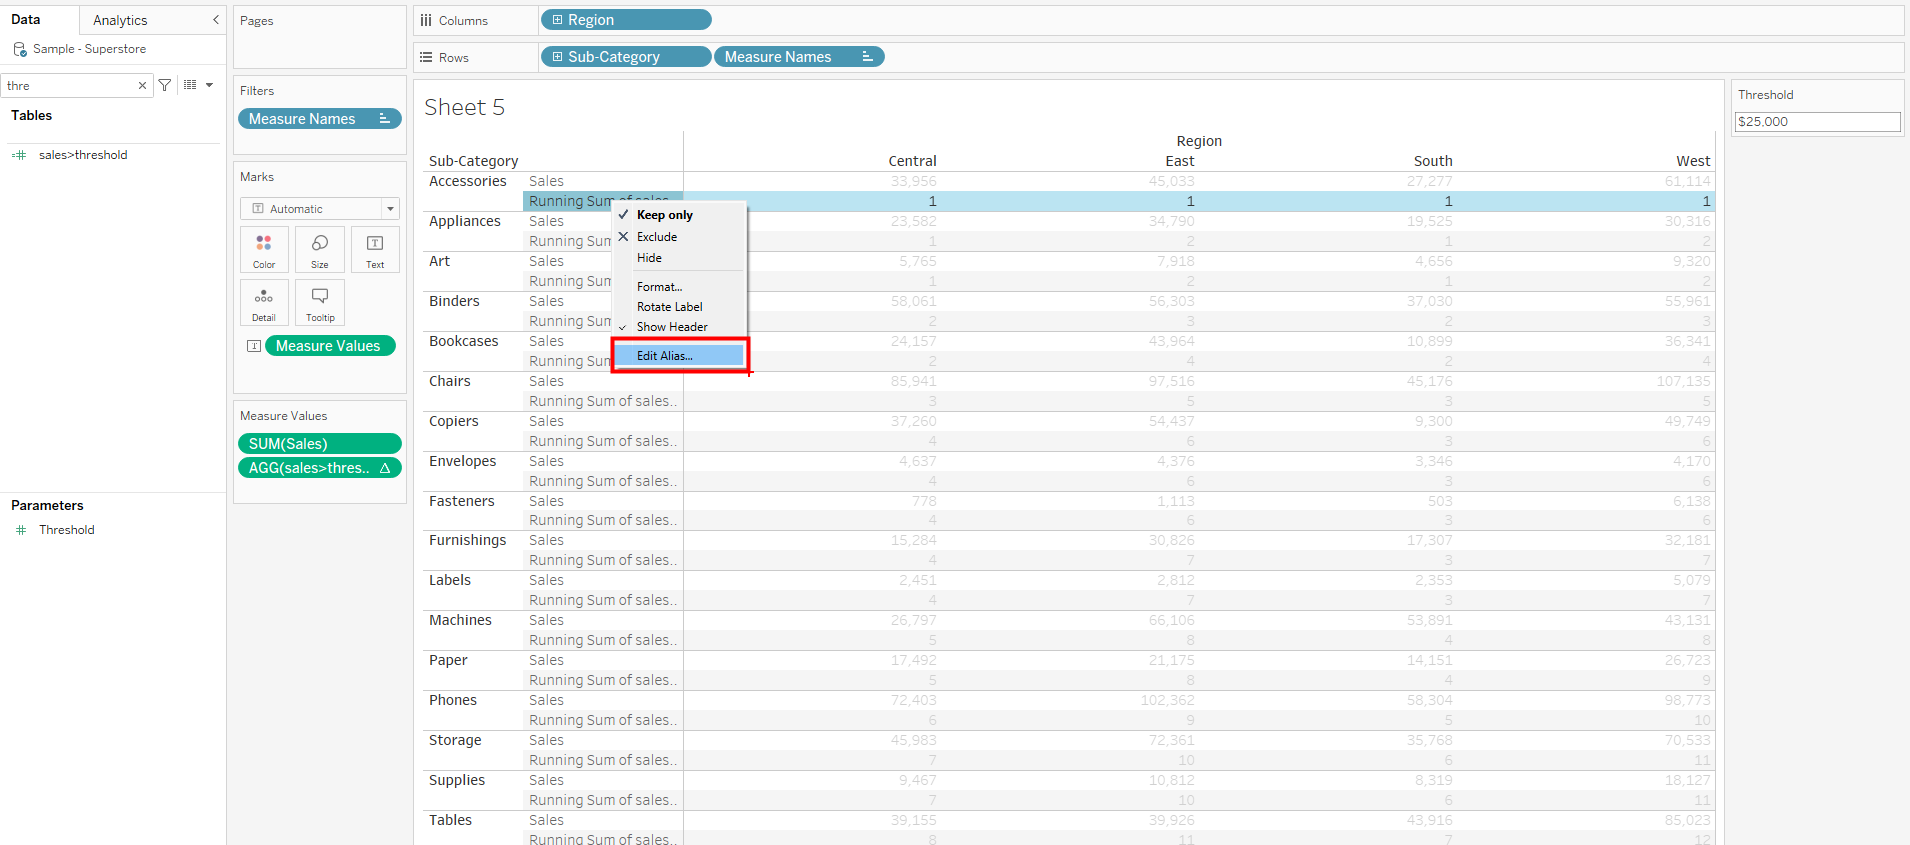
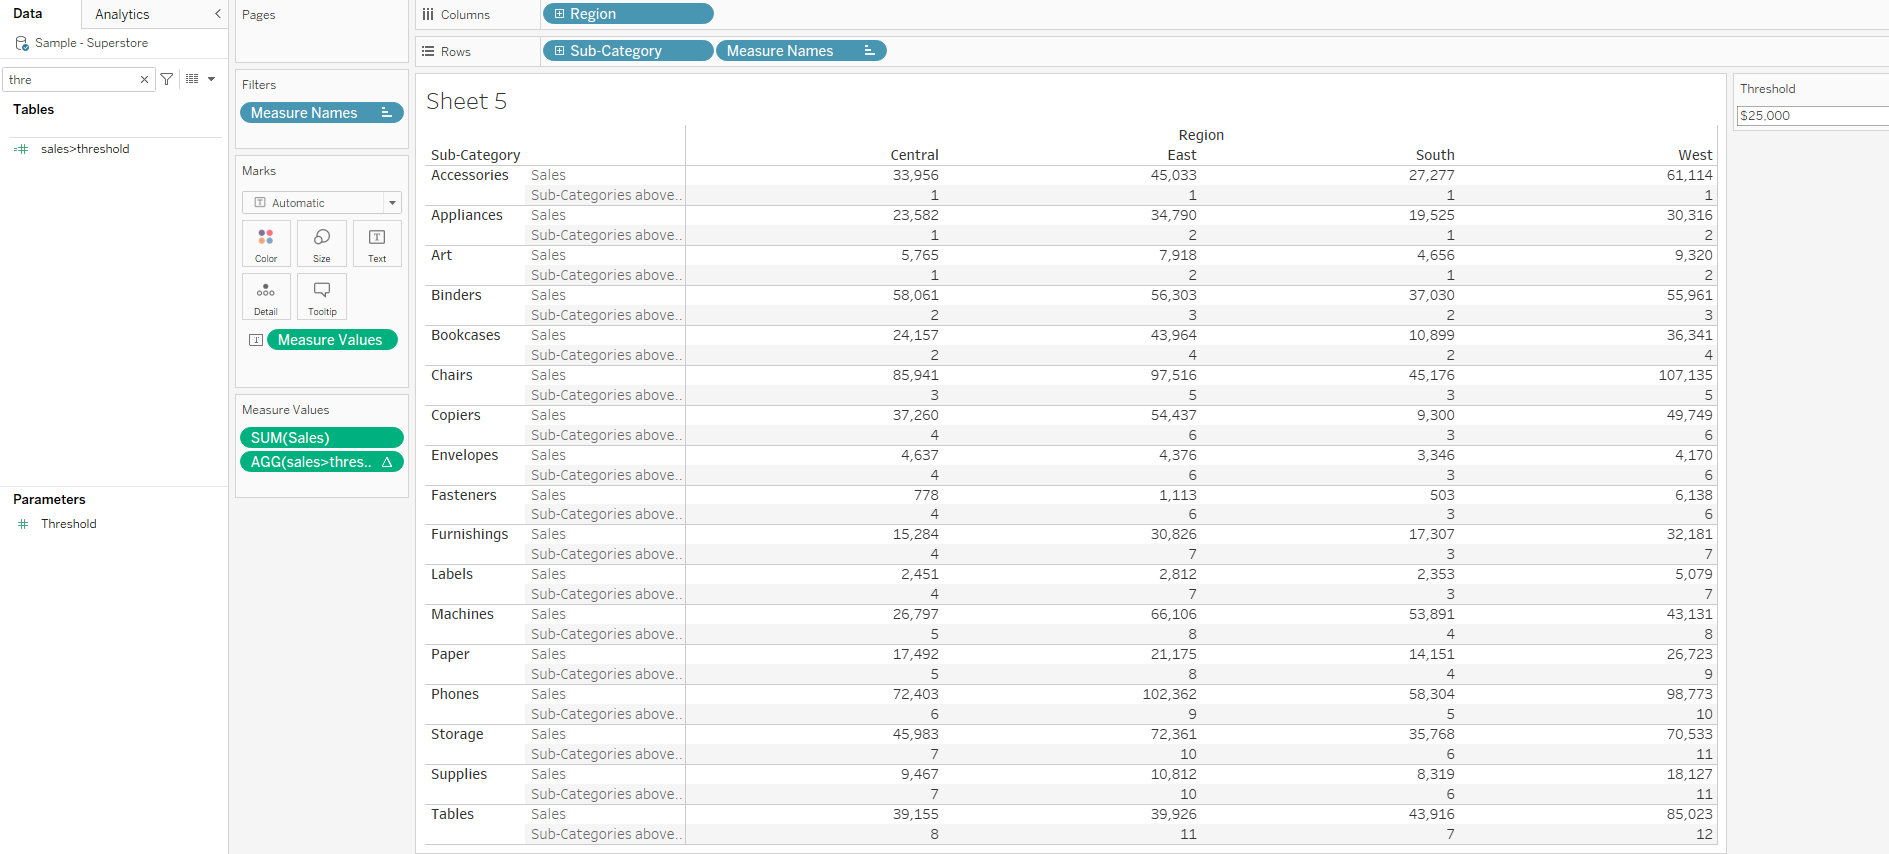
We can now create a calculation to answer question 2 which is the sum of sales for all subcategories above the stated threshold by multiplying sales by sales>threshold and call it Sales Above Threshold. Lets place that under measure values.

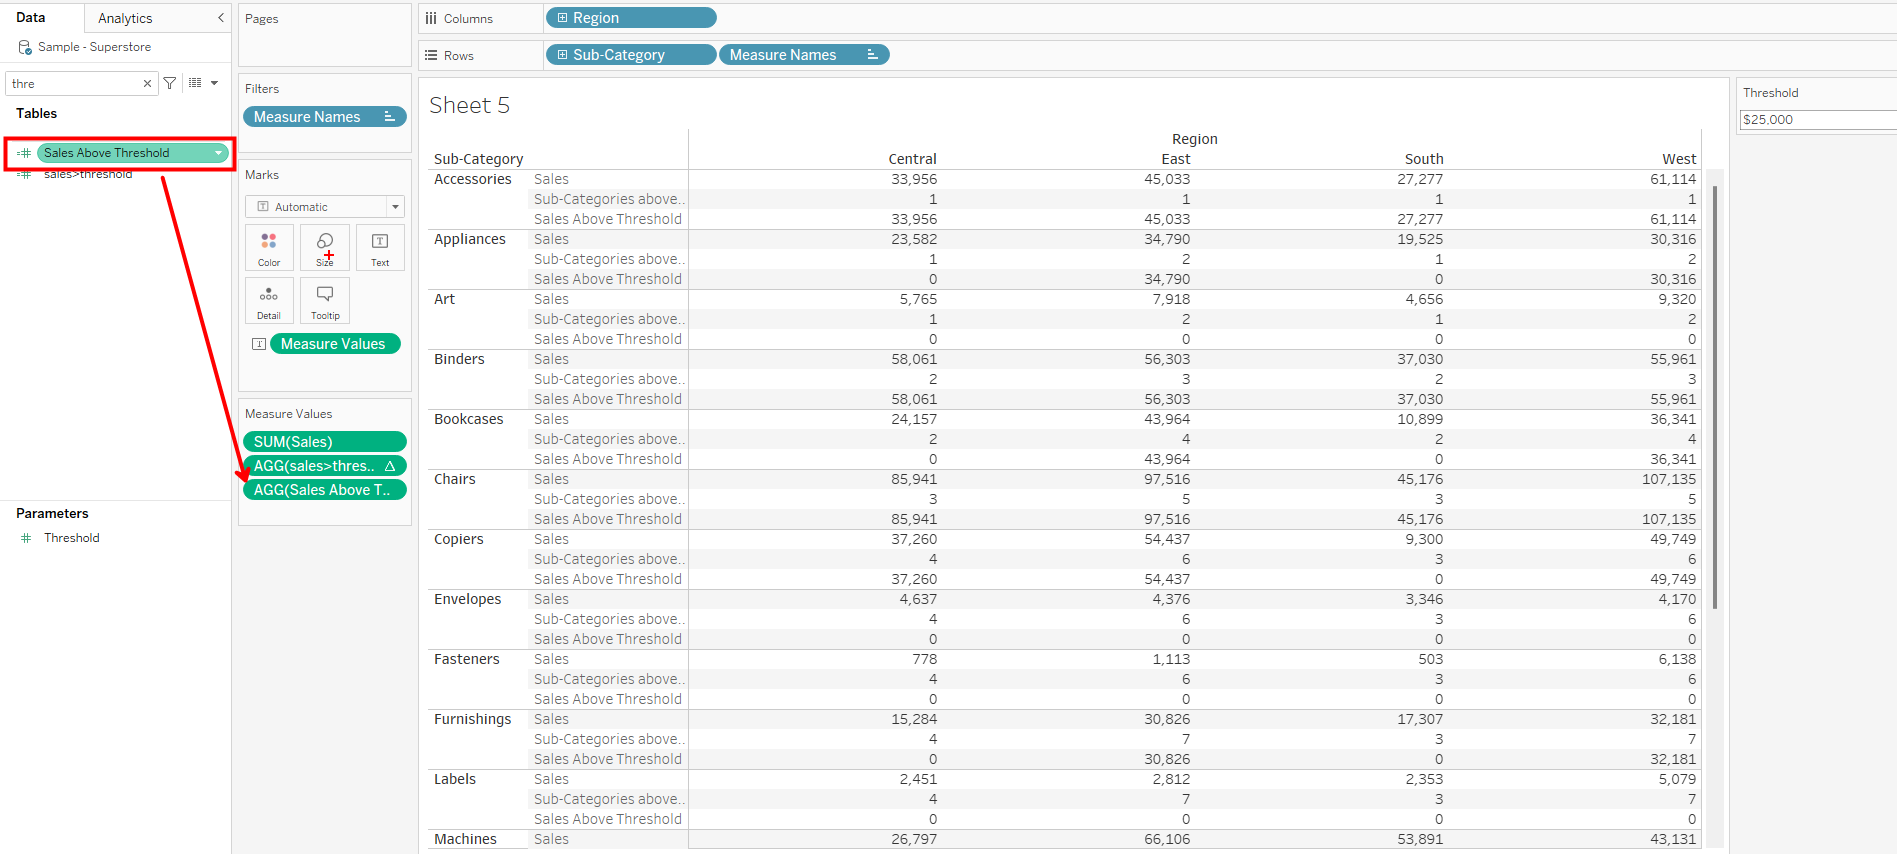
Once again we need to right click on this field and add a table calculation on running total for all sub-categories, restarting for each region. We will need to edit alias to original name.
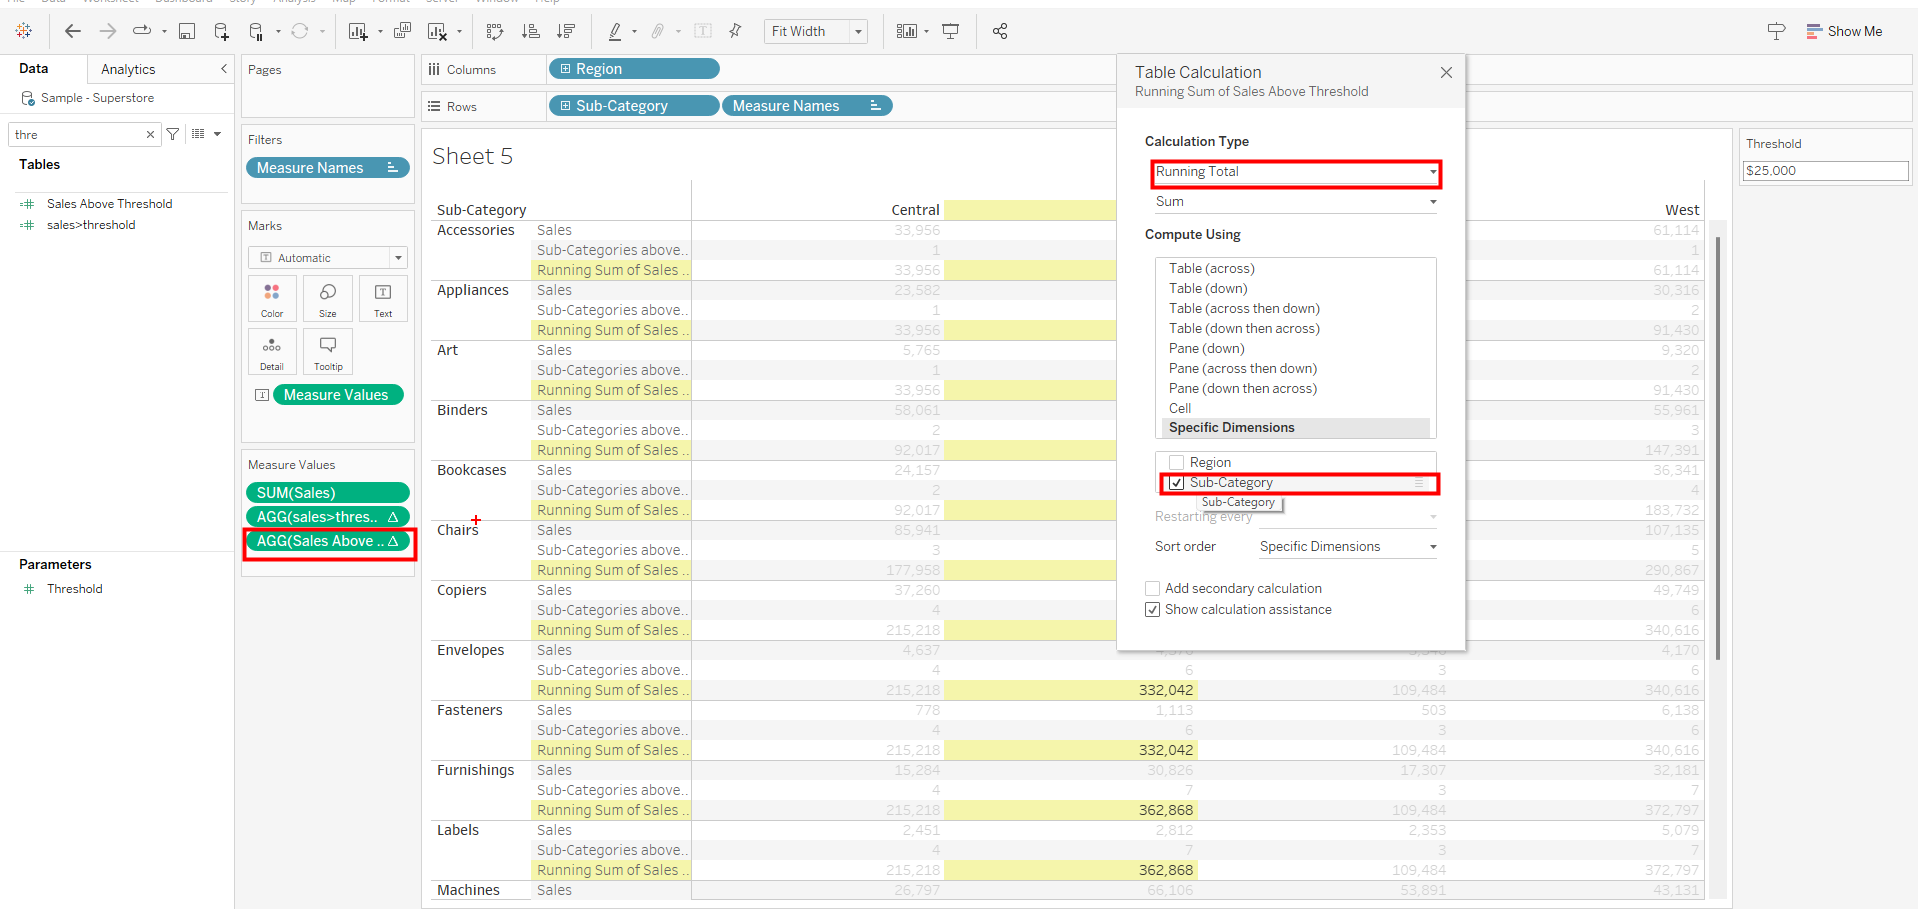
Now to get the % of Sales above threshold, right click on sum sales and add a running total for all sub-categories, restarting for each region and not forgetting to edit alias to Total Sales.
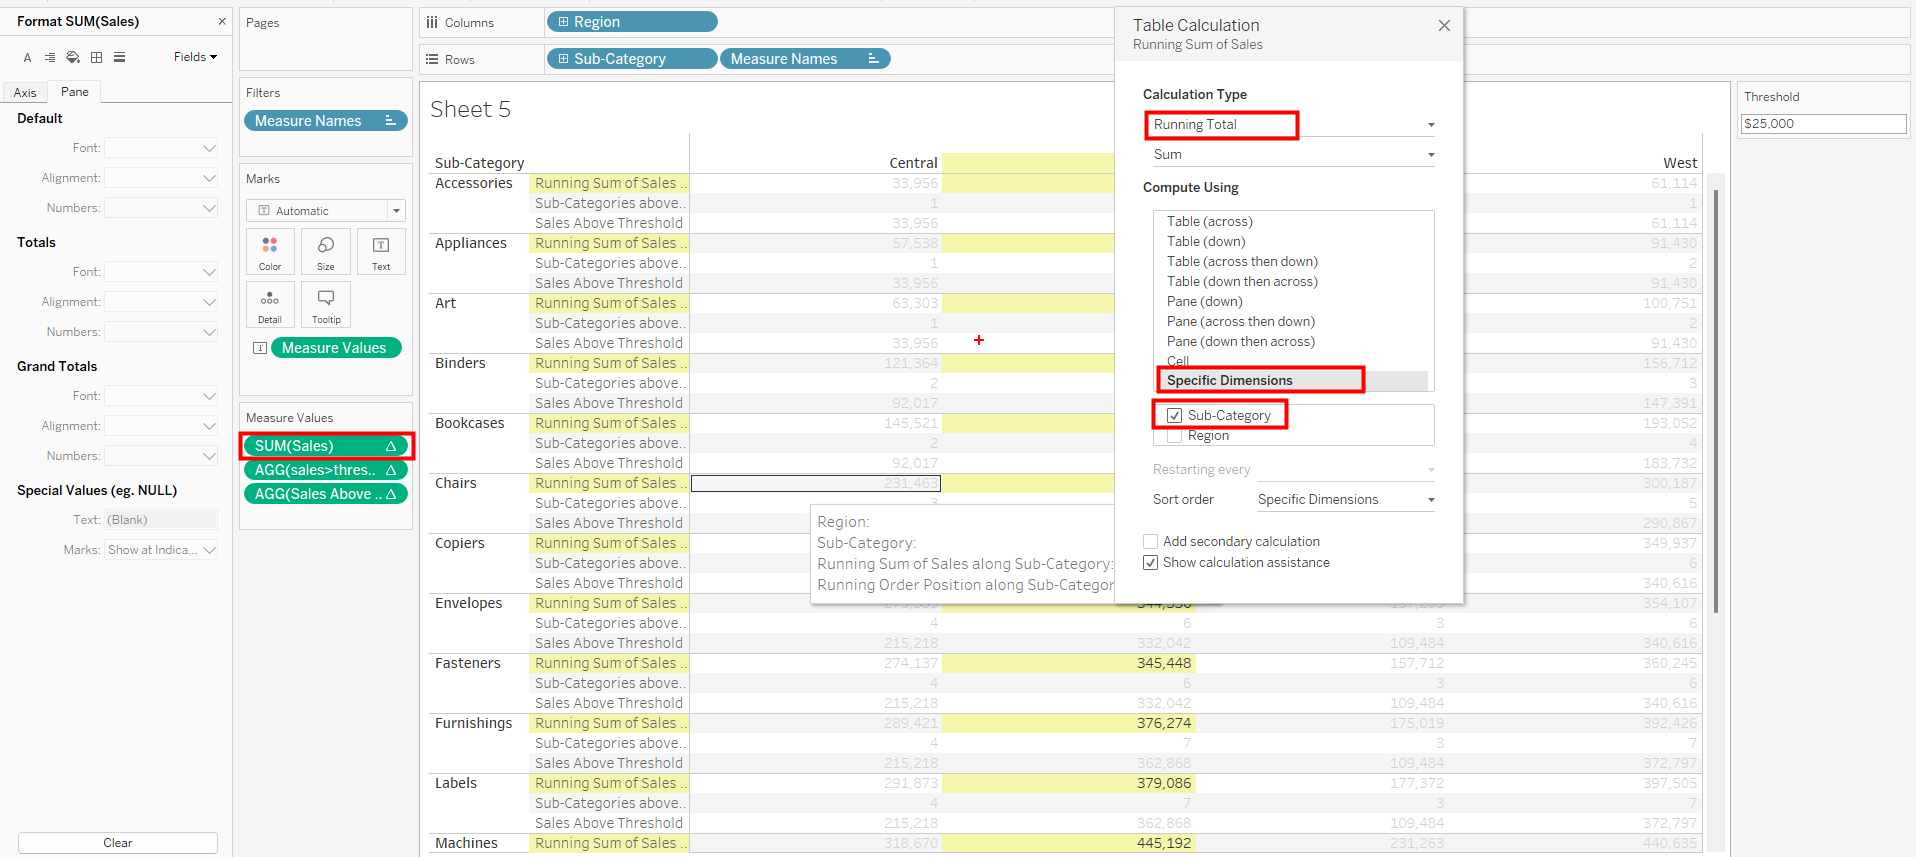
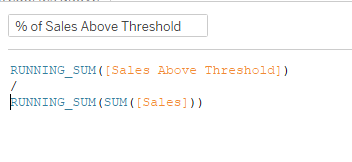
Now lets create a calculation that divides Sub-category sales above threshold by Total Sales and place it on measure value shelve.
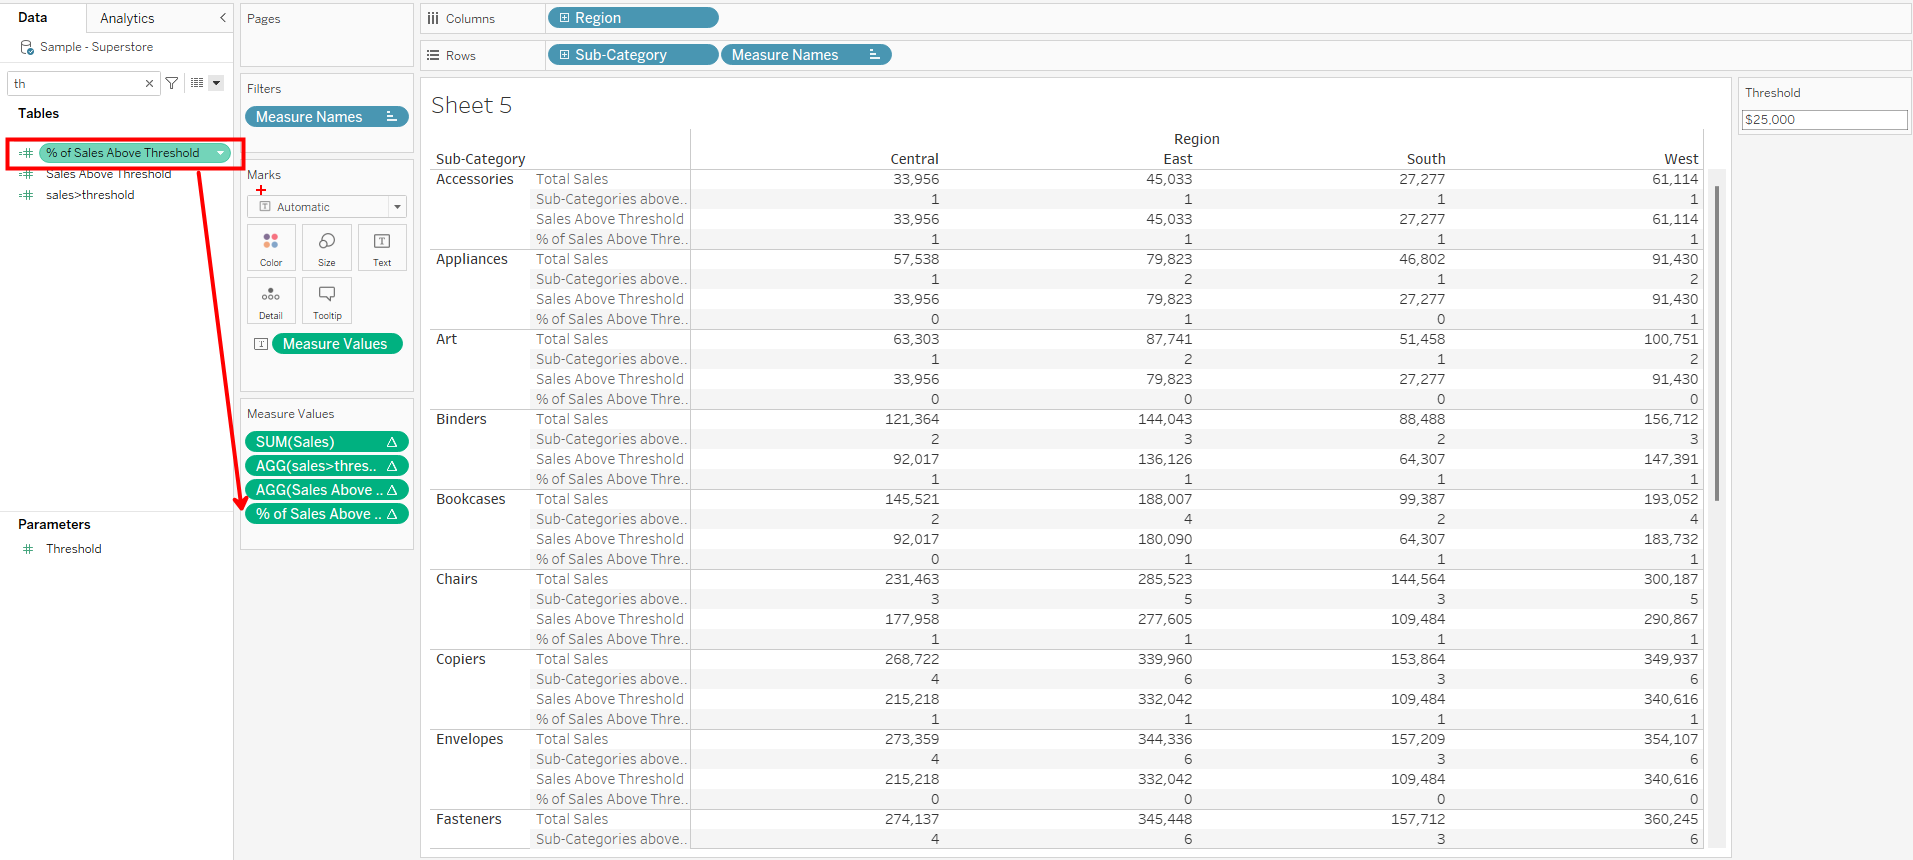
We have to edit table calculation on specific dimensions by selecting sub-categories, restarting for each region and not forgetting to edit alias to original name.
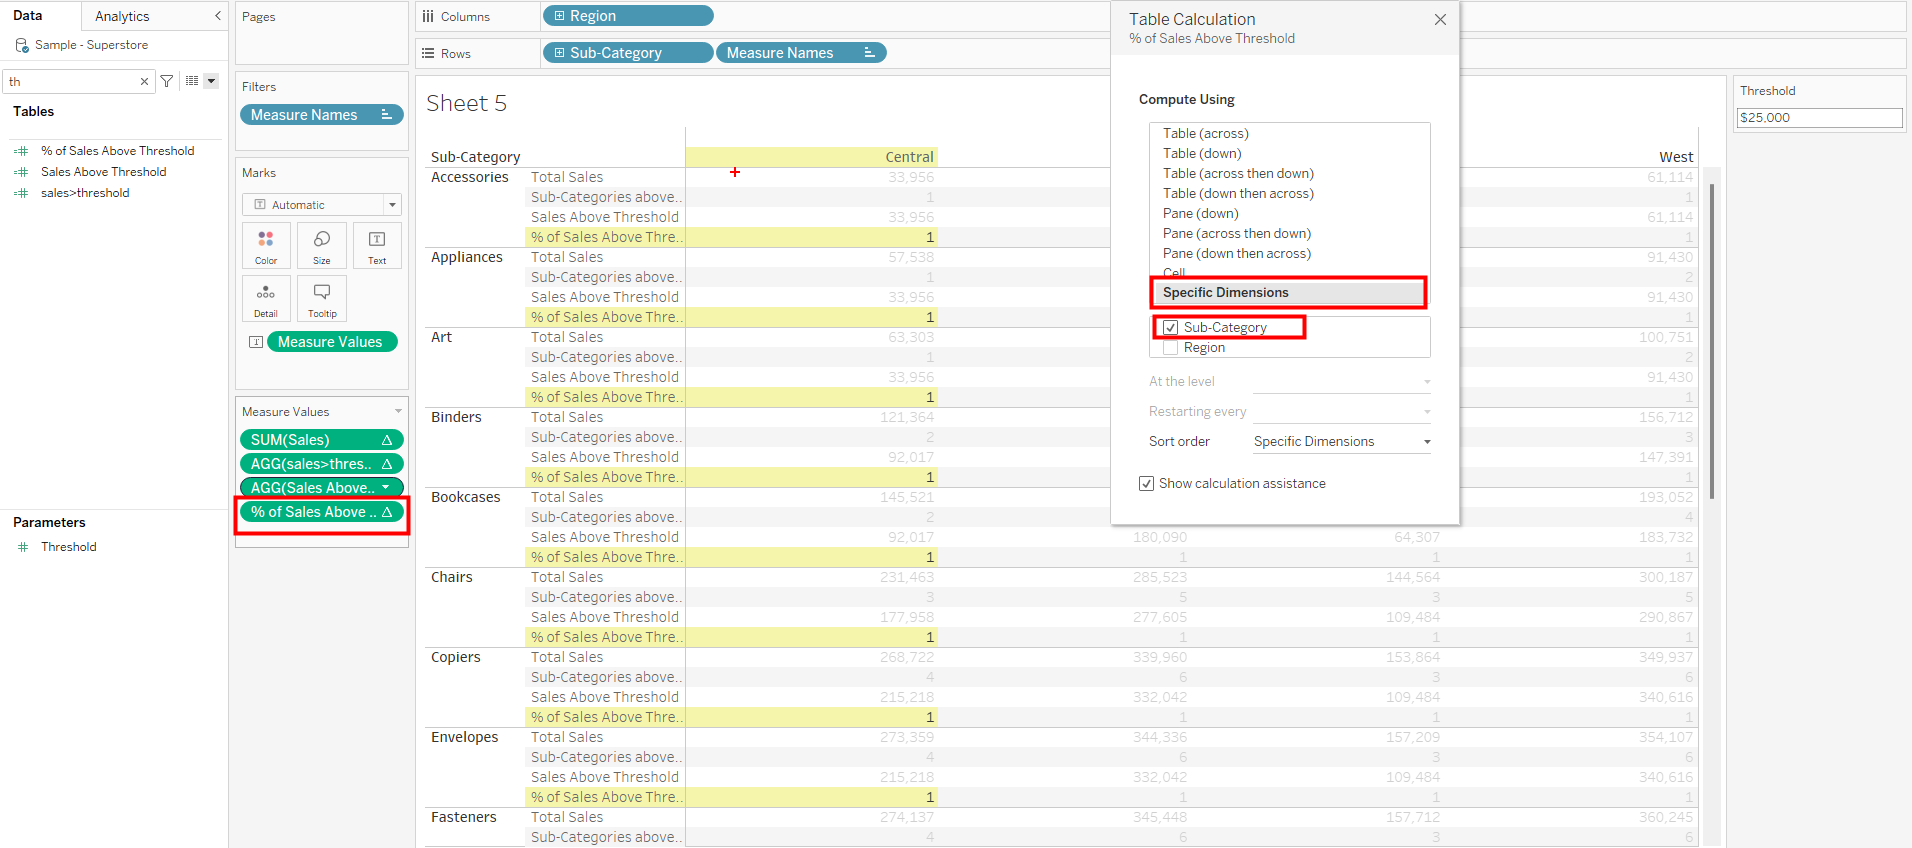
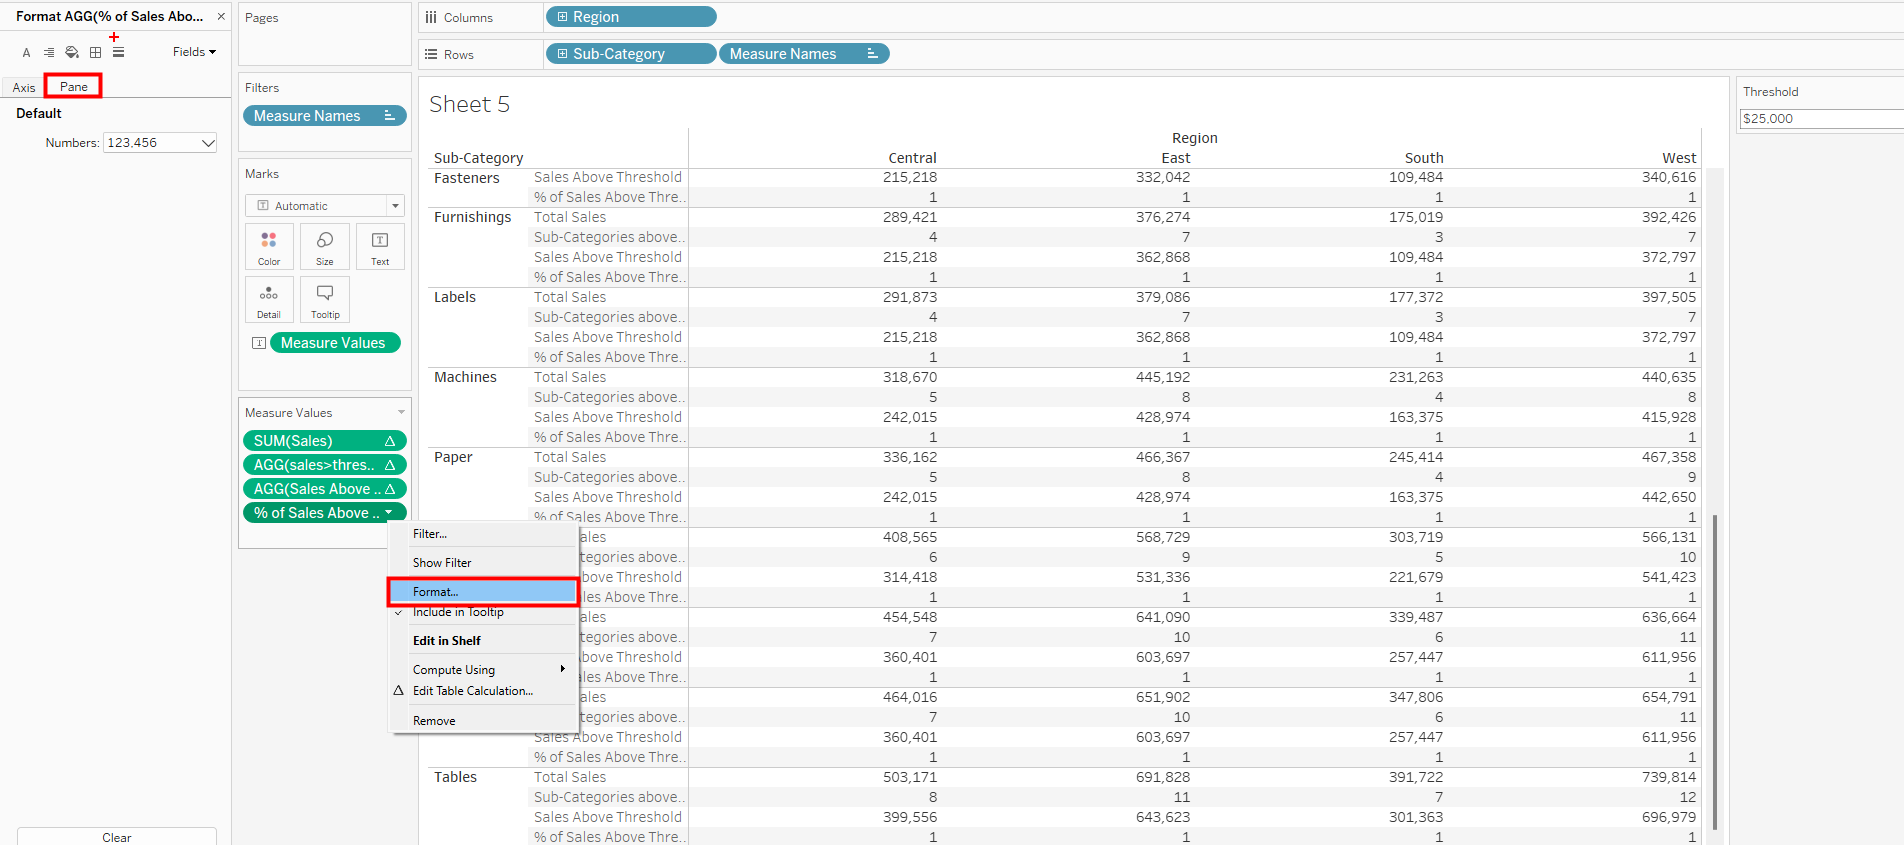
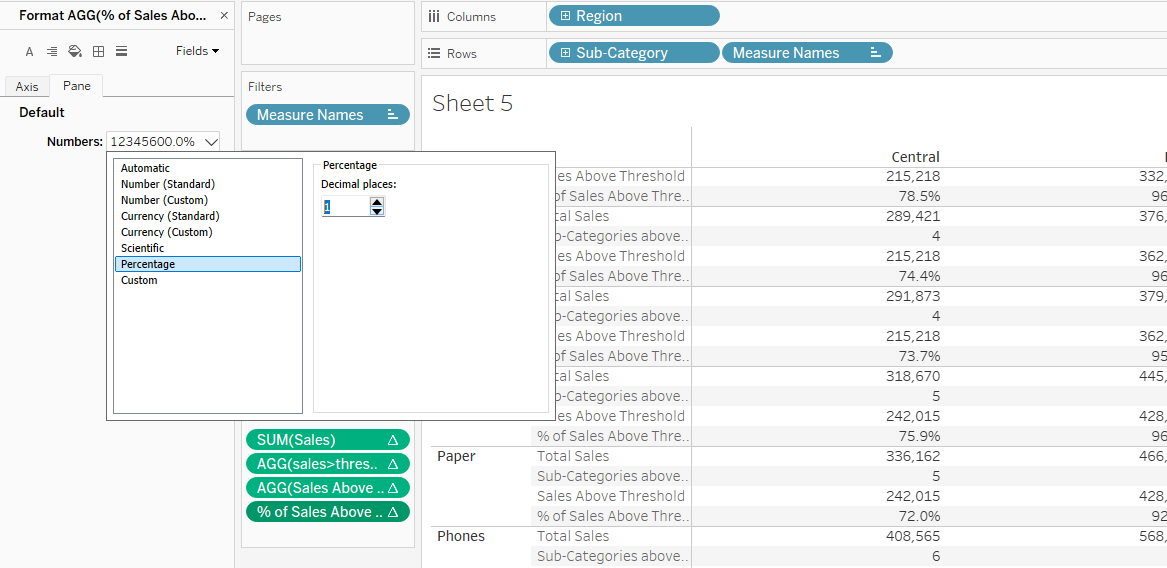
Next is to change the default format by right clicking and selecting format. Under Pane, change the number format to percentage specifying 1 decimal place.
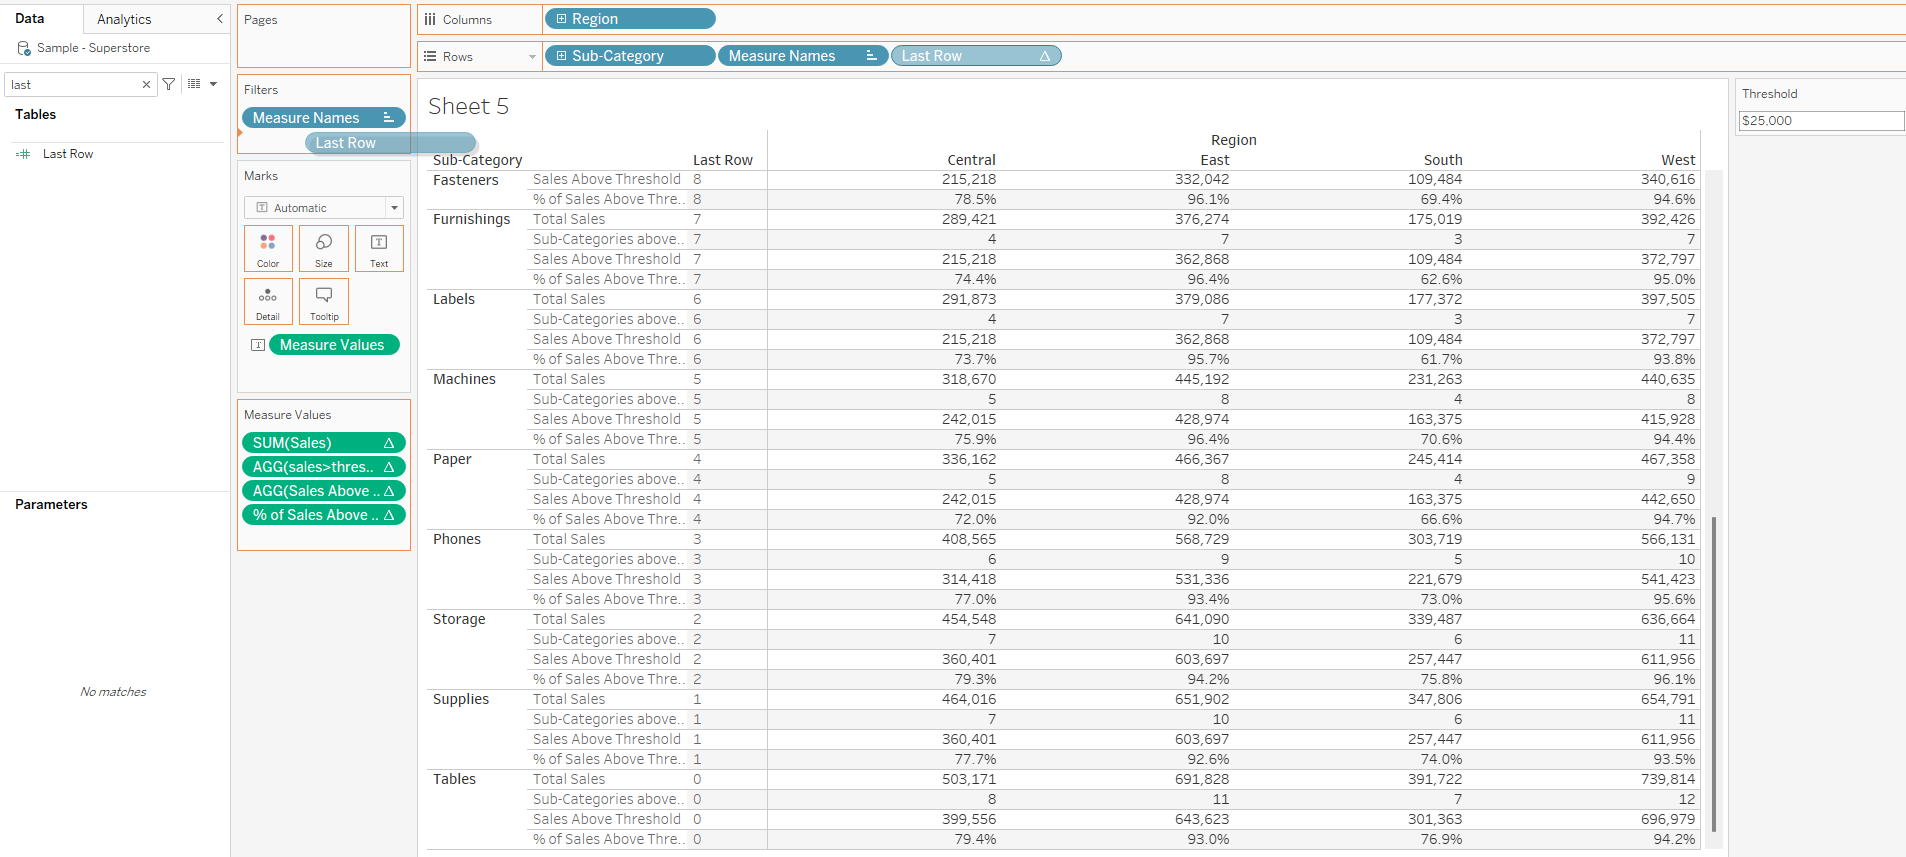
At this point we are have answered all three questions posed but the view is not as we want. From the onset, we need a view that shows 3 rows and 5 columns. Secondly, from the calculations we have done so far, which to larger extent are all running totals, we can deduce that the row of essence is the last row which shows Tables as sub-category. Mind you since we are using table calculations, we cant take off the dimensions in use but we can only hide them. To get our last row, lets create a calculation called Last Row and drag it to row shelve.

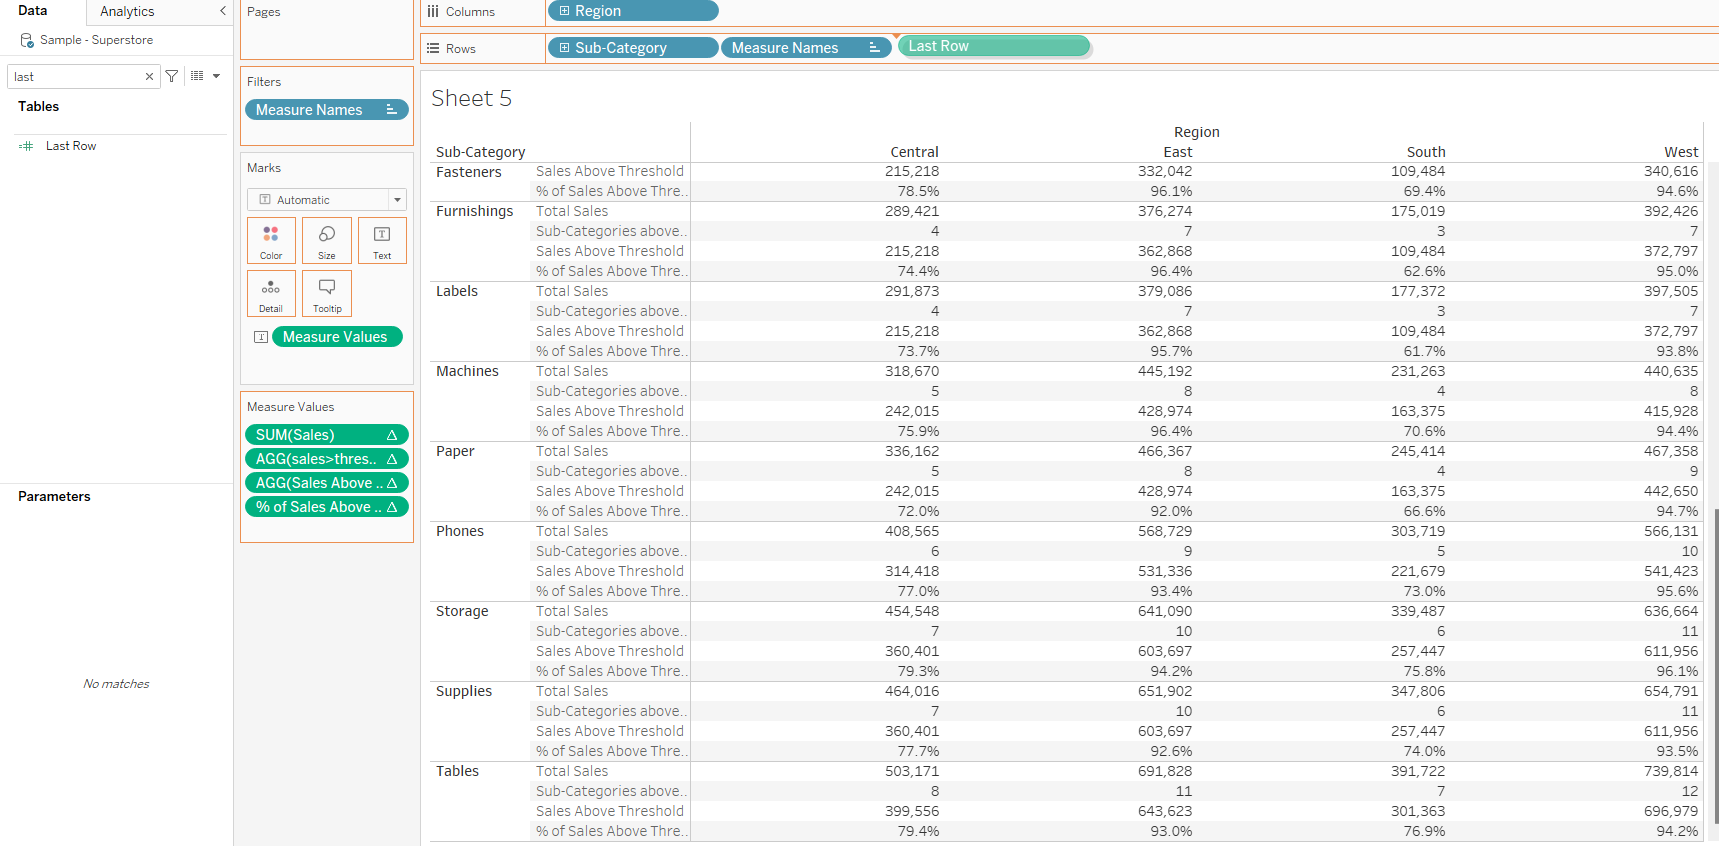
This produces this view.
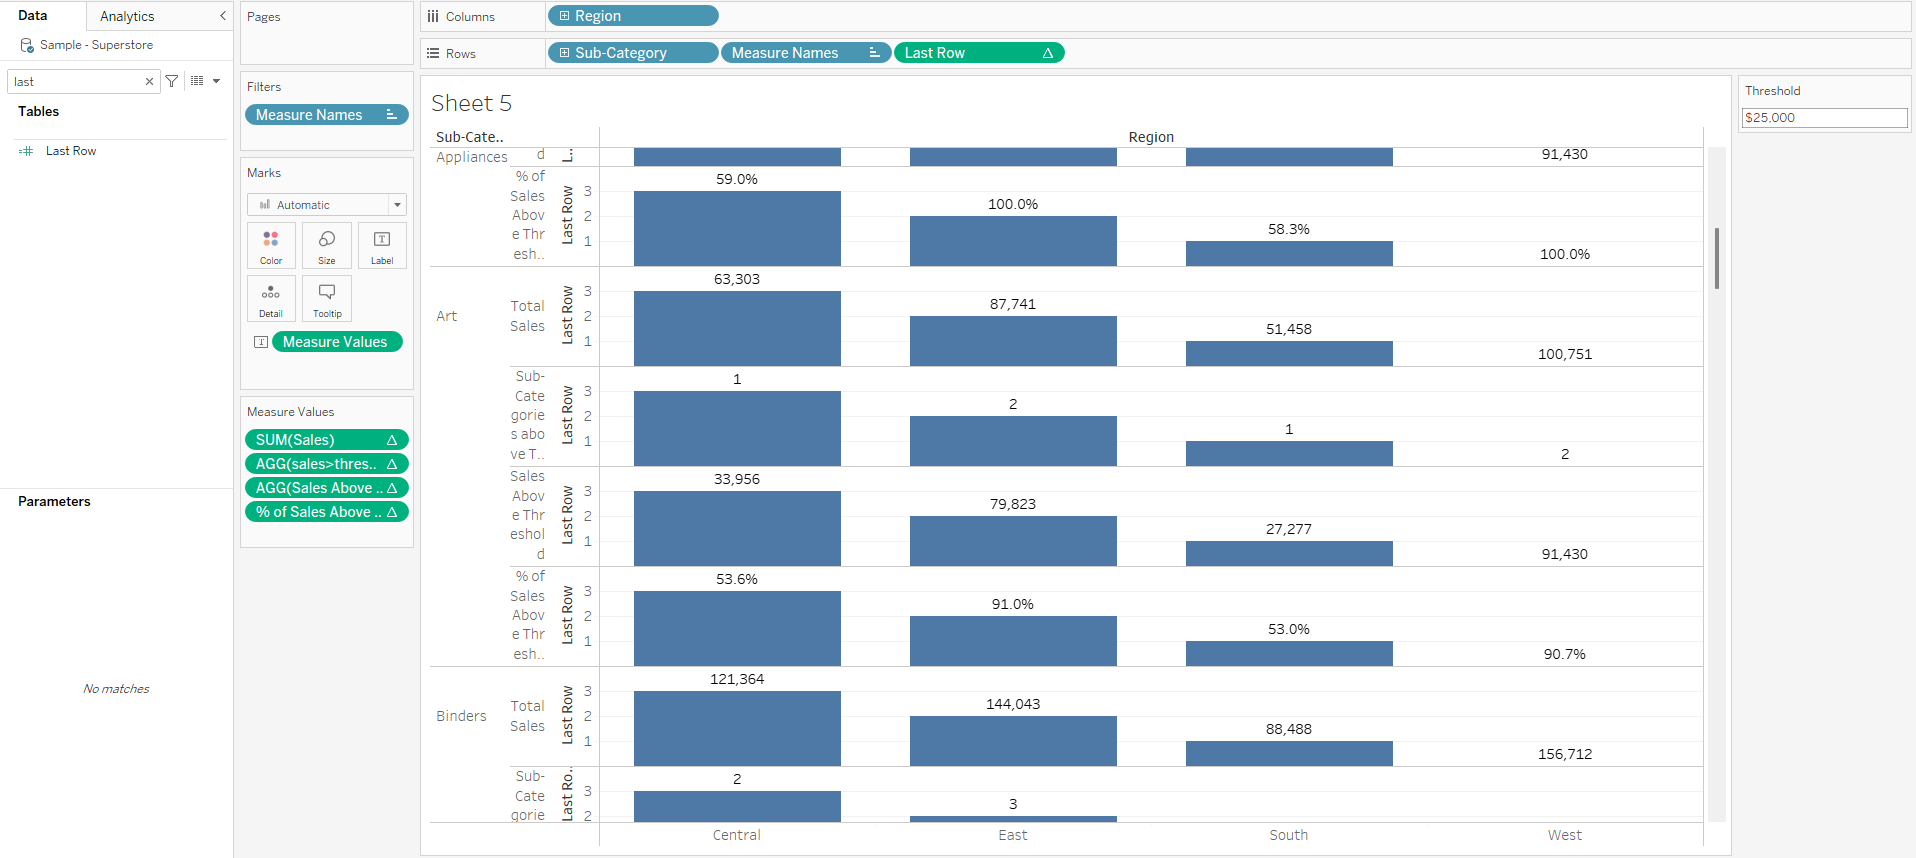
Right click on last row and change it to discrete to get an altered view.
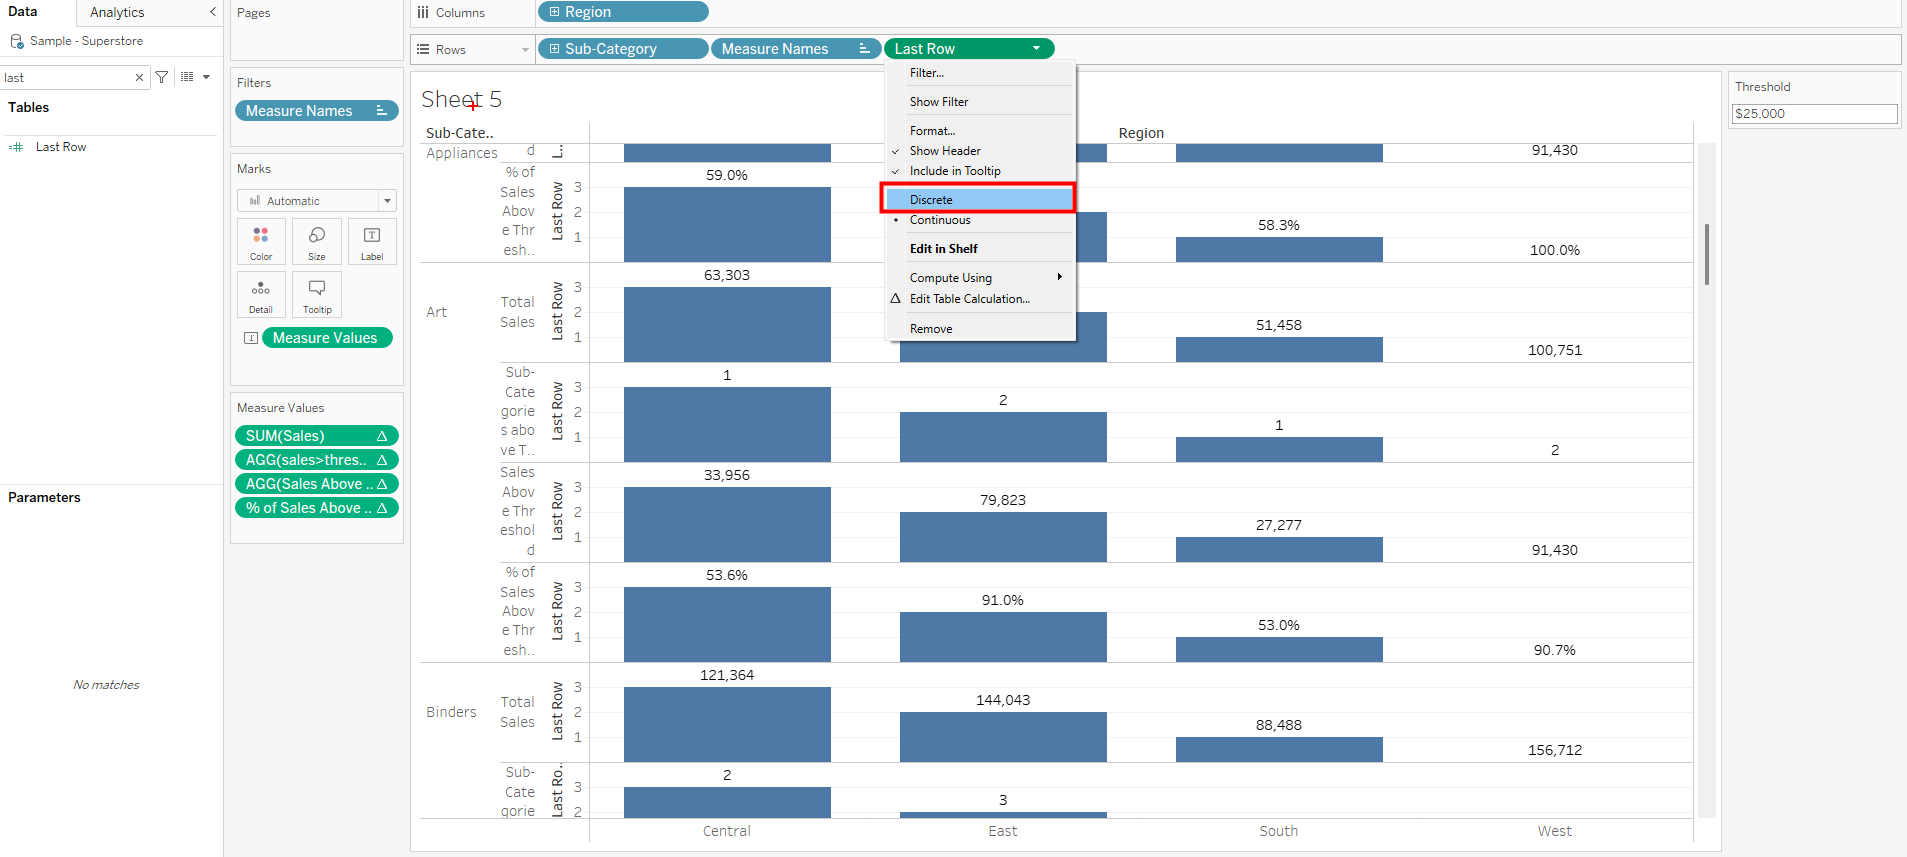
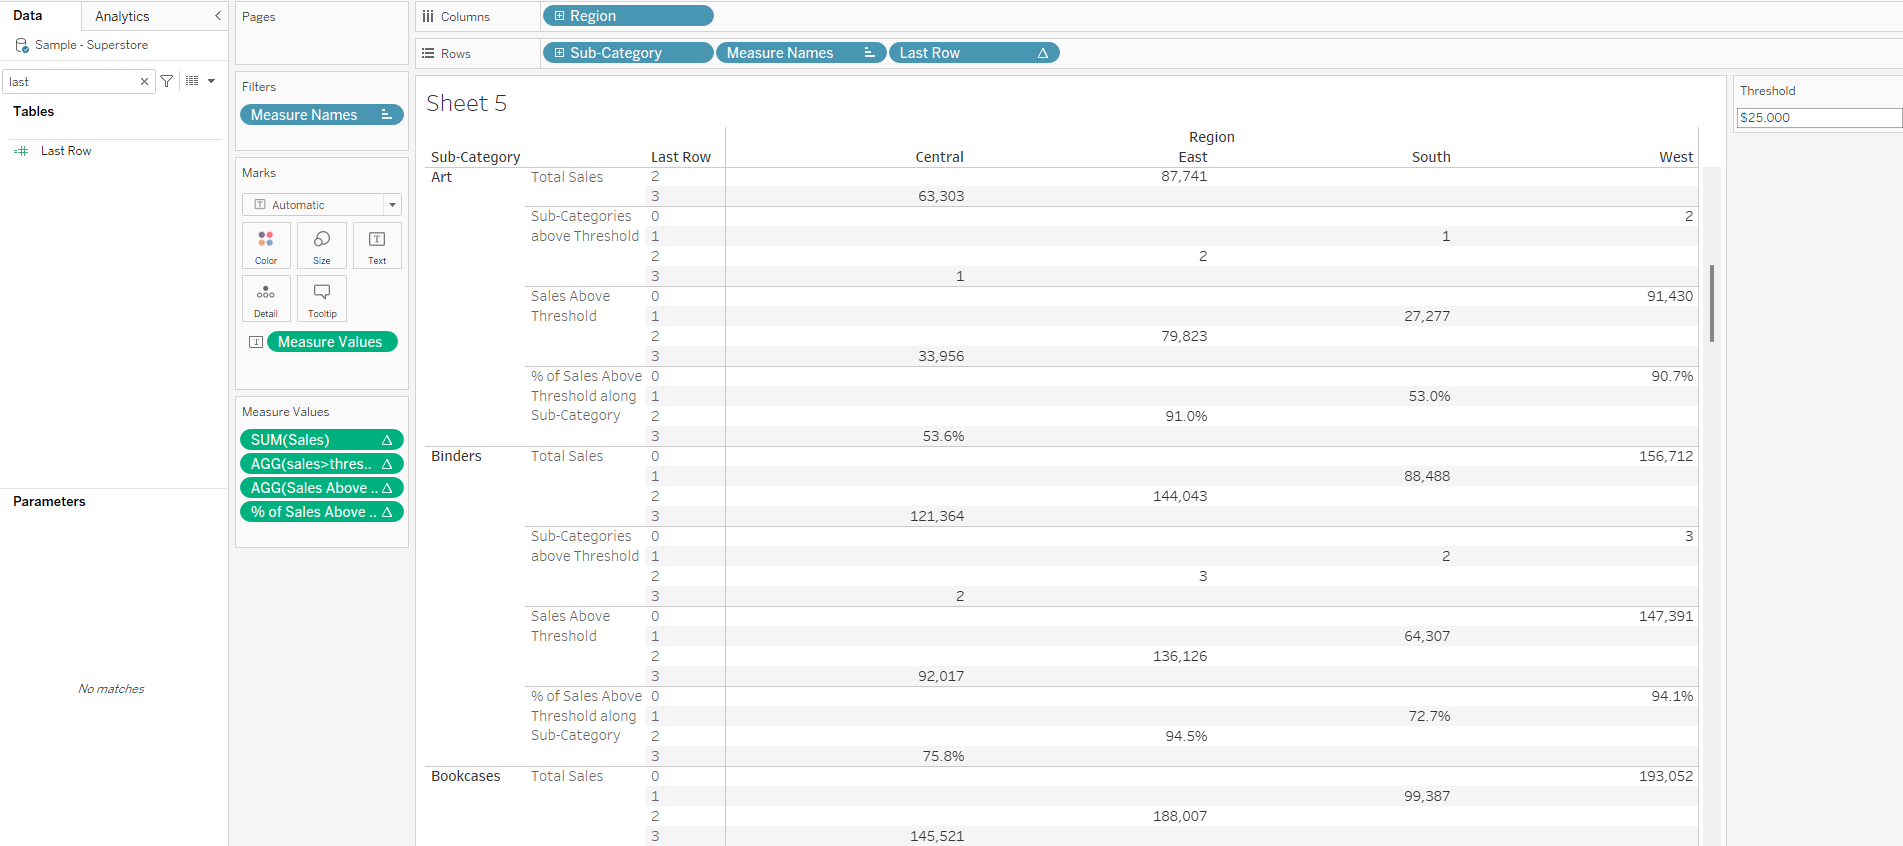
Next is to now edit Last Row since its a table calculation by computing on specific dimensions, ticking sub-category and restarting for every region.
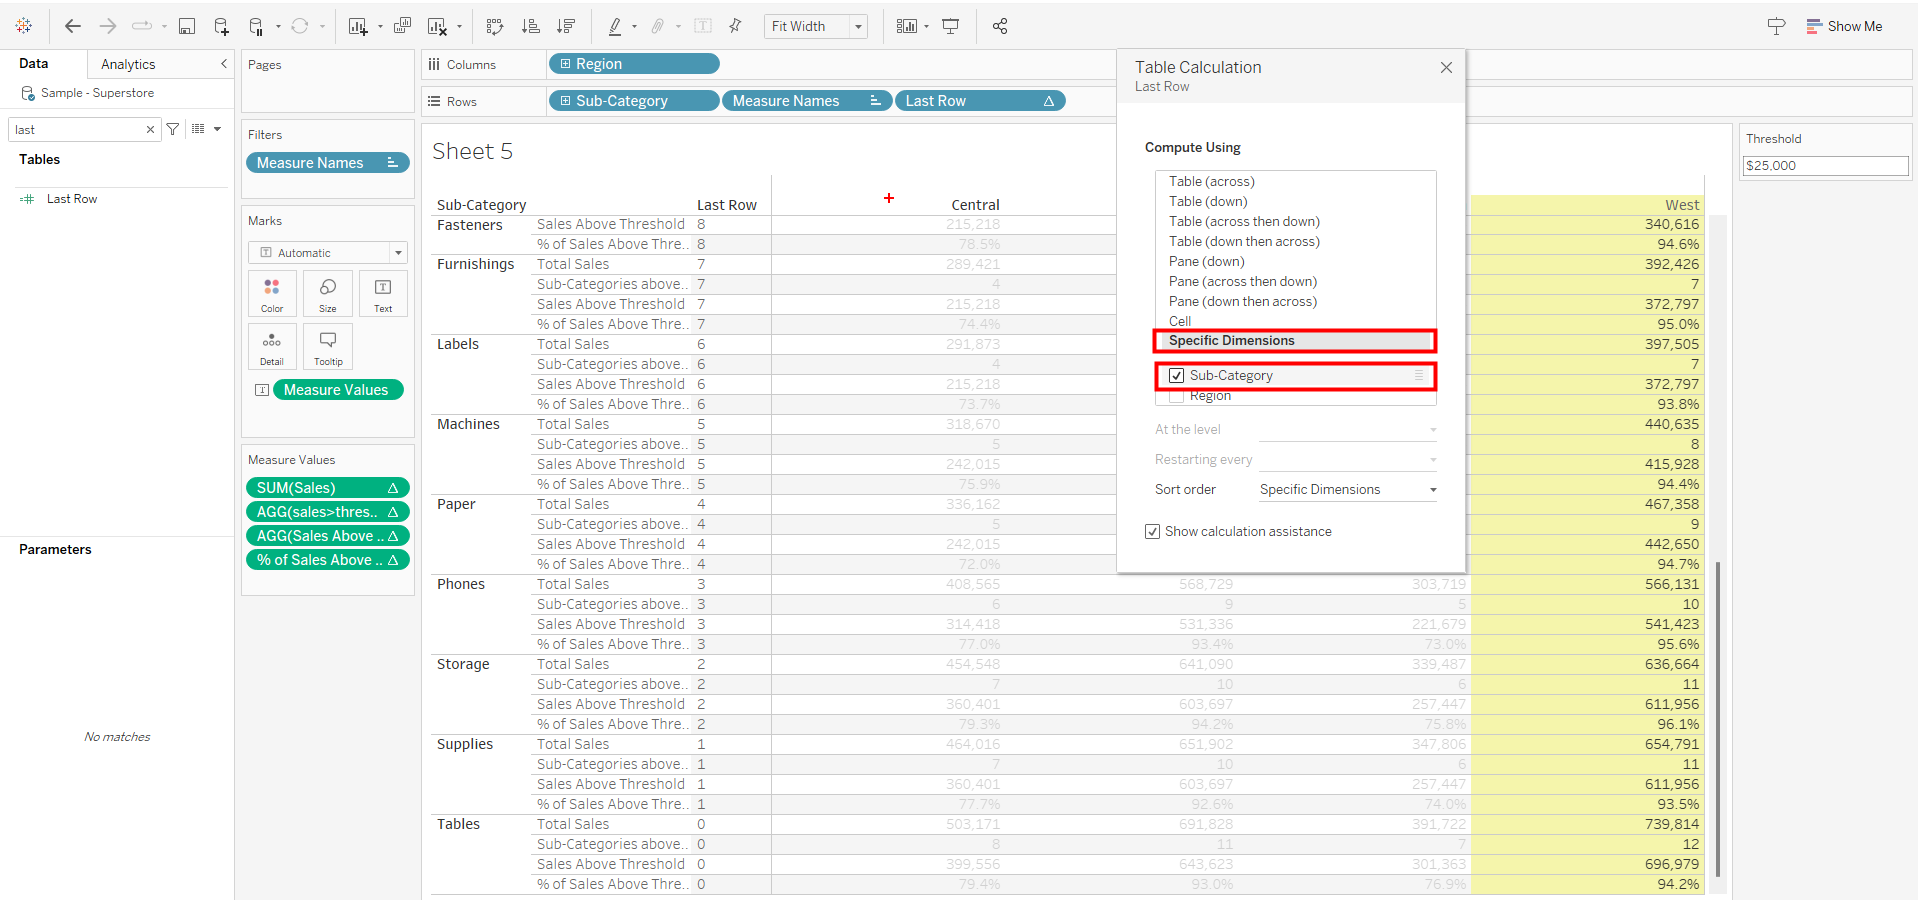
This now gives us a new view with the last row assigned values of 0.
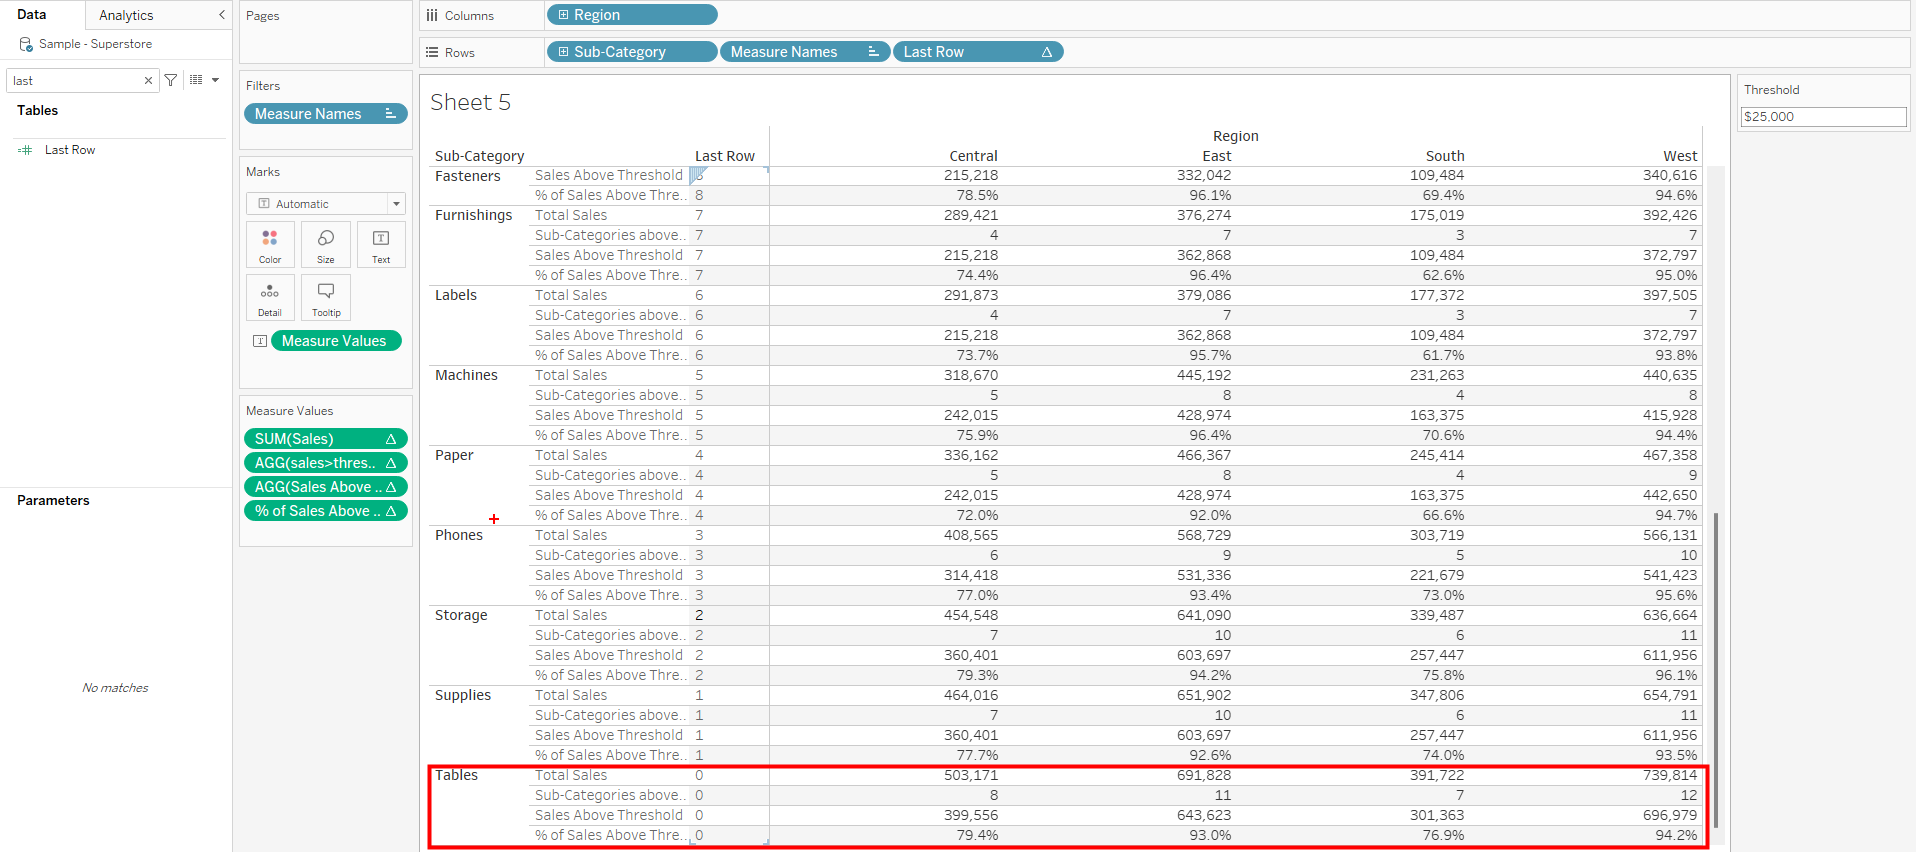
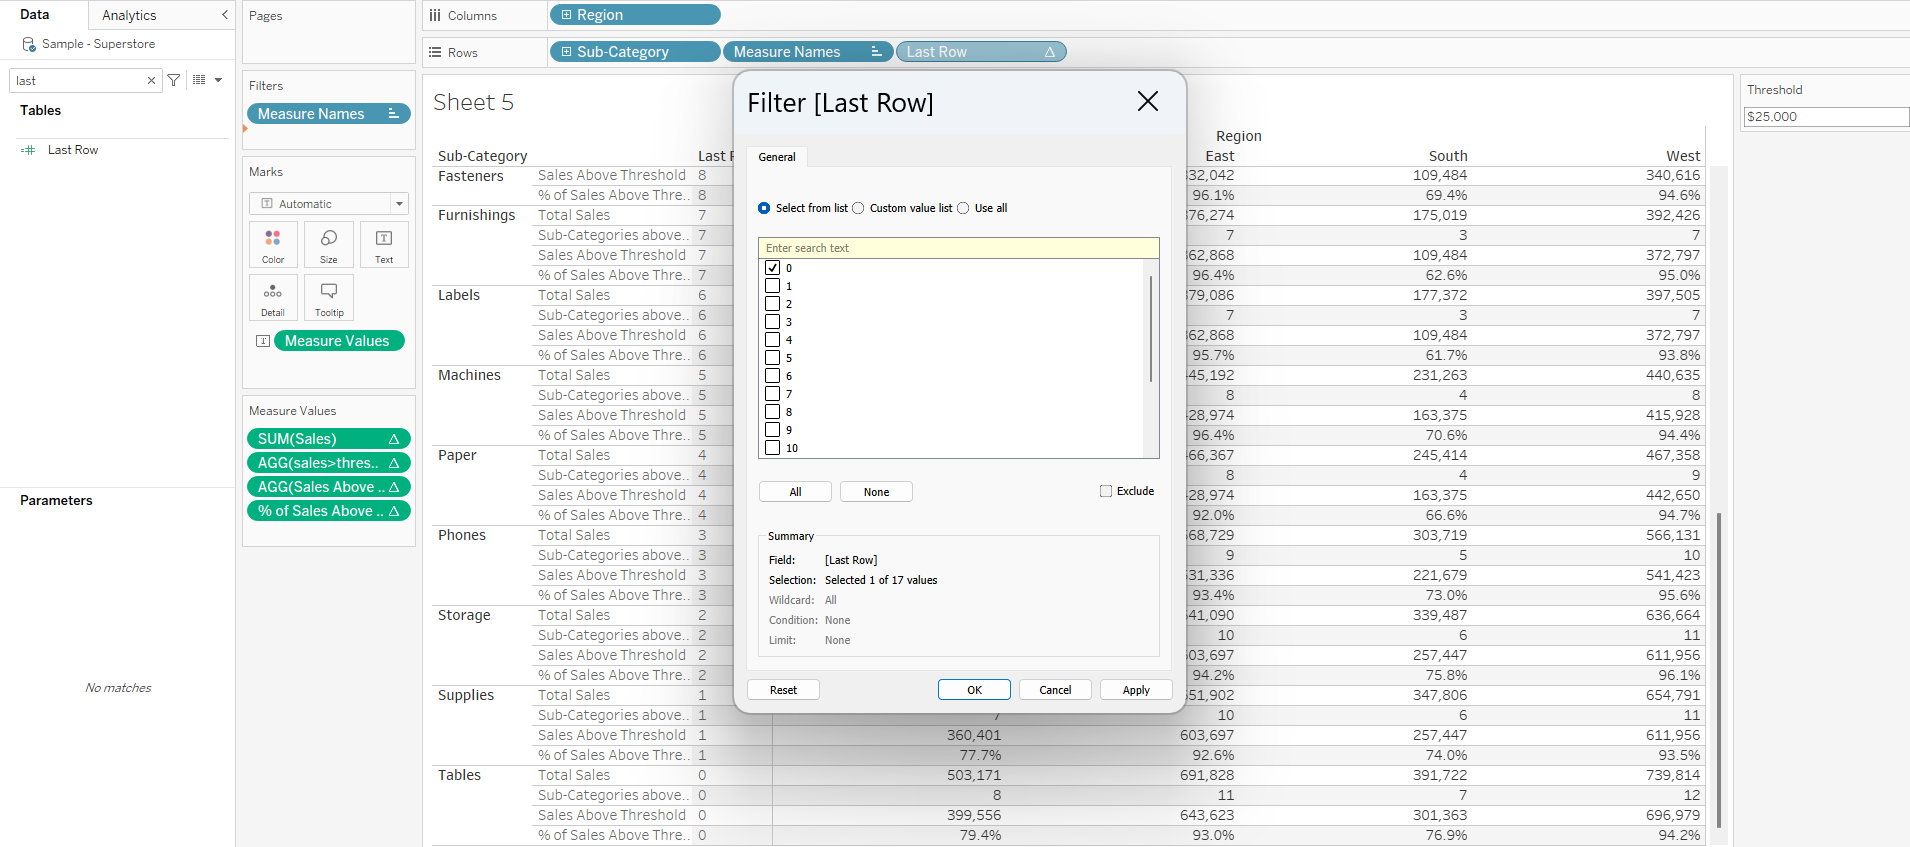
We can now drag last row from row to filter and select 0.
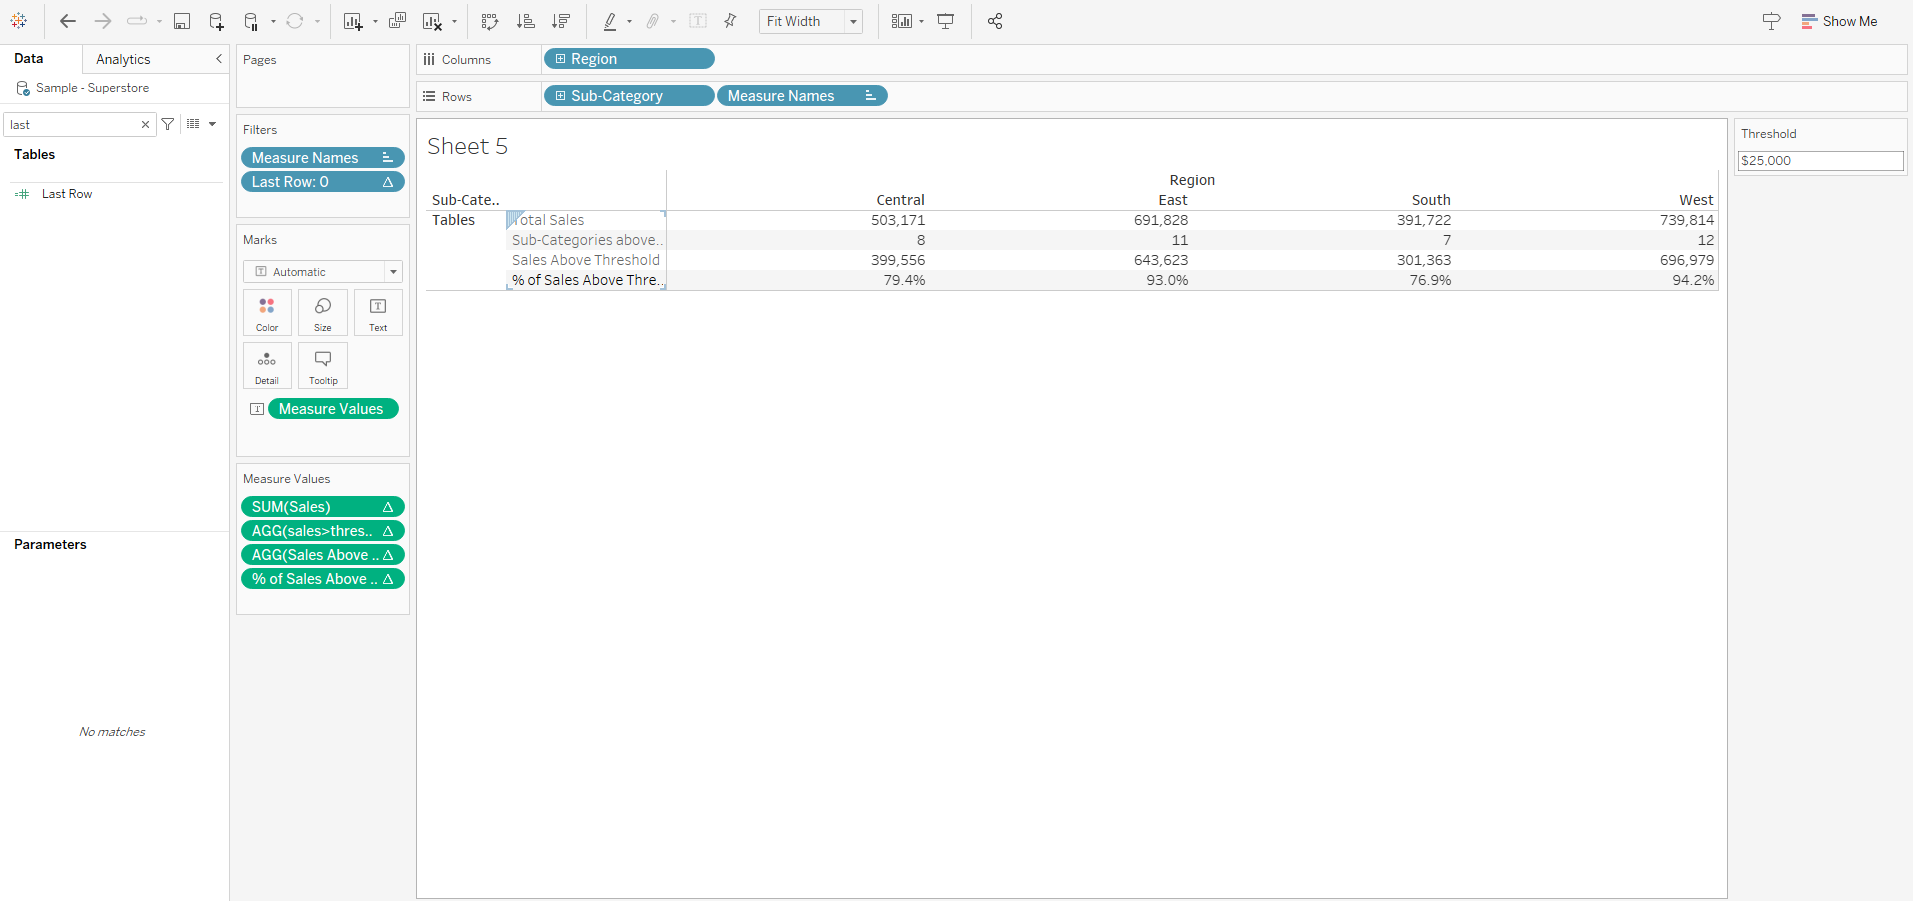
Lets take out sales from the measure values shelve.
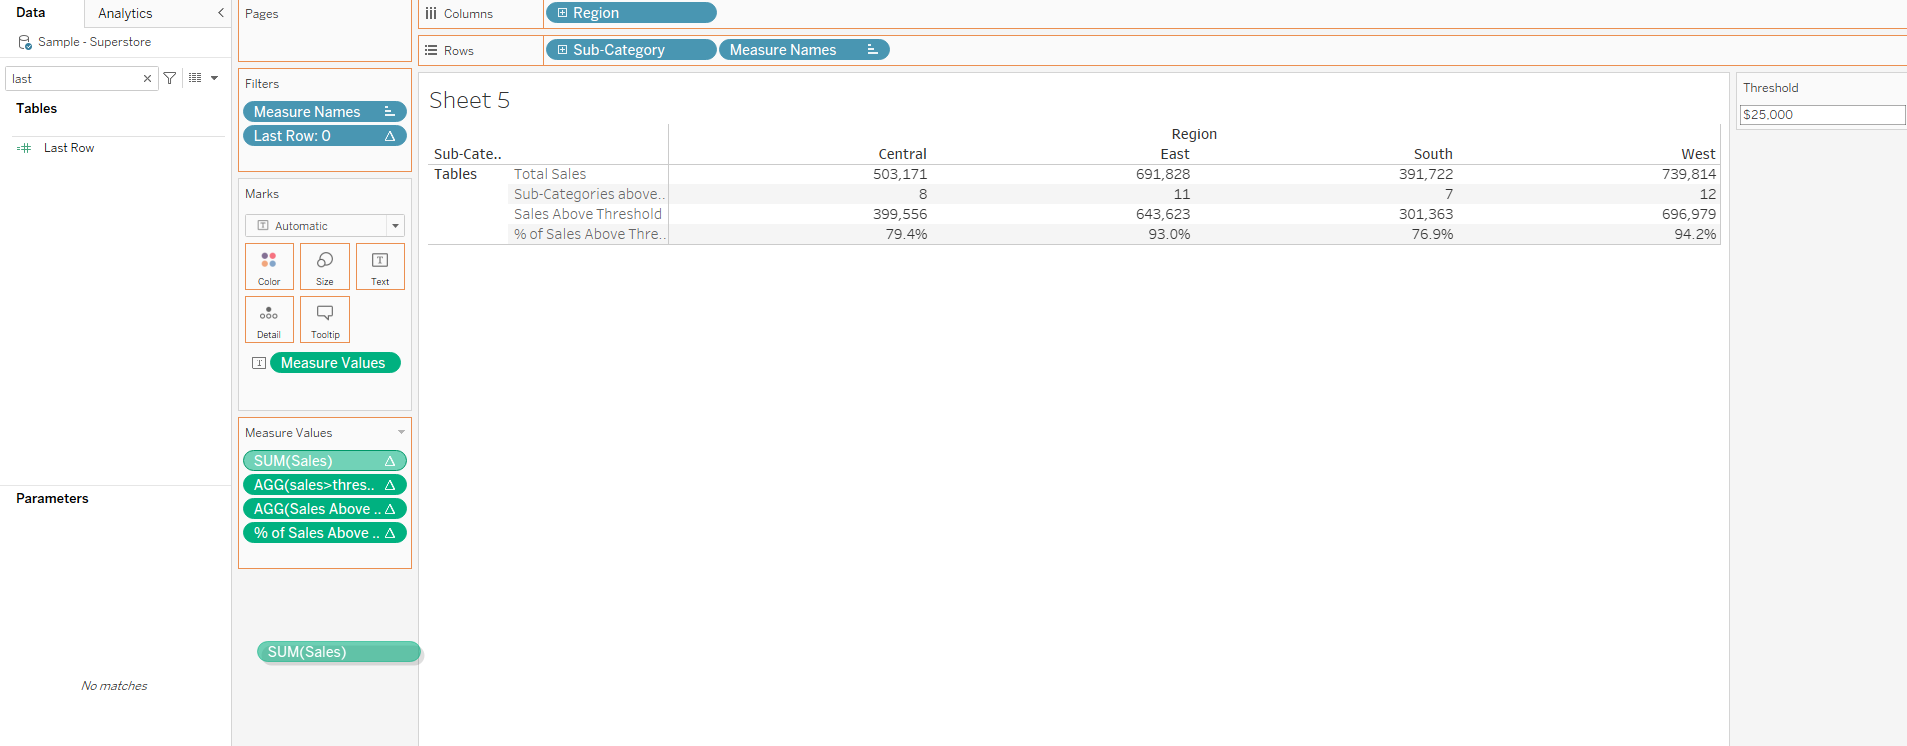
Click on sub-category drop down and untick show header.

Show entire view.

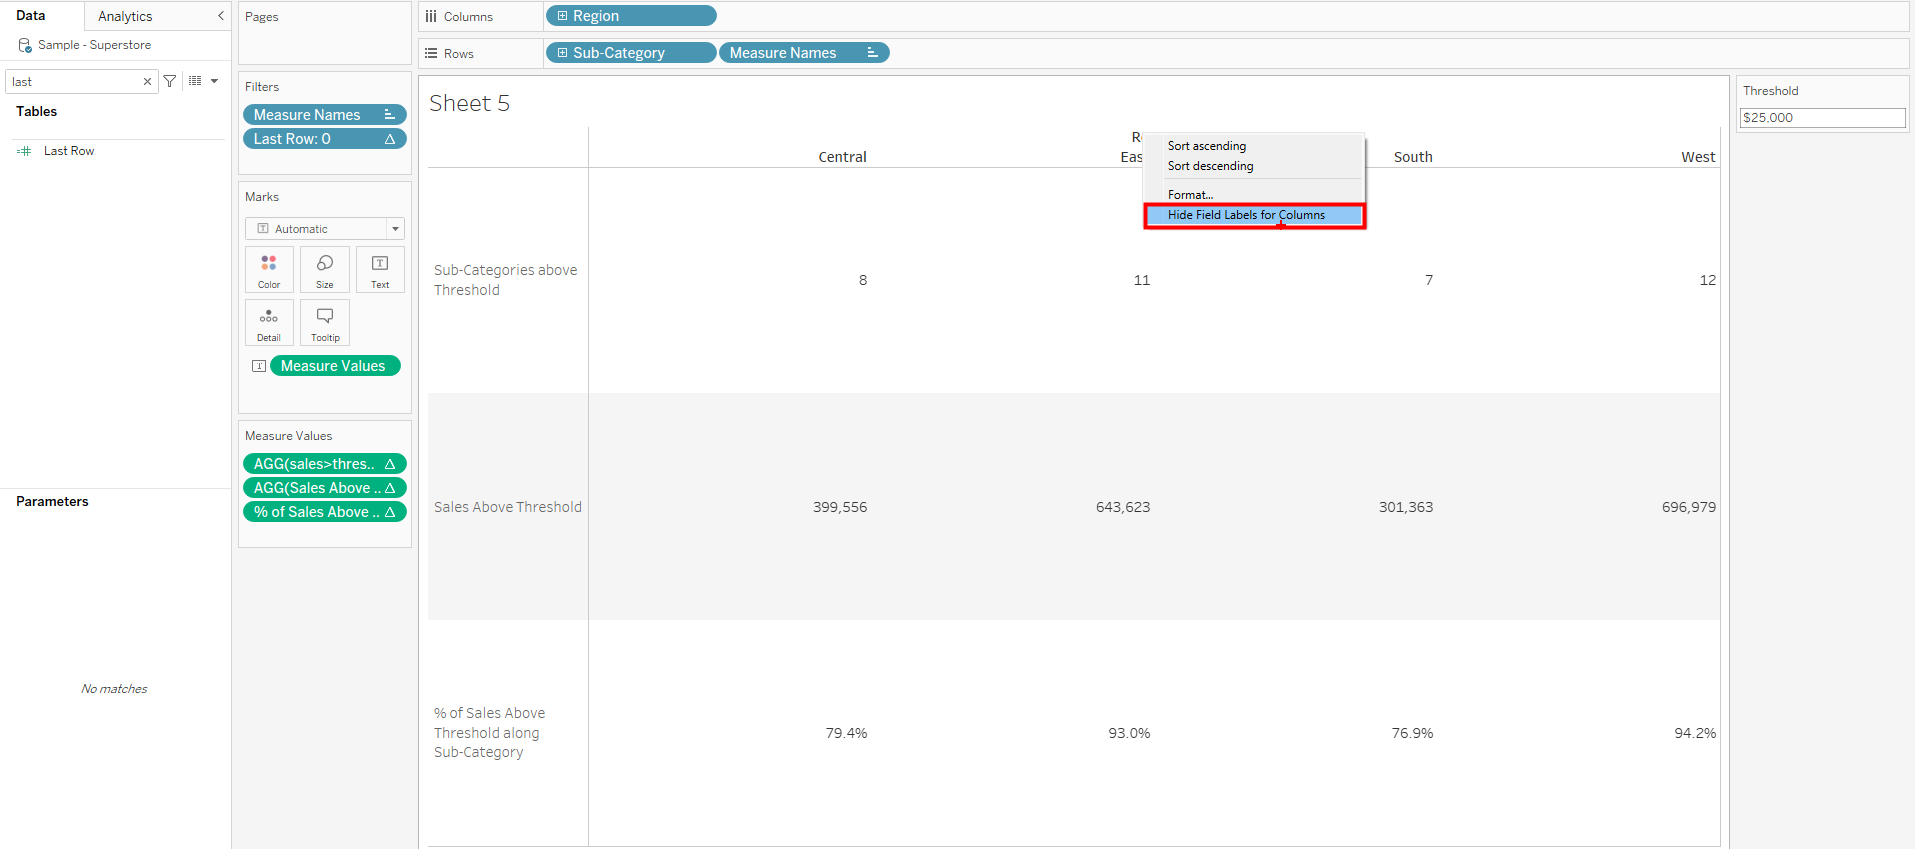
Right click on regions and hide field labels for column.
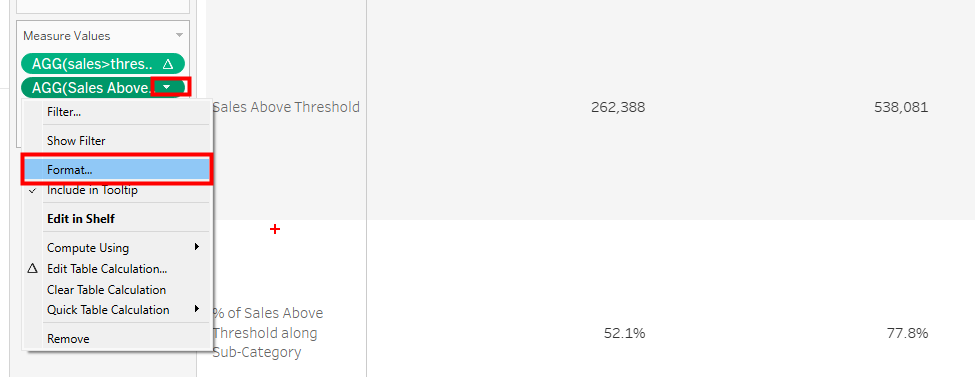
Click on Sales Above Threshold and format default numeric value to currency show $ prefix and 0 decimals.
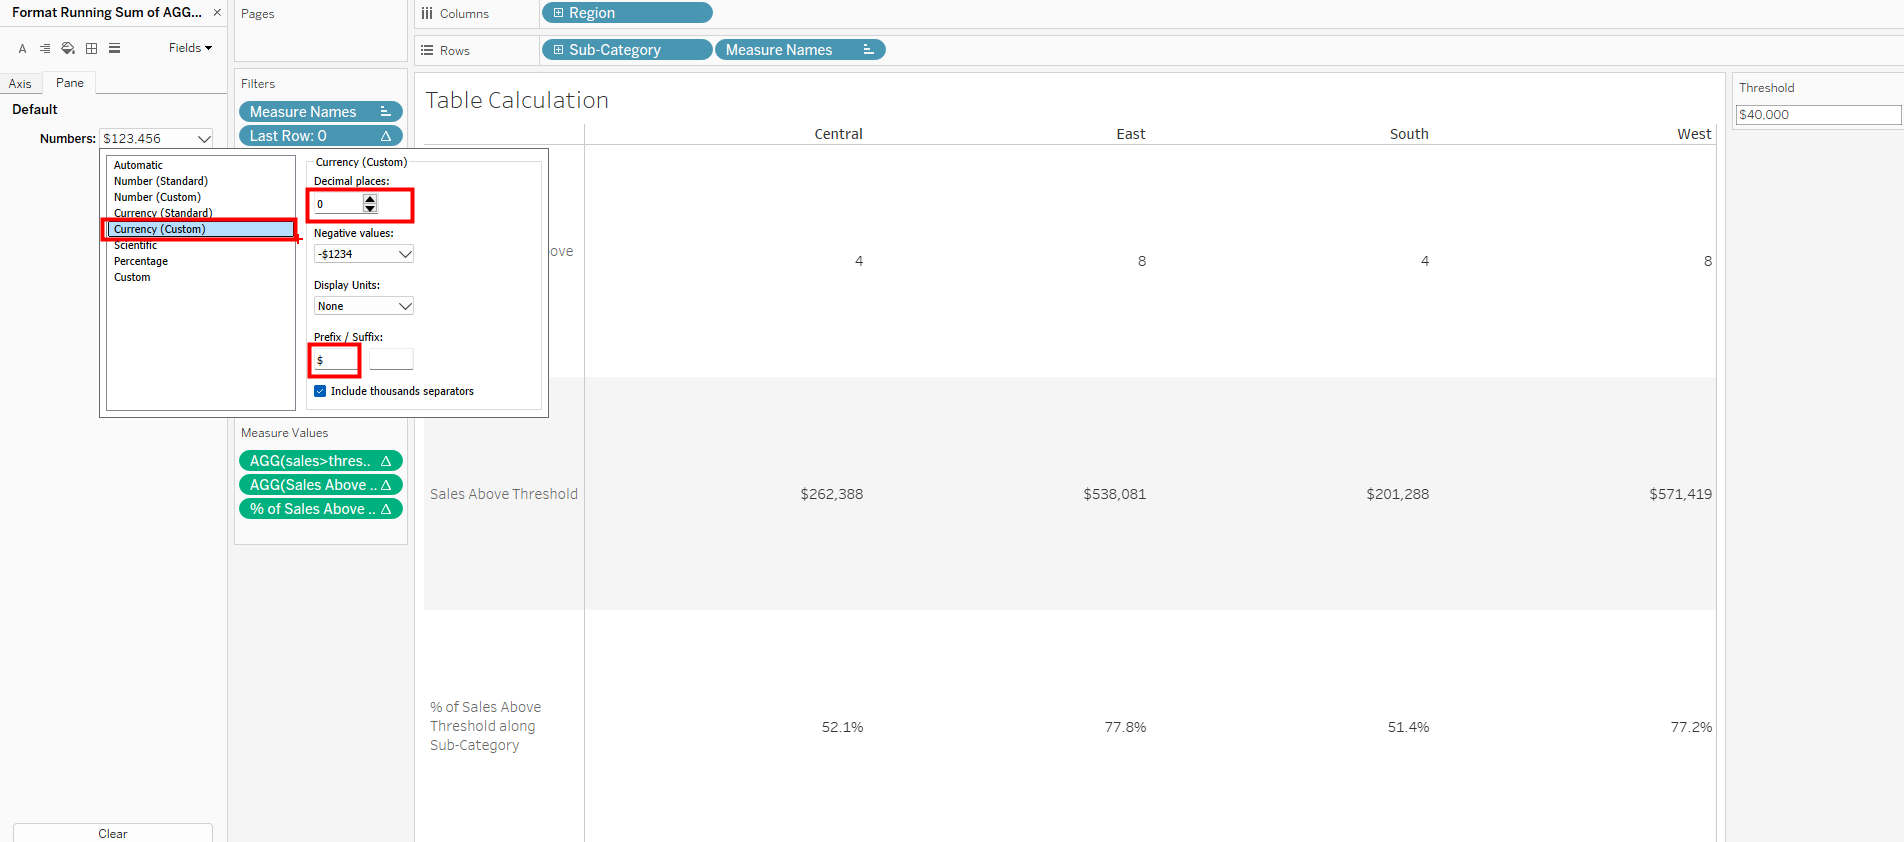
Problem is entirely solved pending some few formatting. The view is also dynamic since changing the threshold also changes the view.
