In this blog, I will be showing how to use a selected bar as a comparison reference to the other bars using parameter action. Using the Sample Superstore data, I will be comparing the sales value on a regional level.
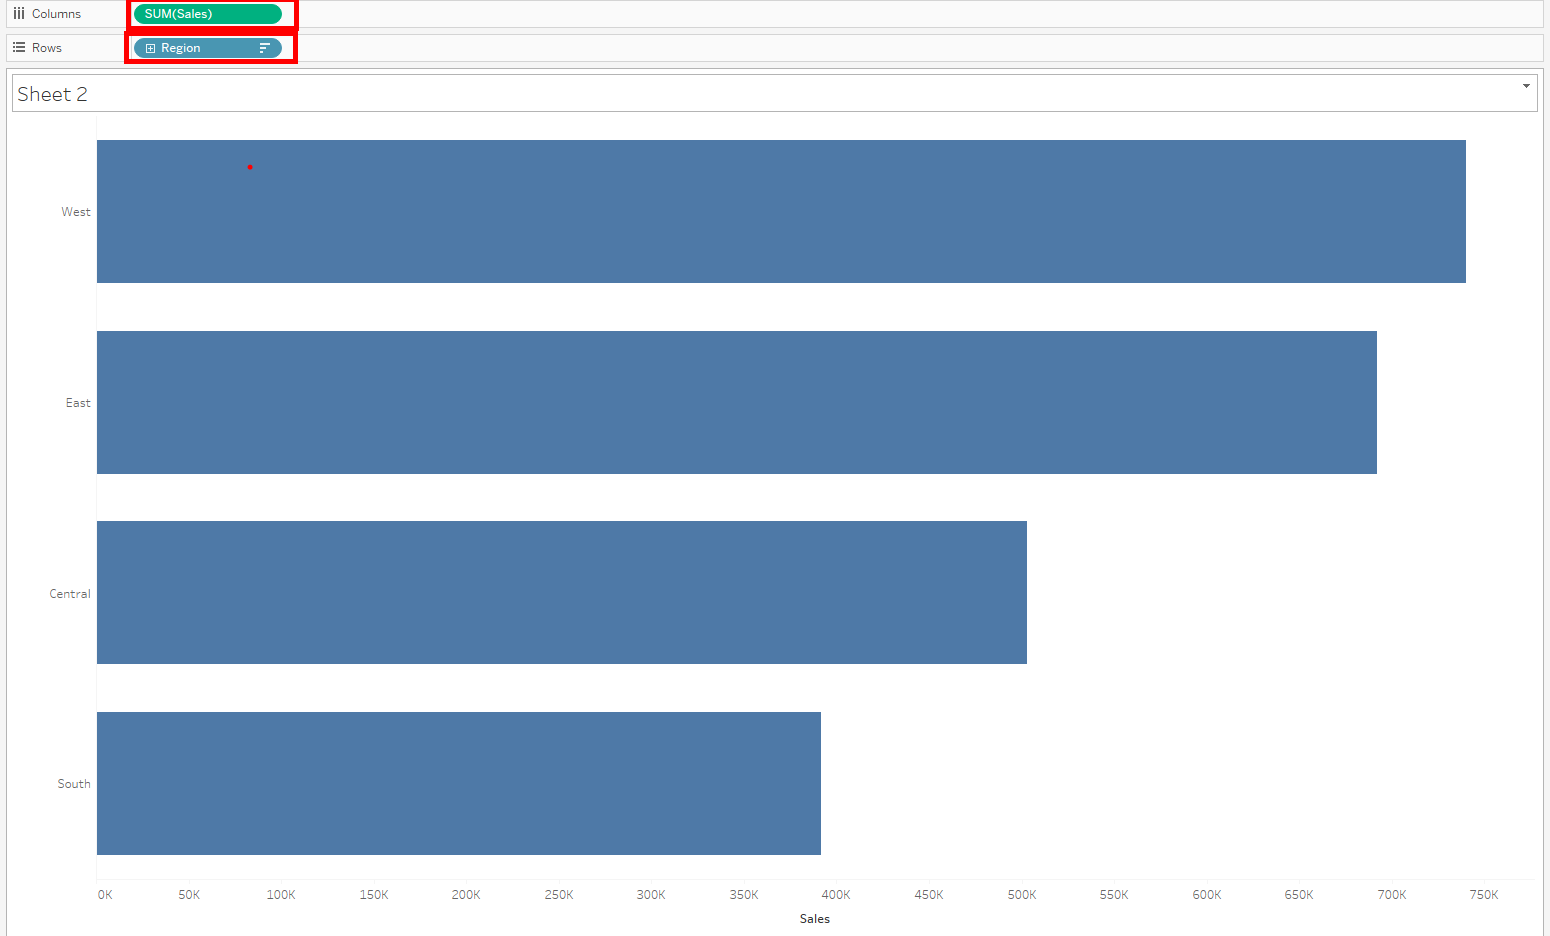
- Create a simple bar chart by dragging region to rows and sales to columns.
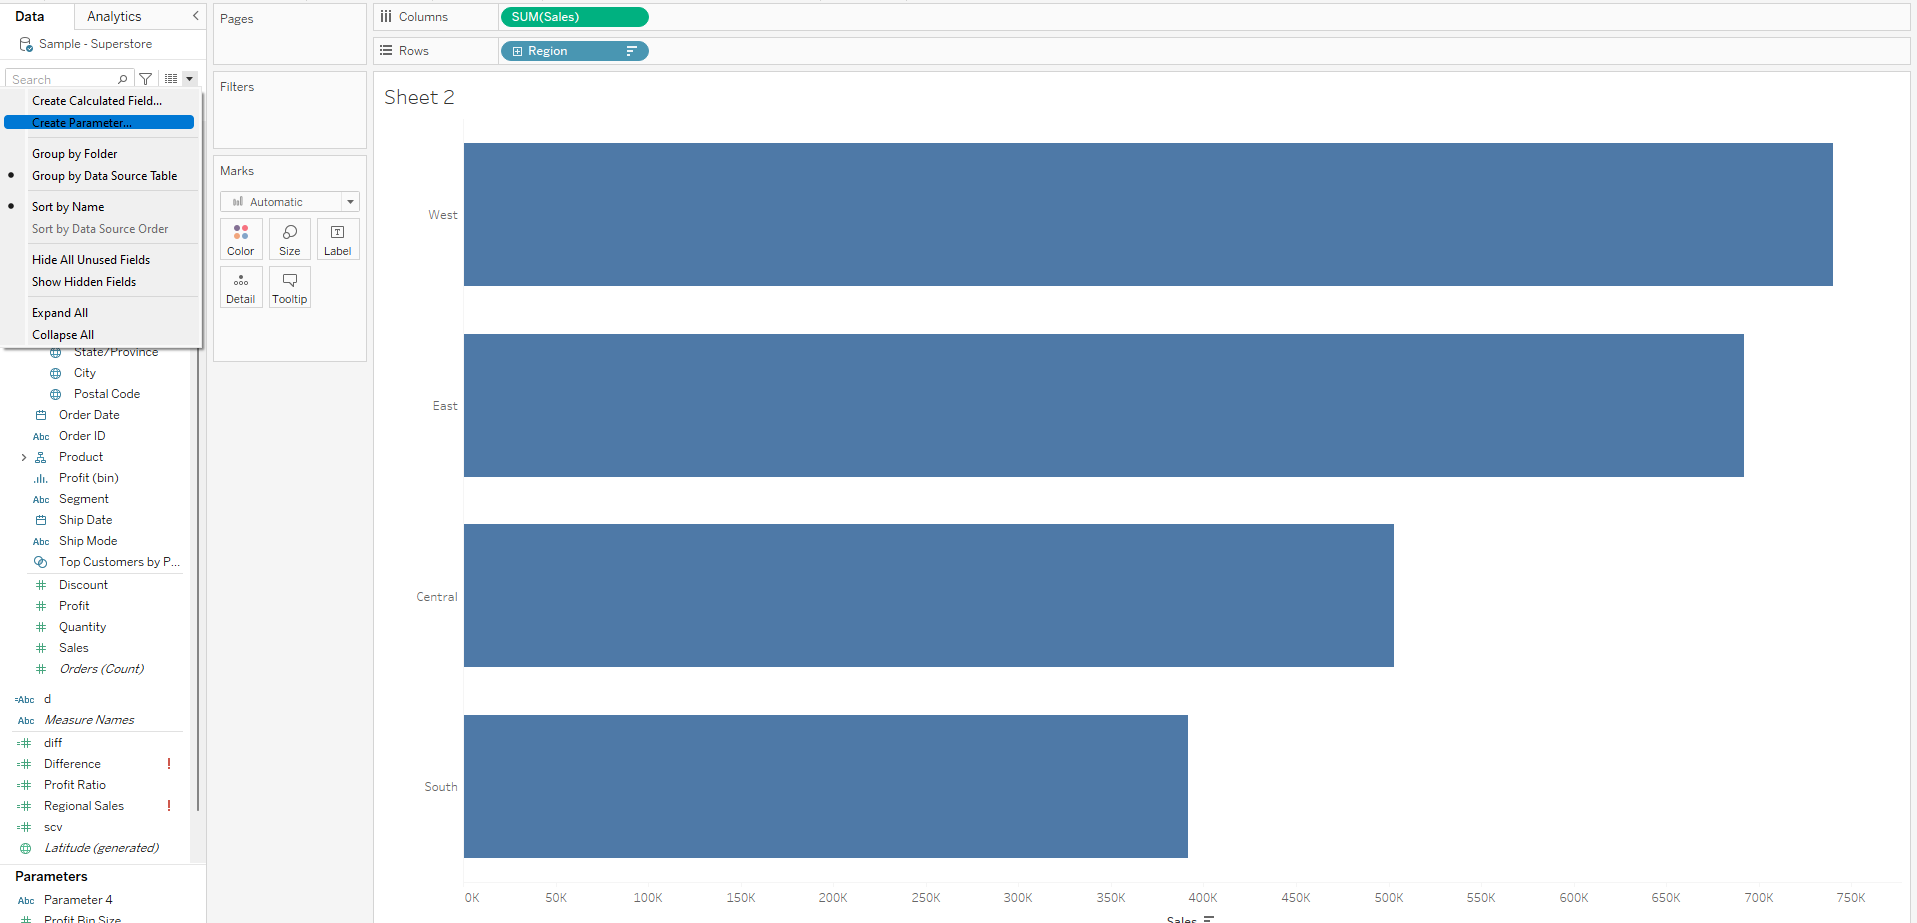
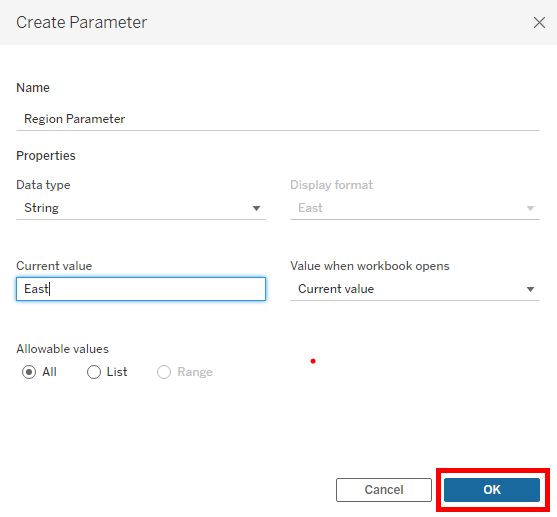
2. Create a string parameter on region and associate it to a calculated field.

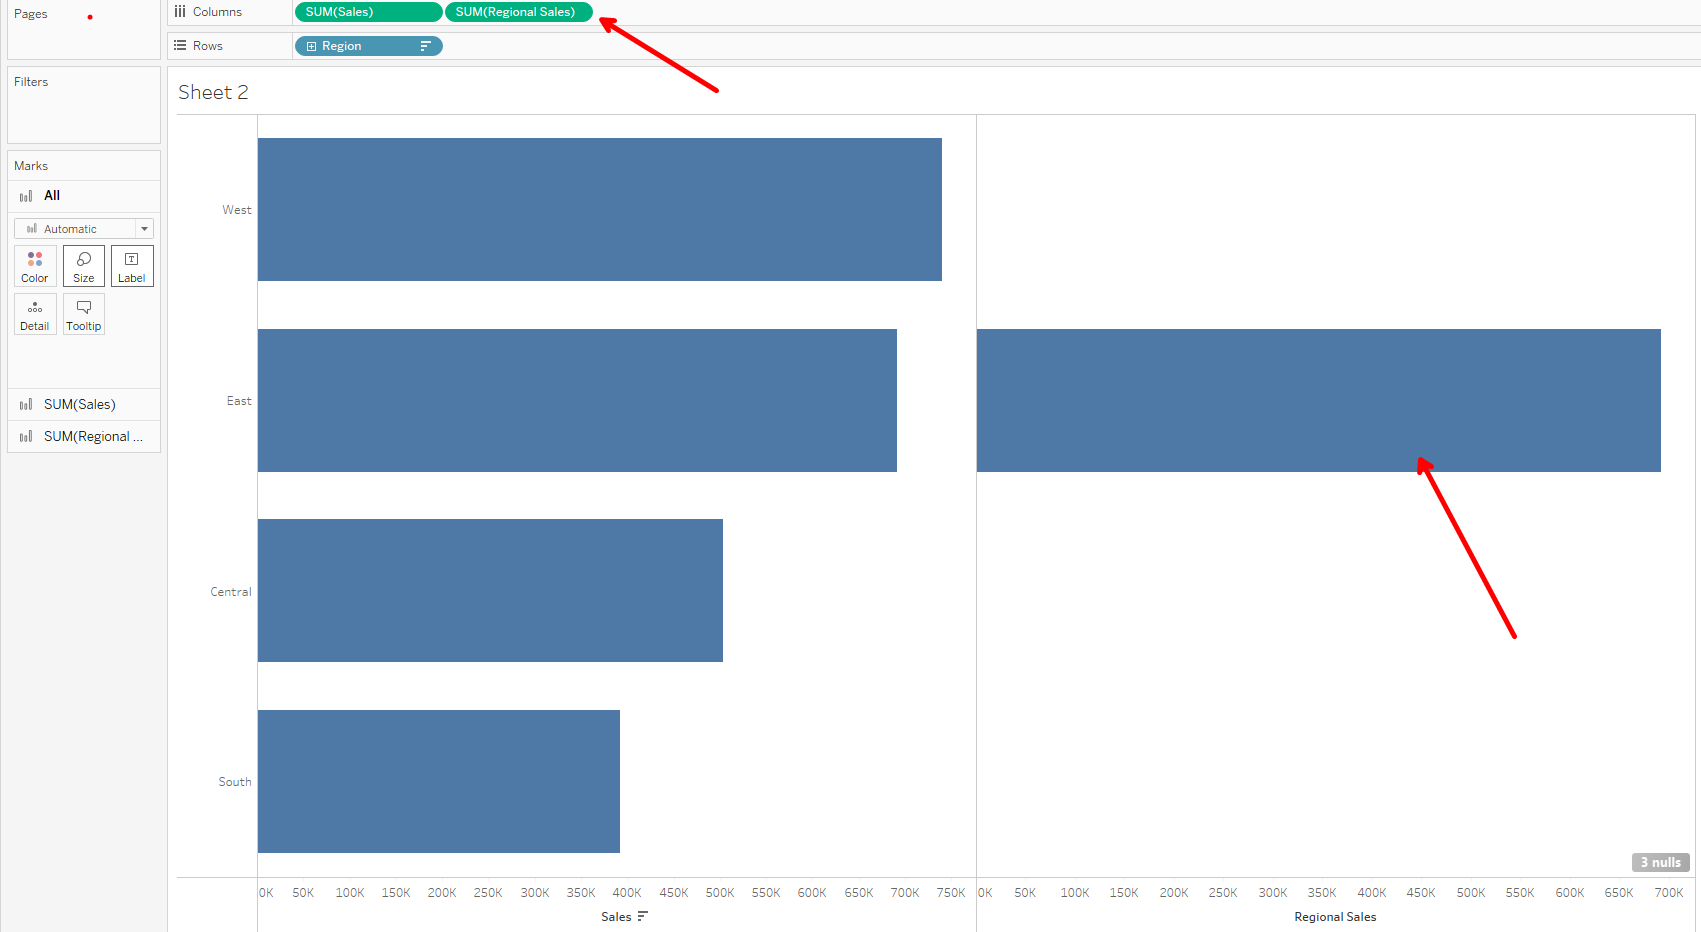
3. Dragging the calculated field above to the columns shelf shows only sales for the east region since the parameter is currently set to the east.
With this calculation and the original sales field, we can create another calculation to find the difference between the 2 values and place that on the column shelf too.

4. The result after placing the calculated field (Difference) above on the column shelf shows a zero for the east region since there is a subtraction between the marks in the red and blue highlighted areas on the east region. Since these two marks have the same value, the resulting figure in the green highlighted area is zero. On the other hand, we observe there is no value for the other 3 regions for the difference calculated field. This is because the values for these regions in the regional sales calculated field are nulls. In tableau, mathematical operations can't be performed between null values and numerical values.
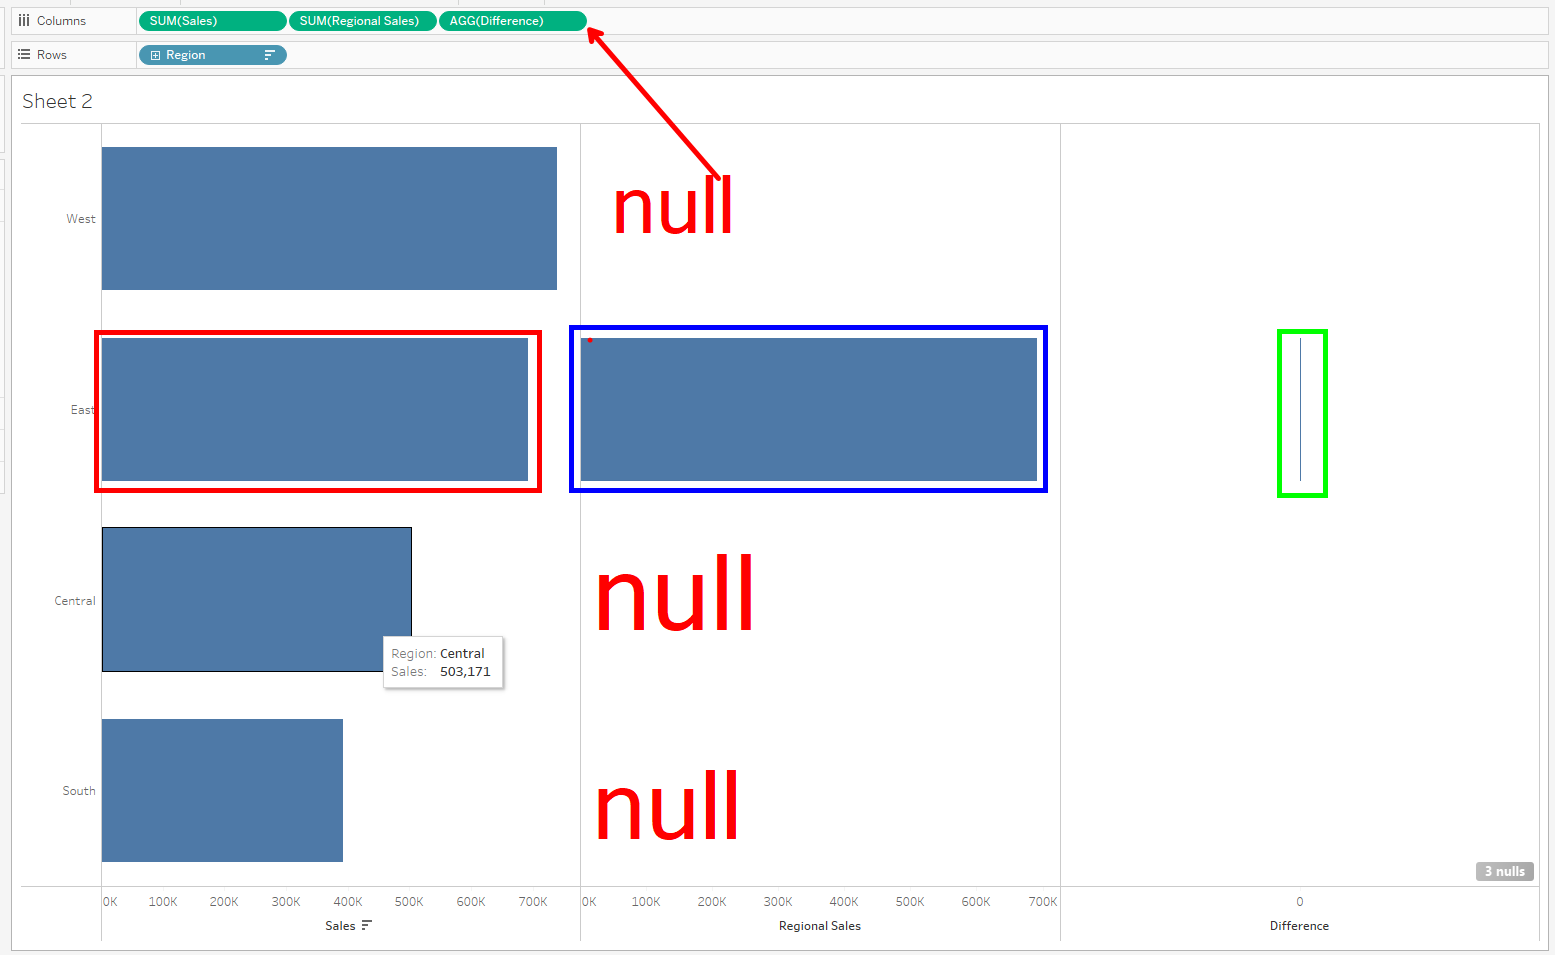
This can be corrected by using a level of detail expression on the regional sales calculation and also taking care of unseen null values with the ZN function.
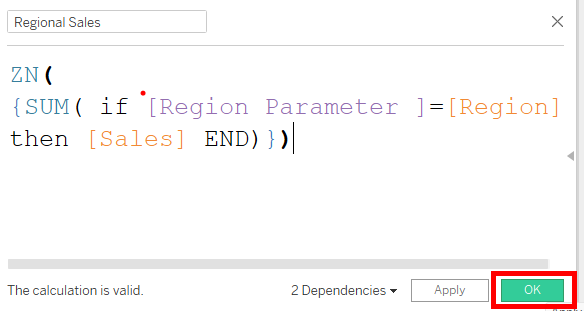
By altering the Regional Sales calculation and clicking on apply, the whole viz changes to take off null values and also populates the chart for the difference.
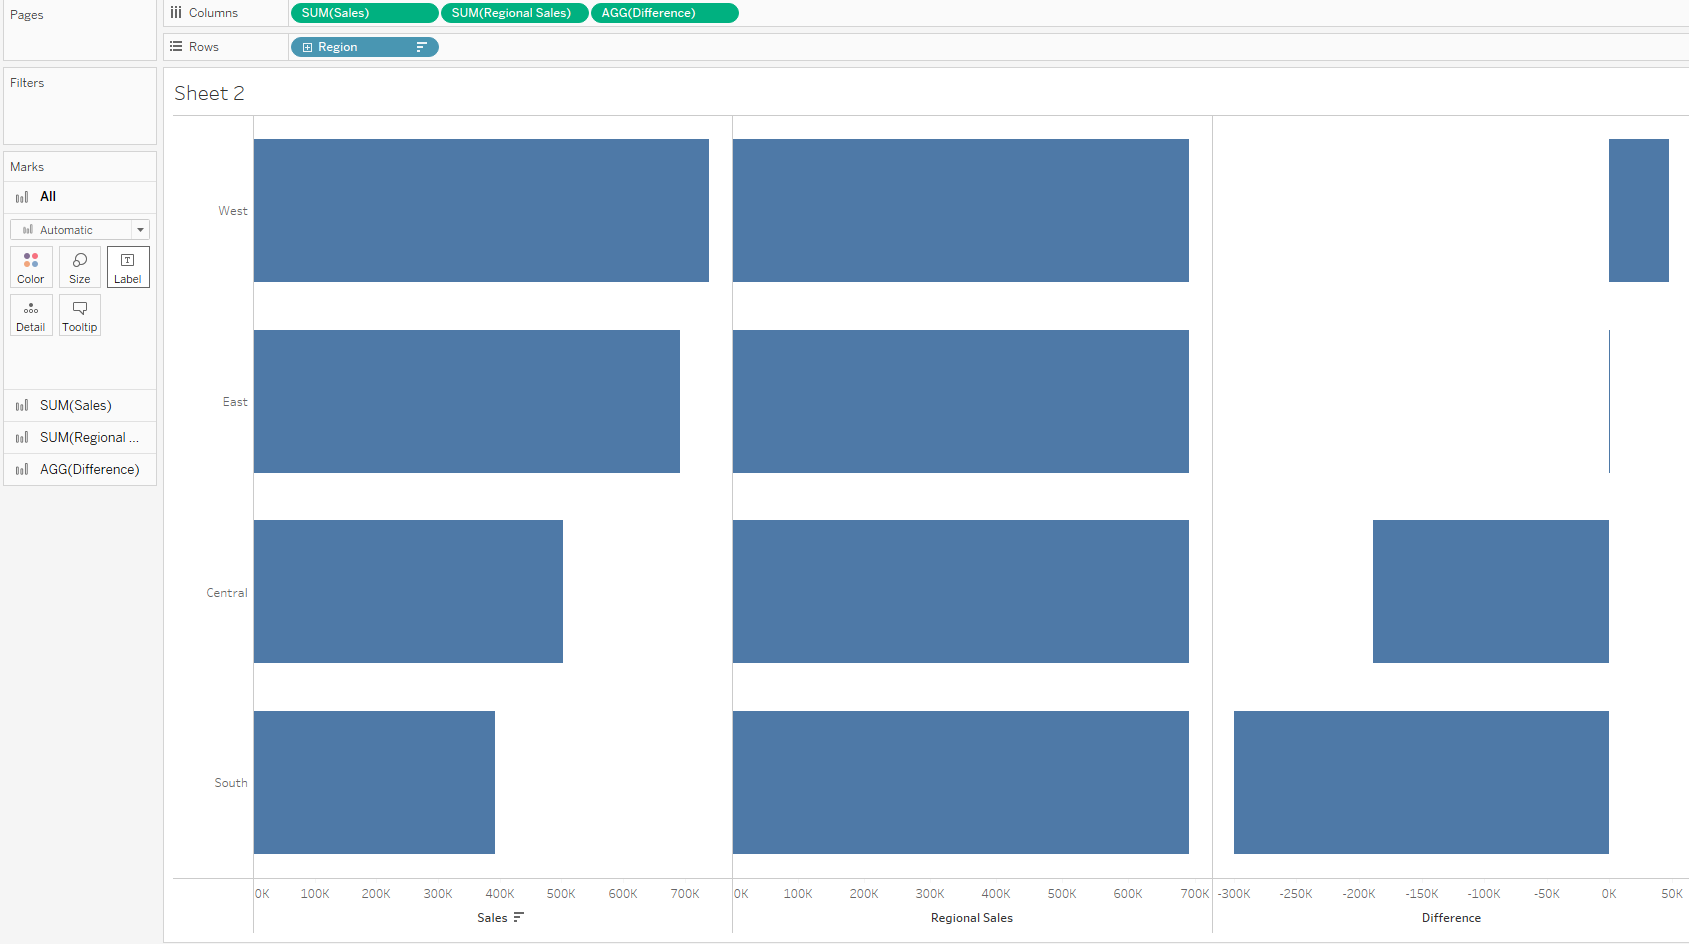
5. We can now take off the sales and regional sales fields from the column shelf leaving the difference and create a parameter action.
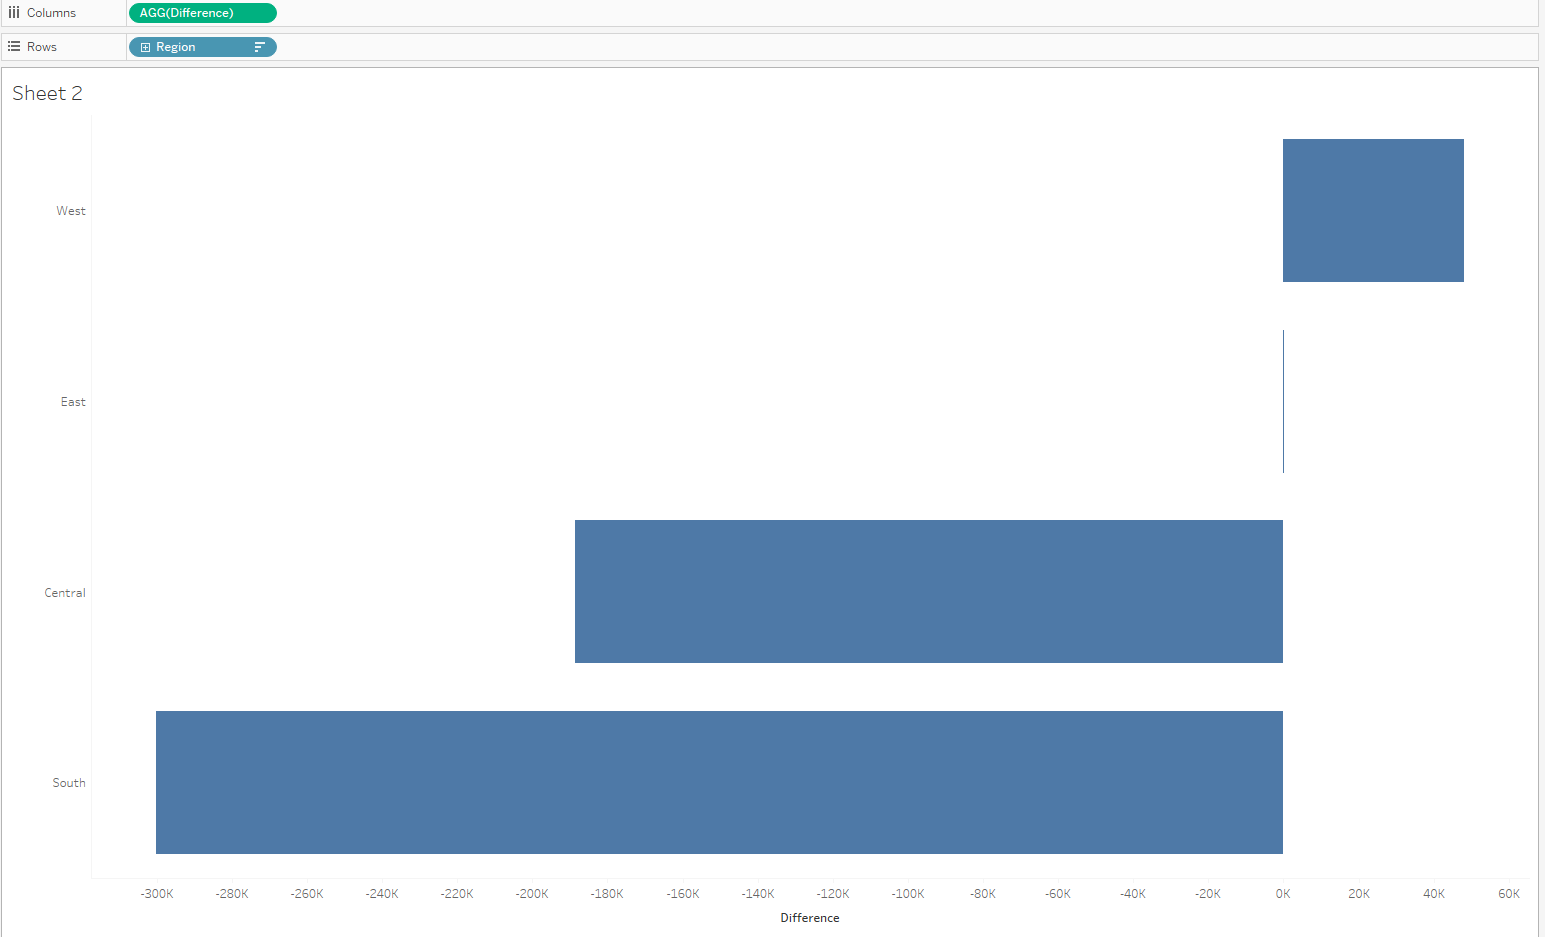
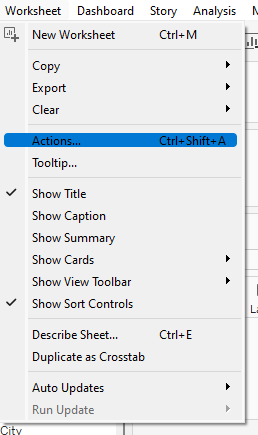
To create the parameter action, click on worksheet, actions to bring up the actions window.
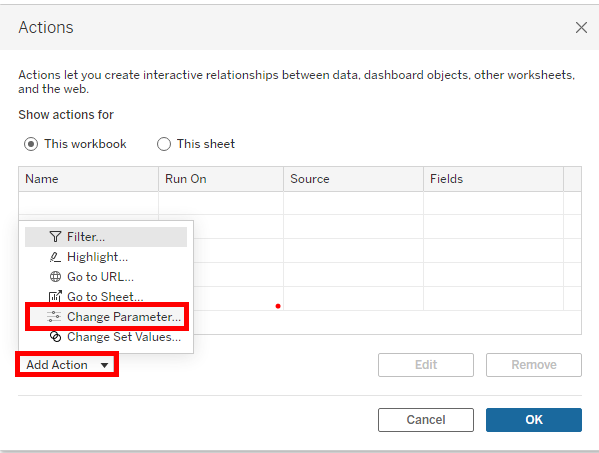
In the window, click on add actions, change parameter for a new pop up.
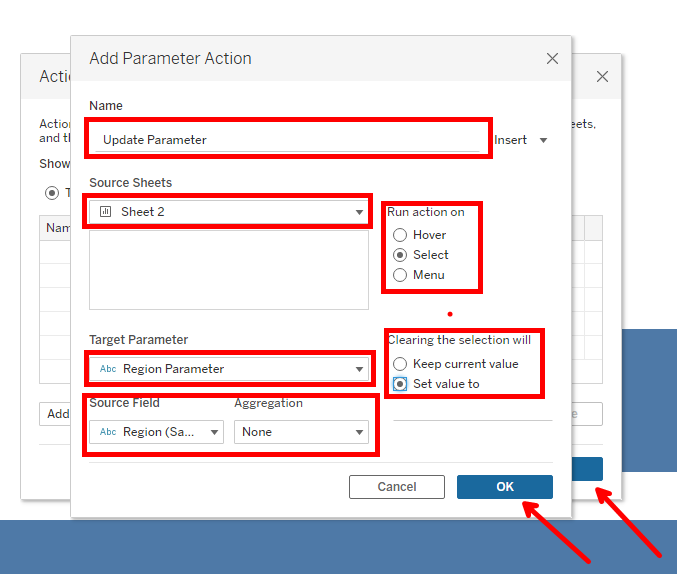
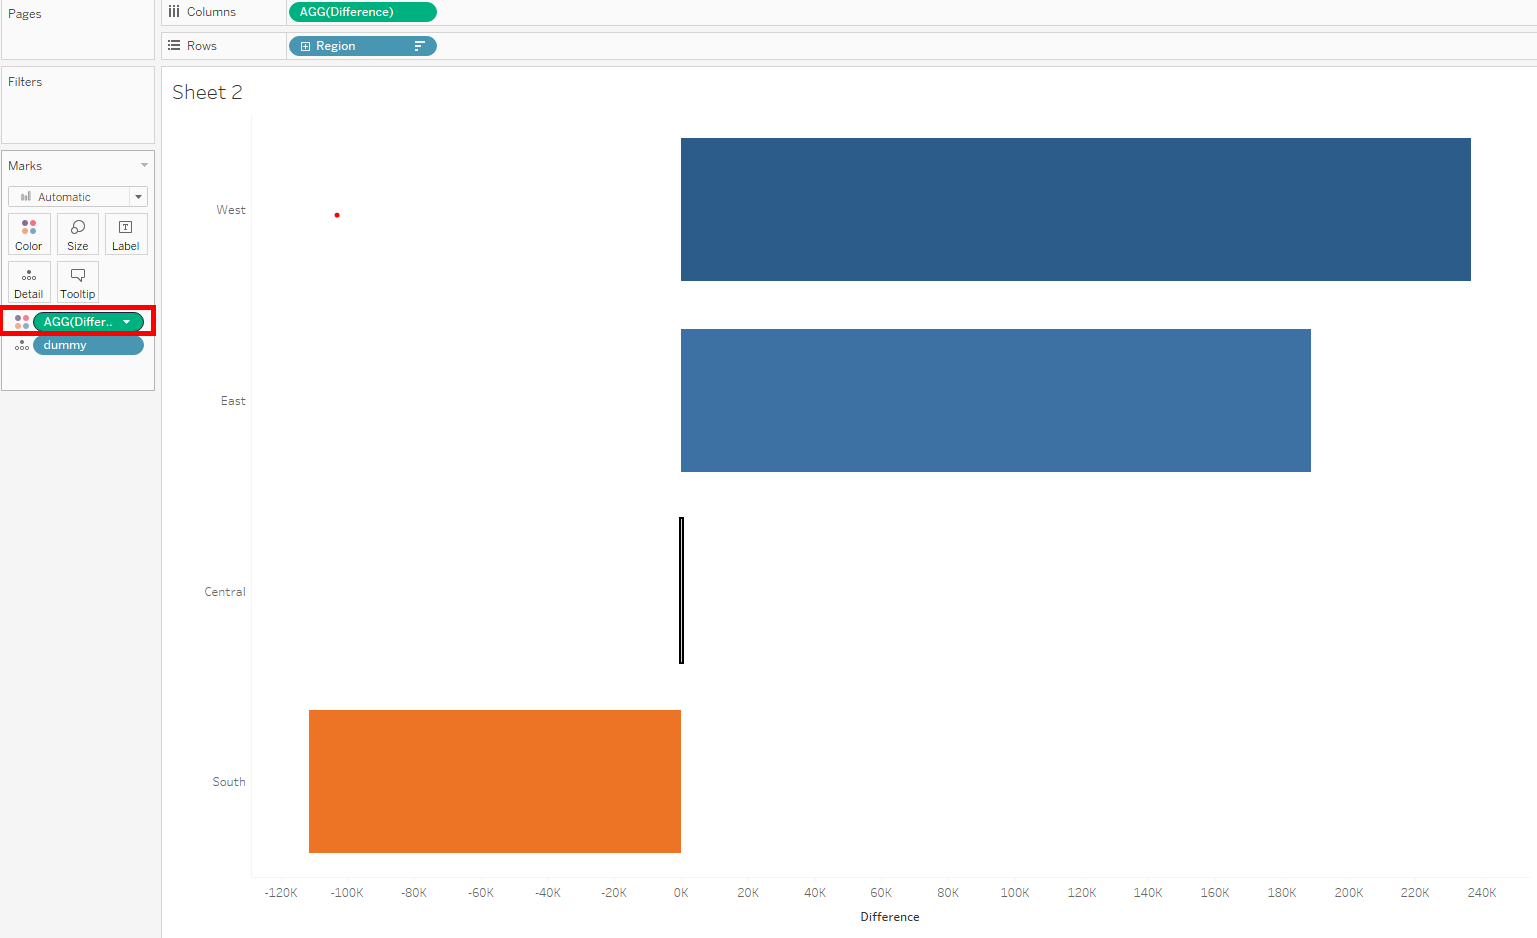
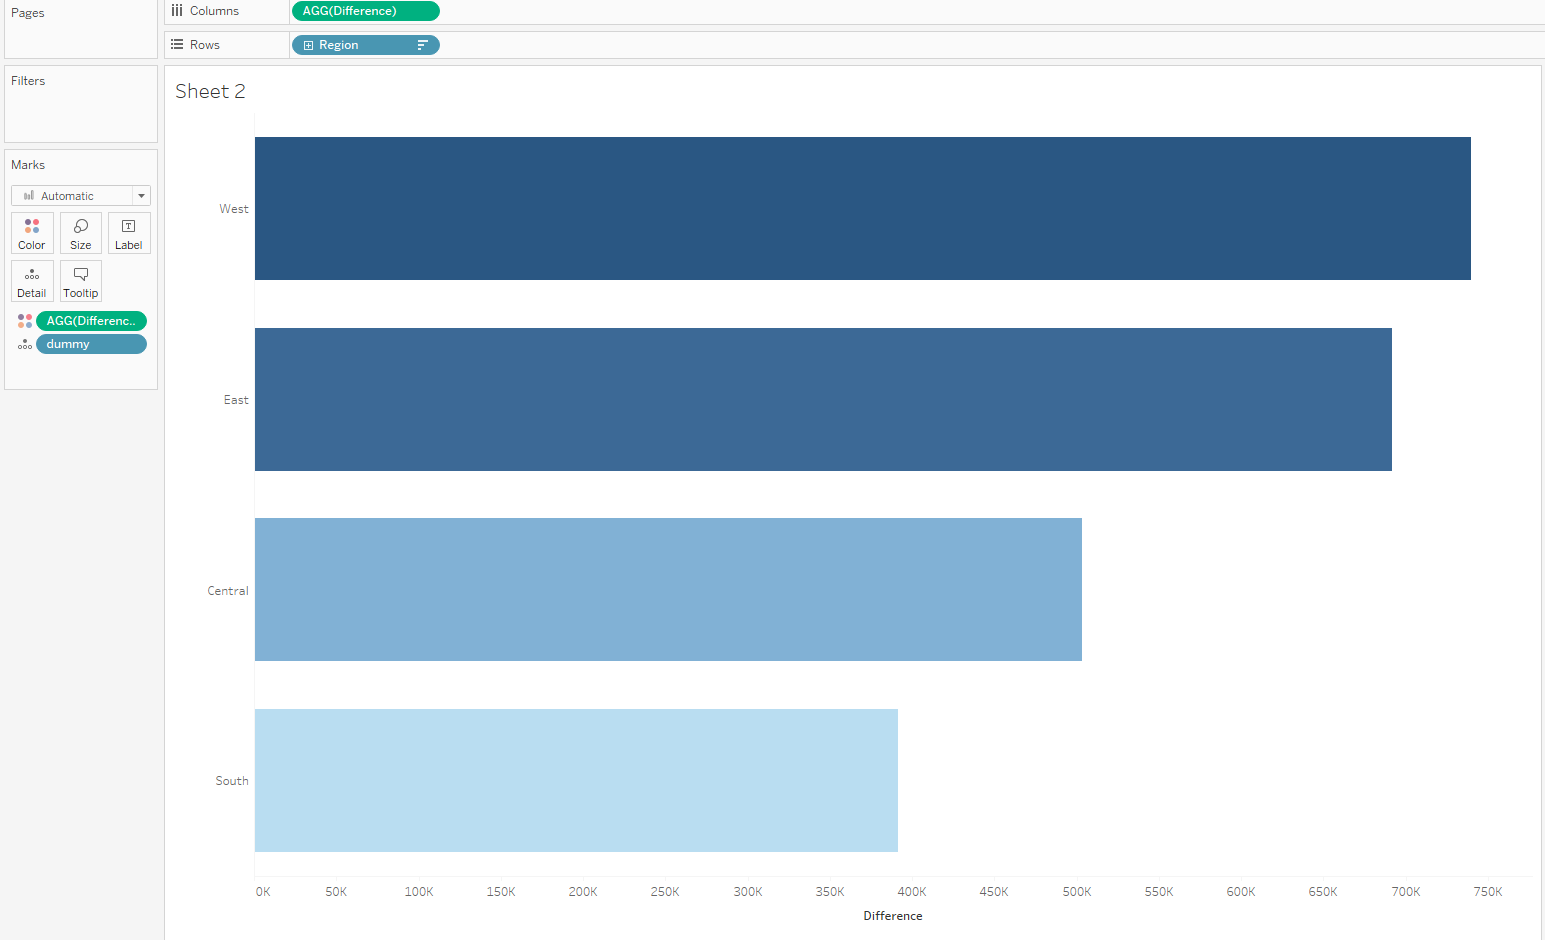
Give the parameter action a name, run action on select, select source sheet, select target parameter, select source field and set value to none when selection is cleared. Click ok and also on the window beneath. After these steps, the parameter action will allow a click on each bar to compared to the other bars and itself. Clicking out of the bar will give the individual sales bar for each region.
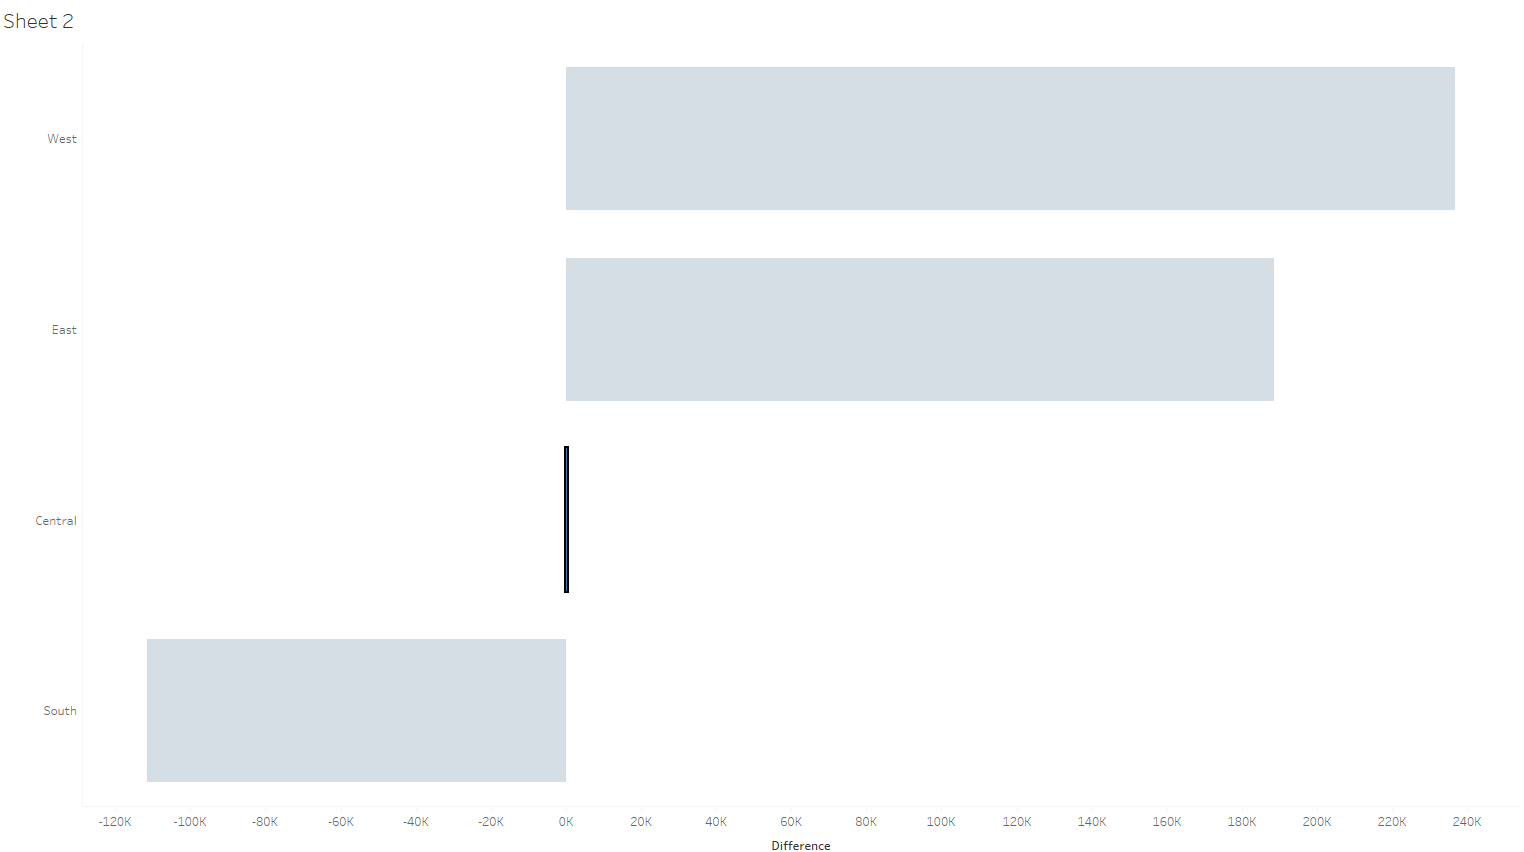
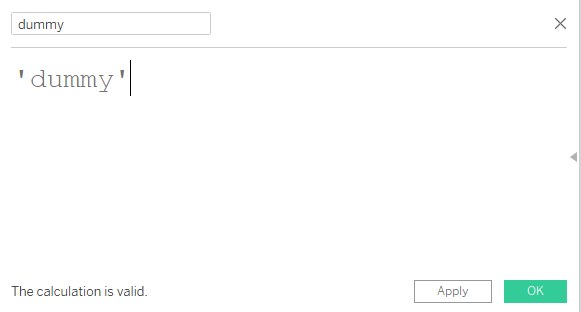
6. We observe the other bars greying out except the selected. This can be corrected by using a highlight action. To do this, first create a string calculated field called dummy and put on detail.
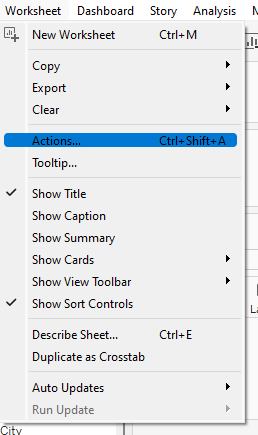
Then click on worksheet, actions to bring up the actions window for the creation of a highlight action.
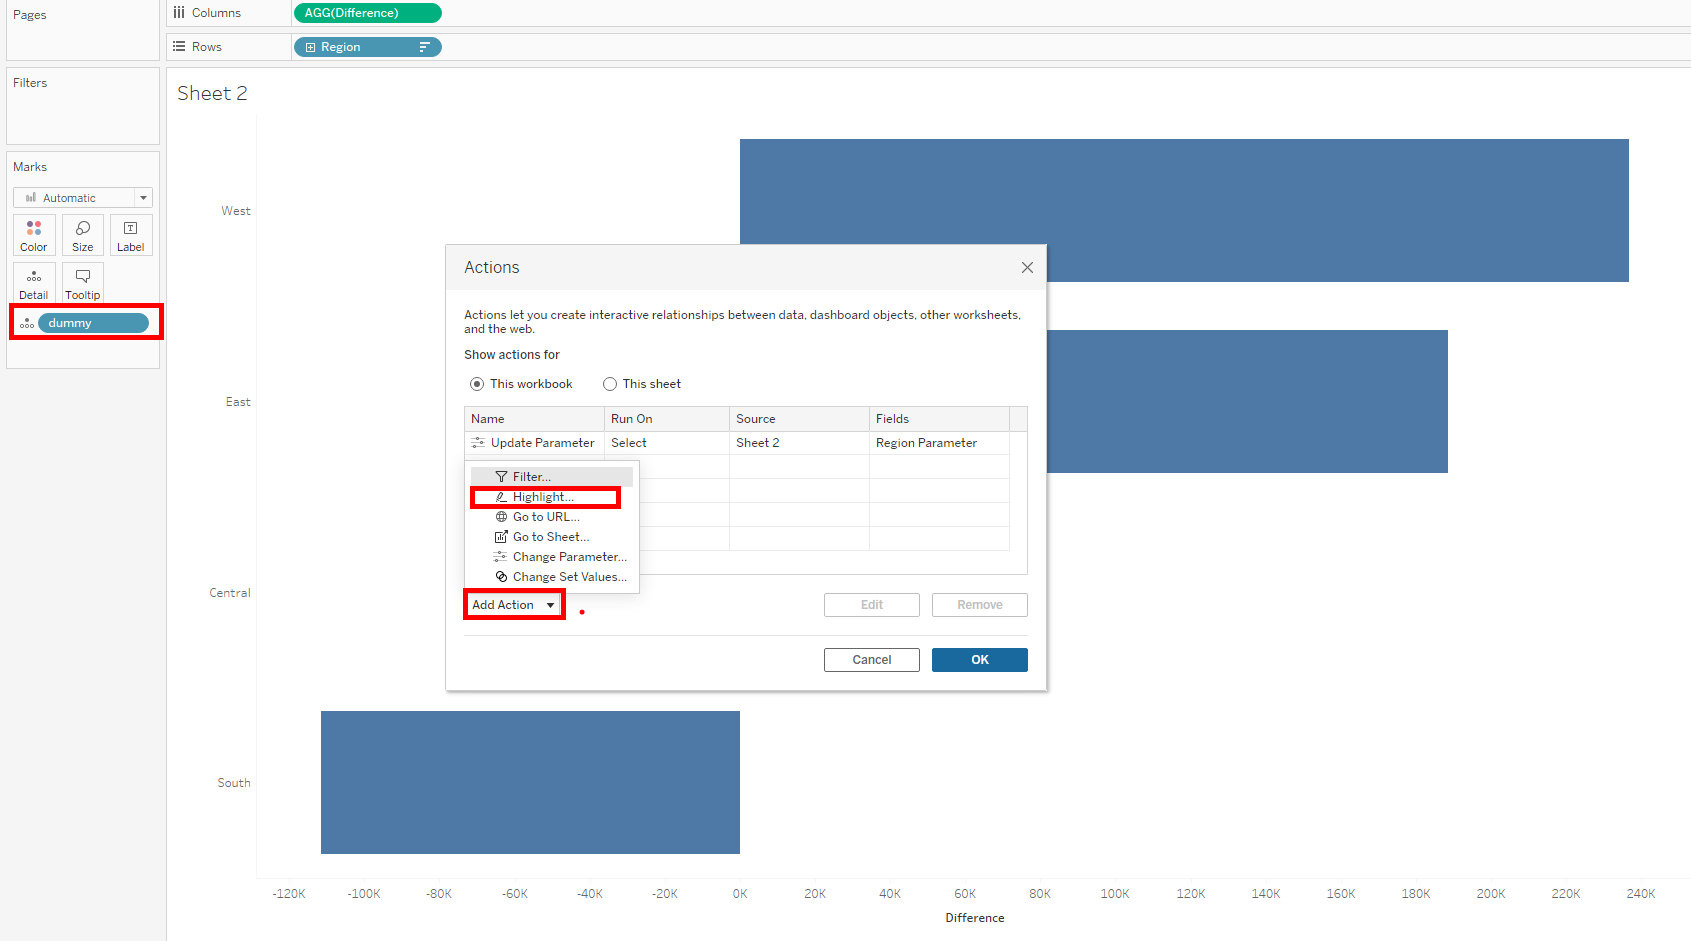
In the window, click on add actions, highlight for a new pop up.
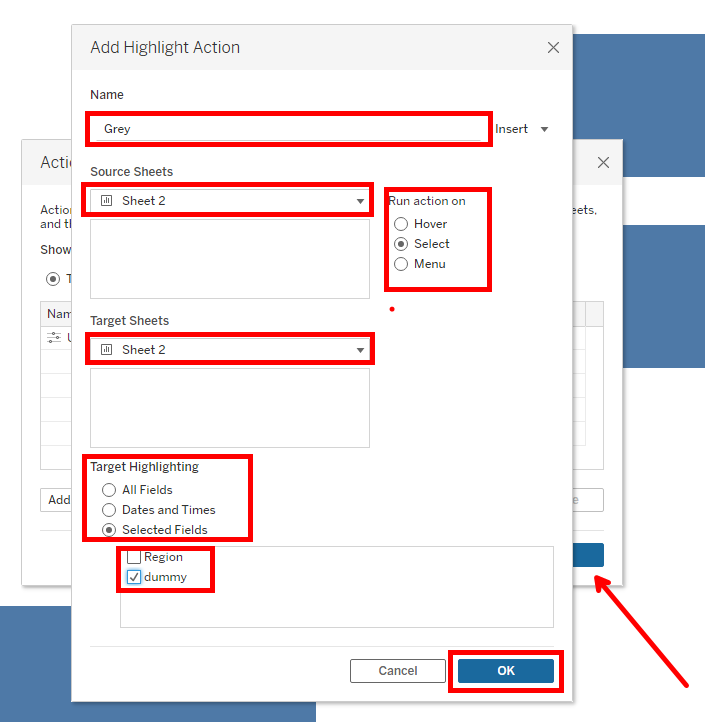
Give the highlight action a name, run action on select, select source sheet, select target sheet and set target highlighting on selected fields (Dummy) . Click ok and also on the window beneath.
We can now place our difference field on colour to distinguish negatives from positives.
I hope this tip was useful and it will help on your visualization journey. Thanks for reading.
