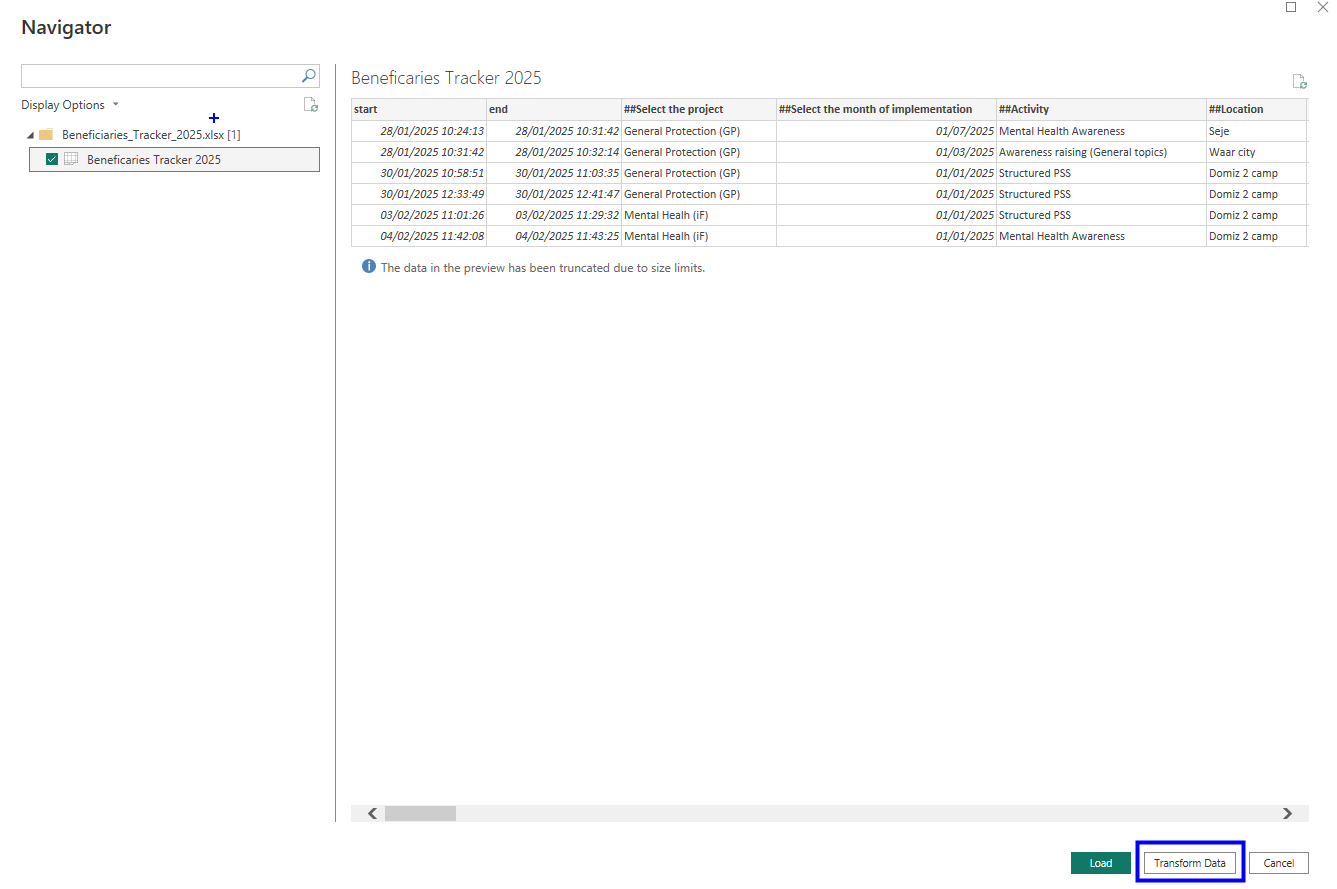
I recently had to do a piece of work for a client. Data usually needs cleaning up so I sought to do that and observed so many null columns in the dataset. I employed Power Query to clean this up and this is what I want to share in this blog.
First I imported the data into Power BI and with the transform button moved it to Power Query.
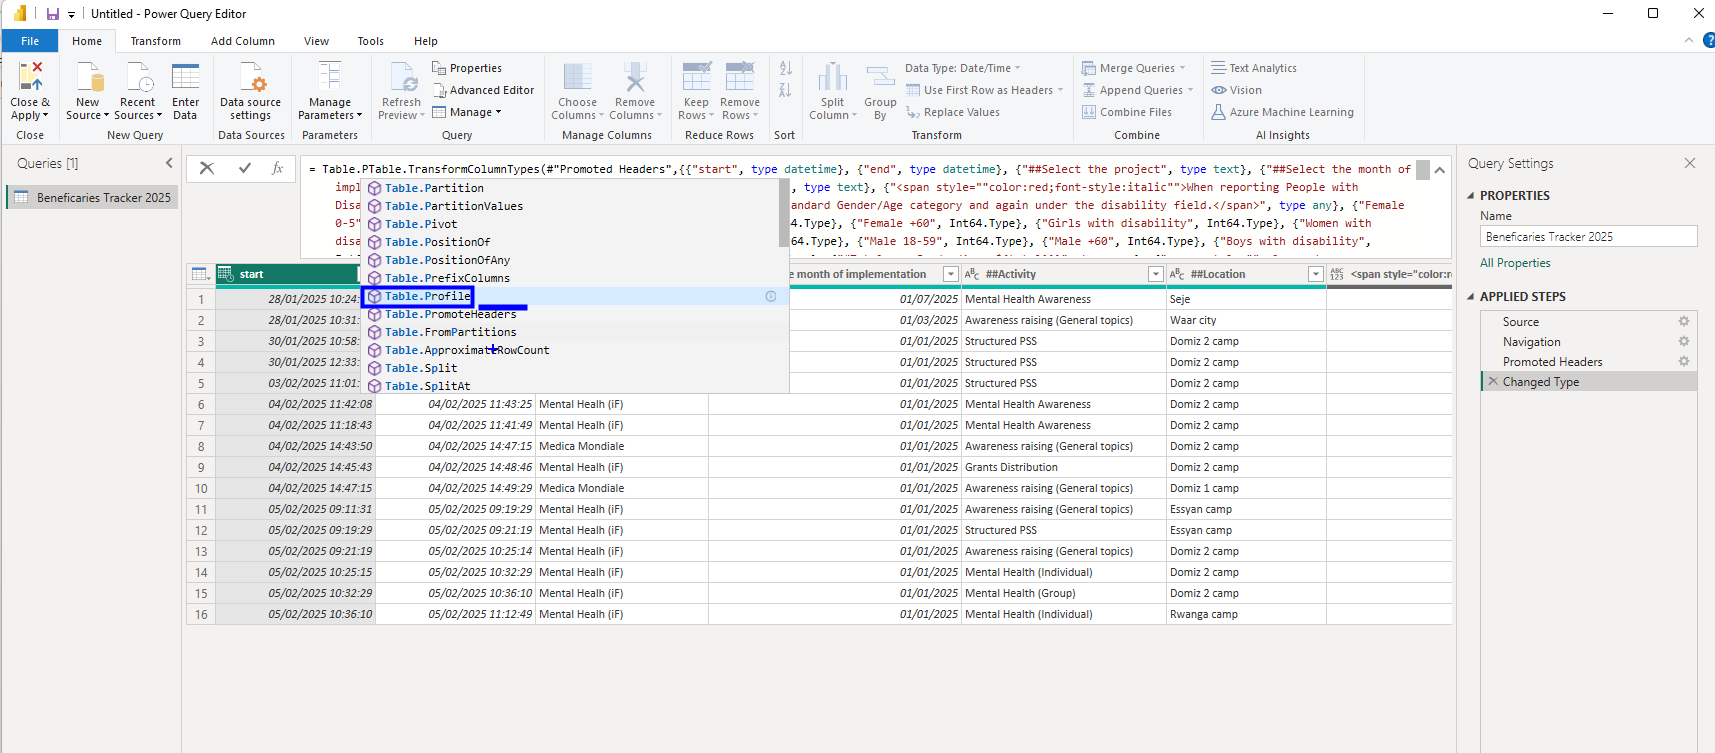
In Power query, I observed headers had been automatically been promoted with and data types changed with the function highlighted in blue.

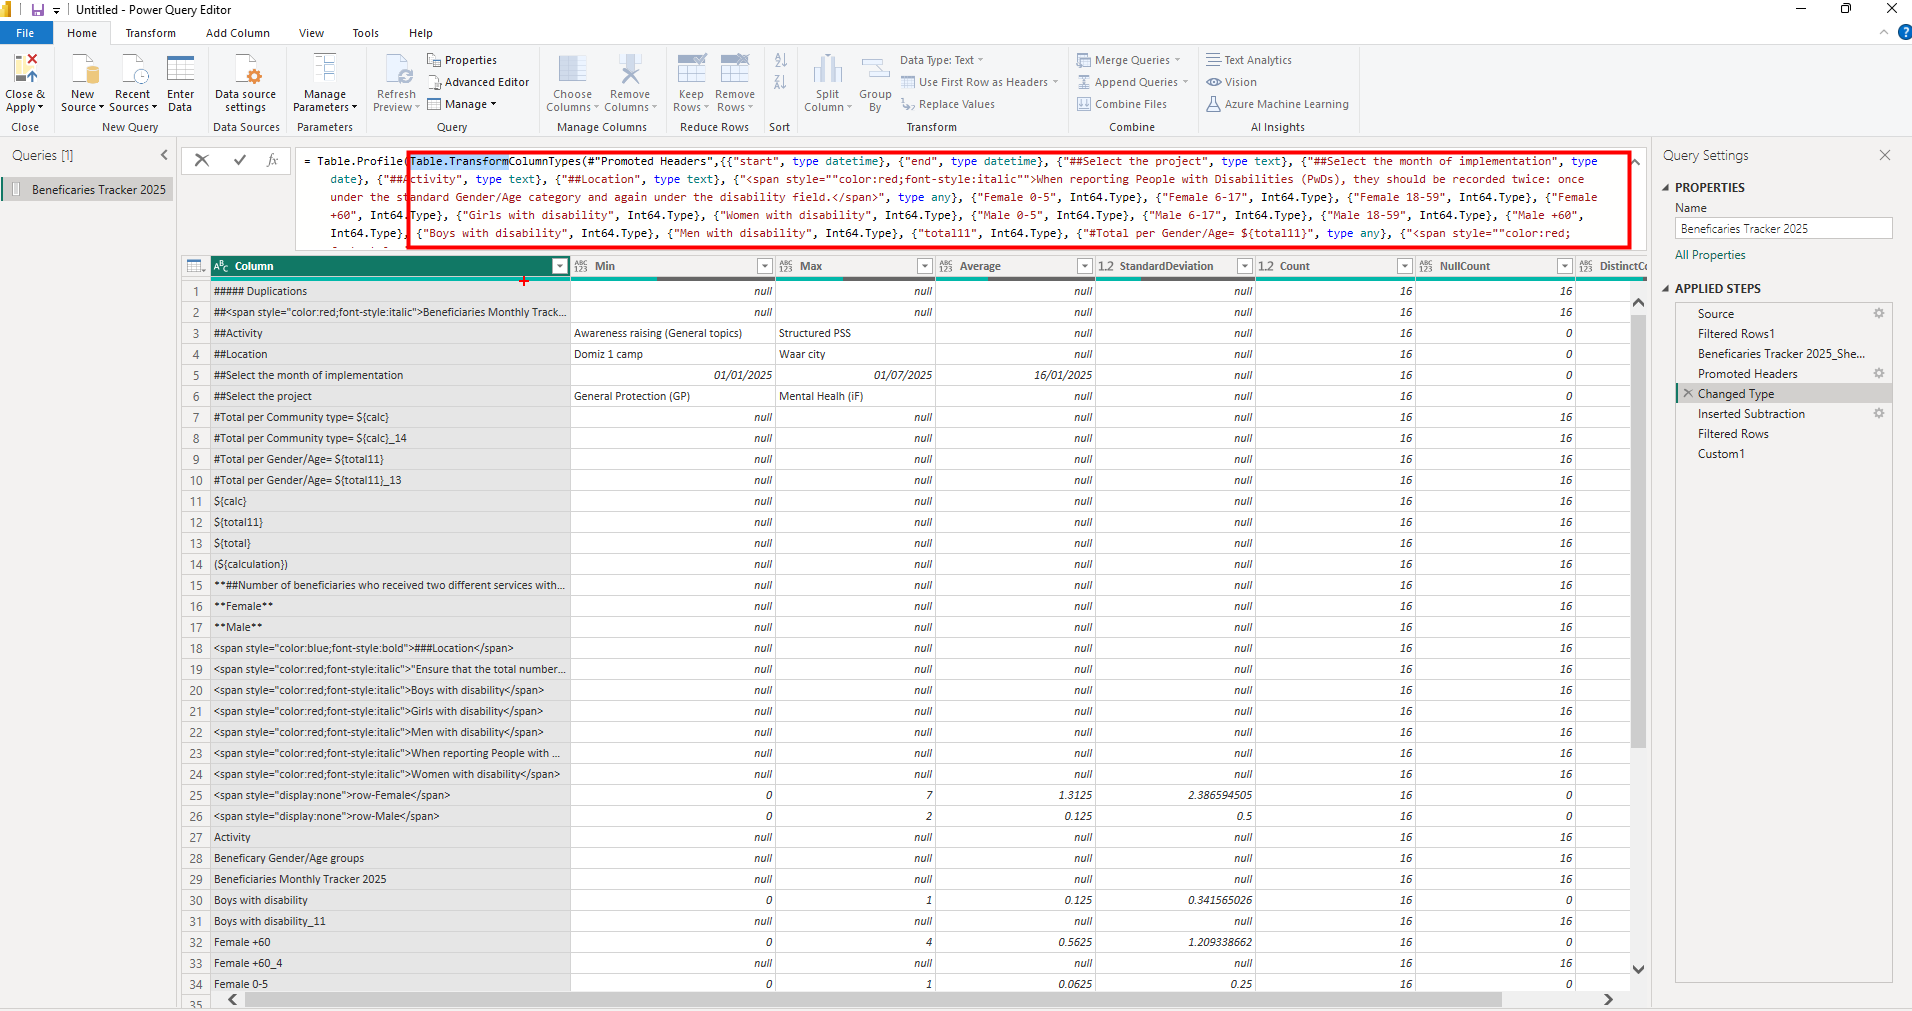
I moved on to wrap this function in the Table.Profile function.
This then pops up the table profile showing all columns and some metadata.
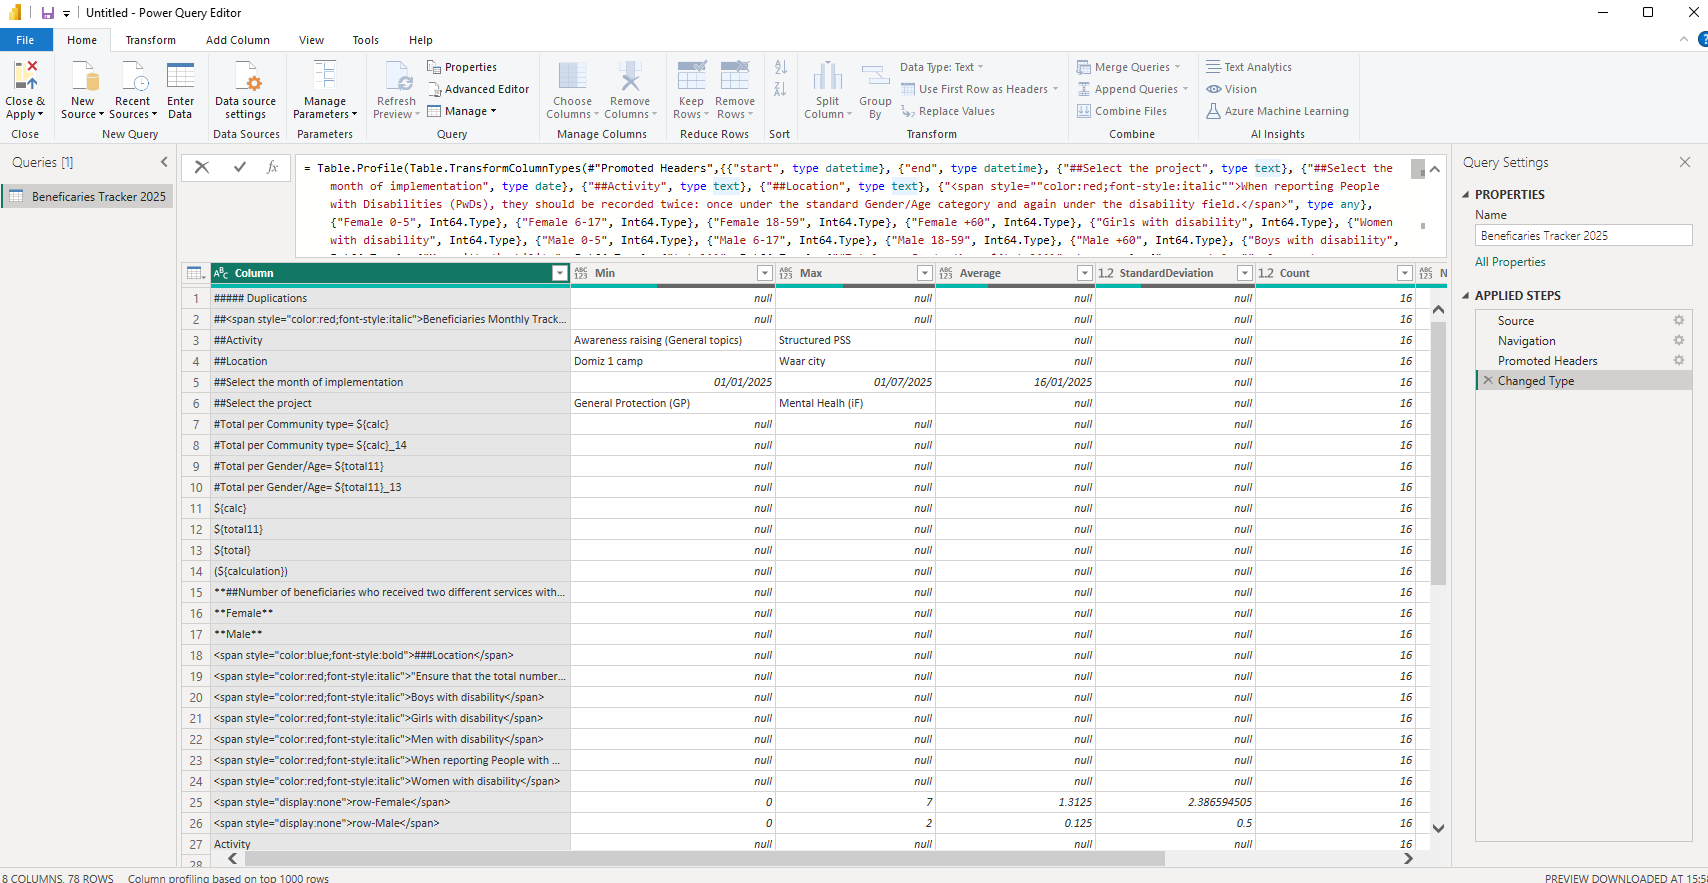
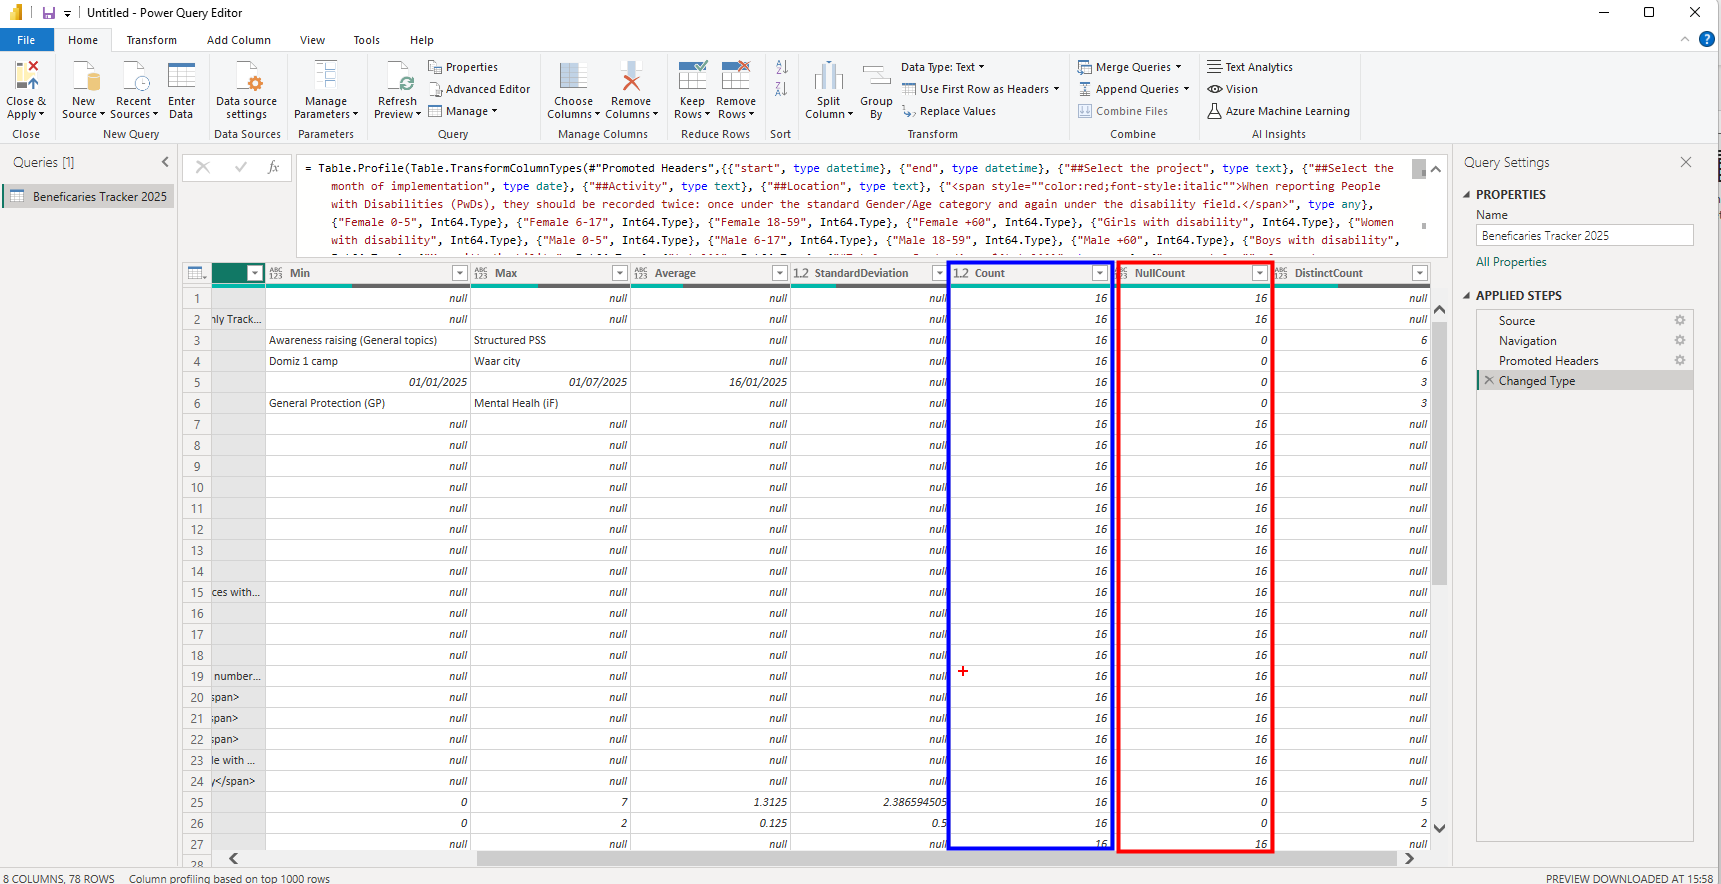
The columns of importance here are the Count column and the NullCount column. The Count column shows the count of row per column of the original data while the NullCount column shows the null rows for each column in the original data. With this in mind, any column which has a Count equaling its NullCount is an entire null column.
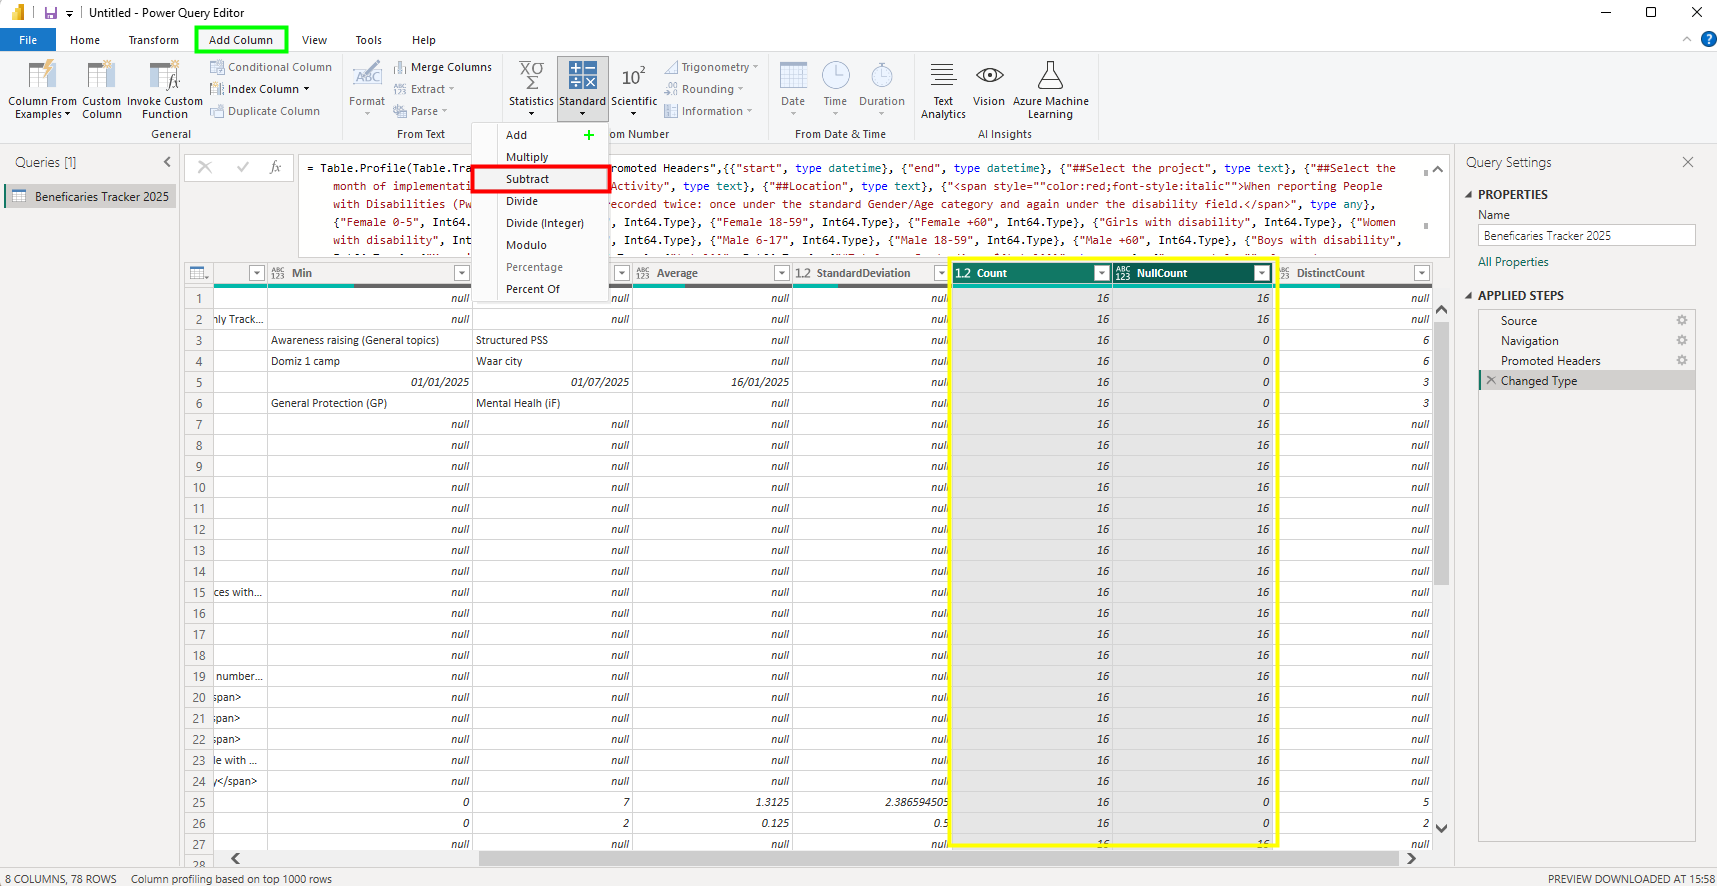
To get columns which are entirely null in the original data, click on the count column and control click on the NullCount column, selecct add column from the menu tab, select standard and click on subtract.
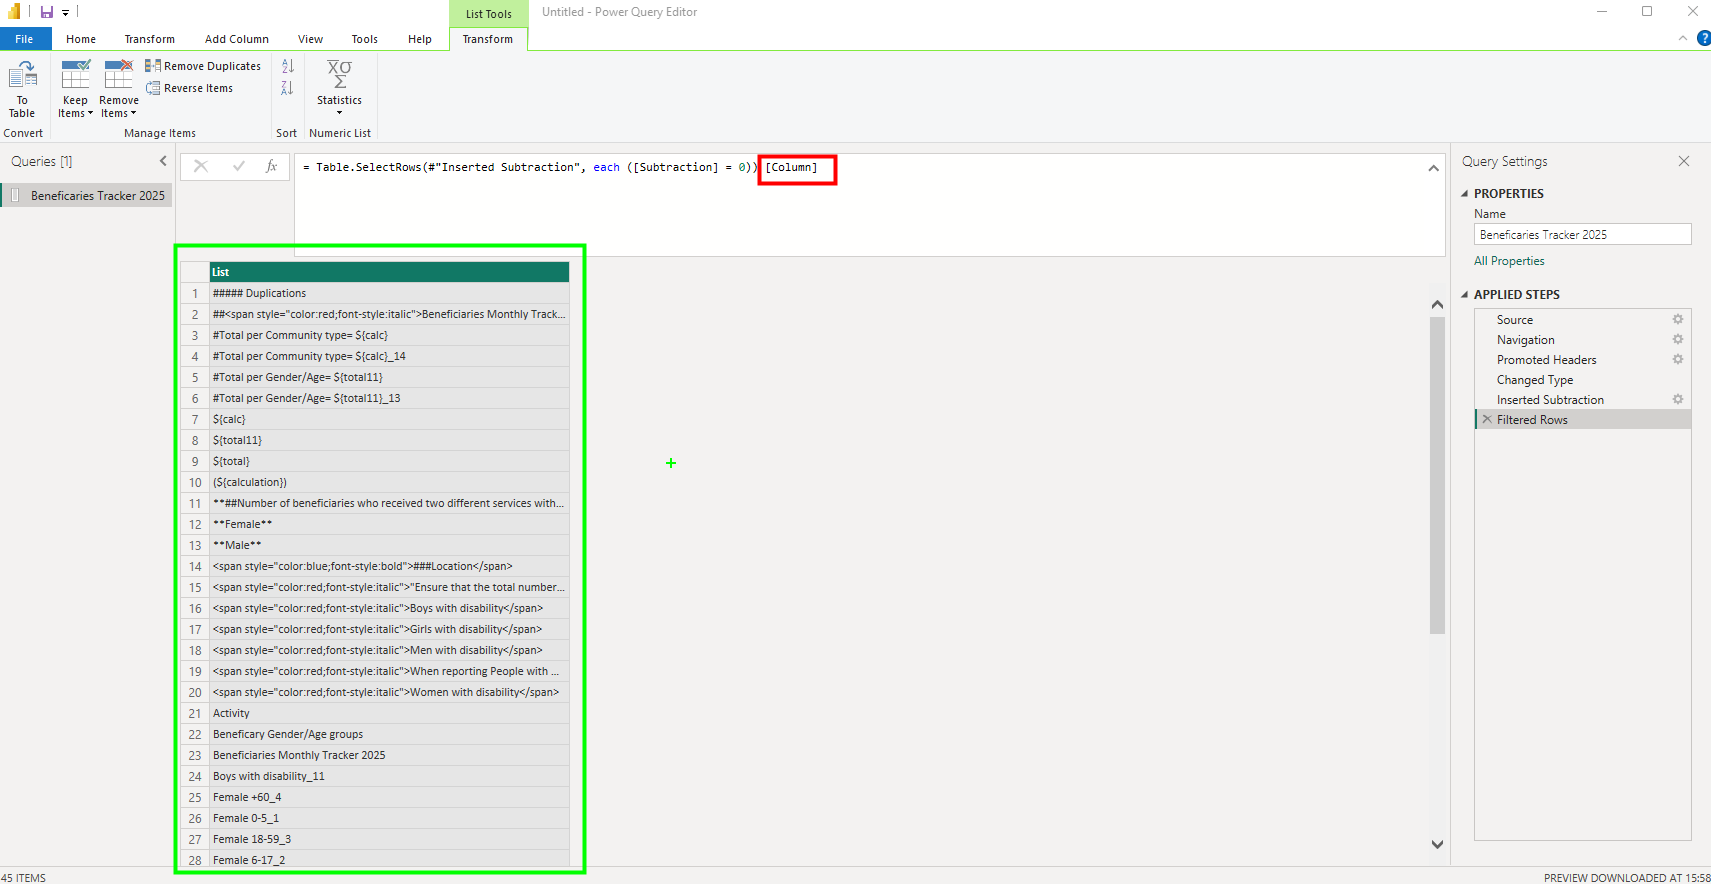
This will add on a subtraction column which should be filtered to 0 for all null columns.
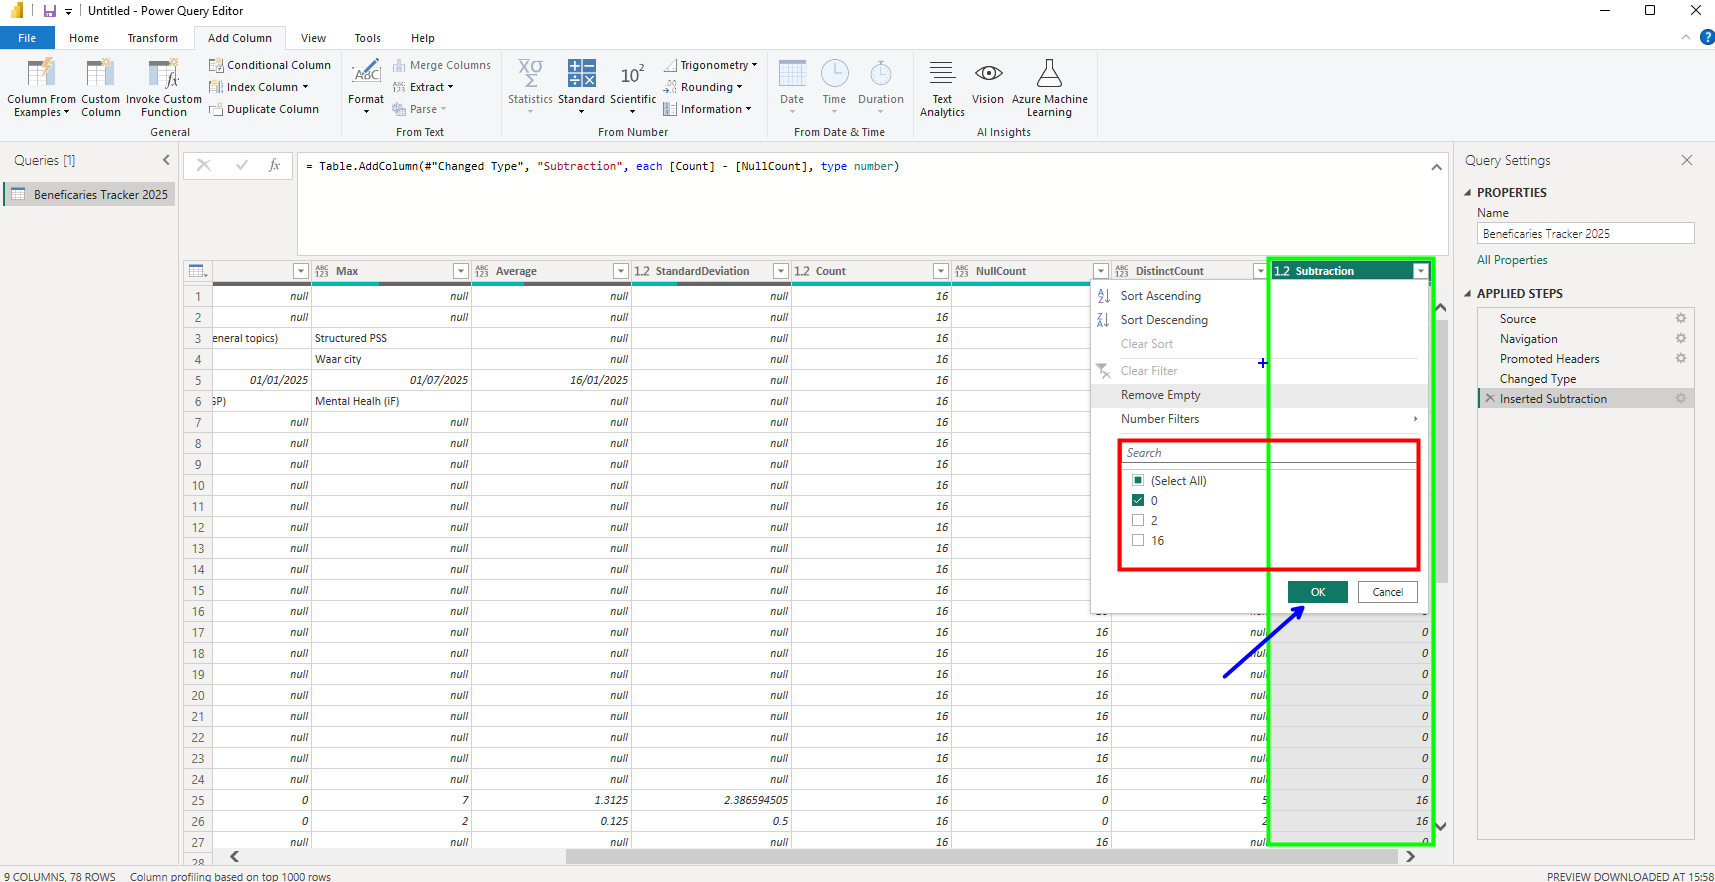
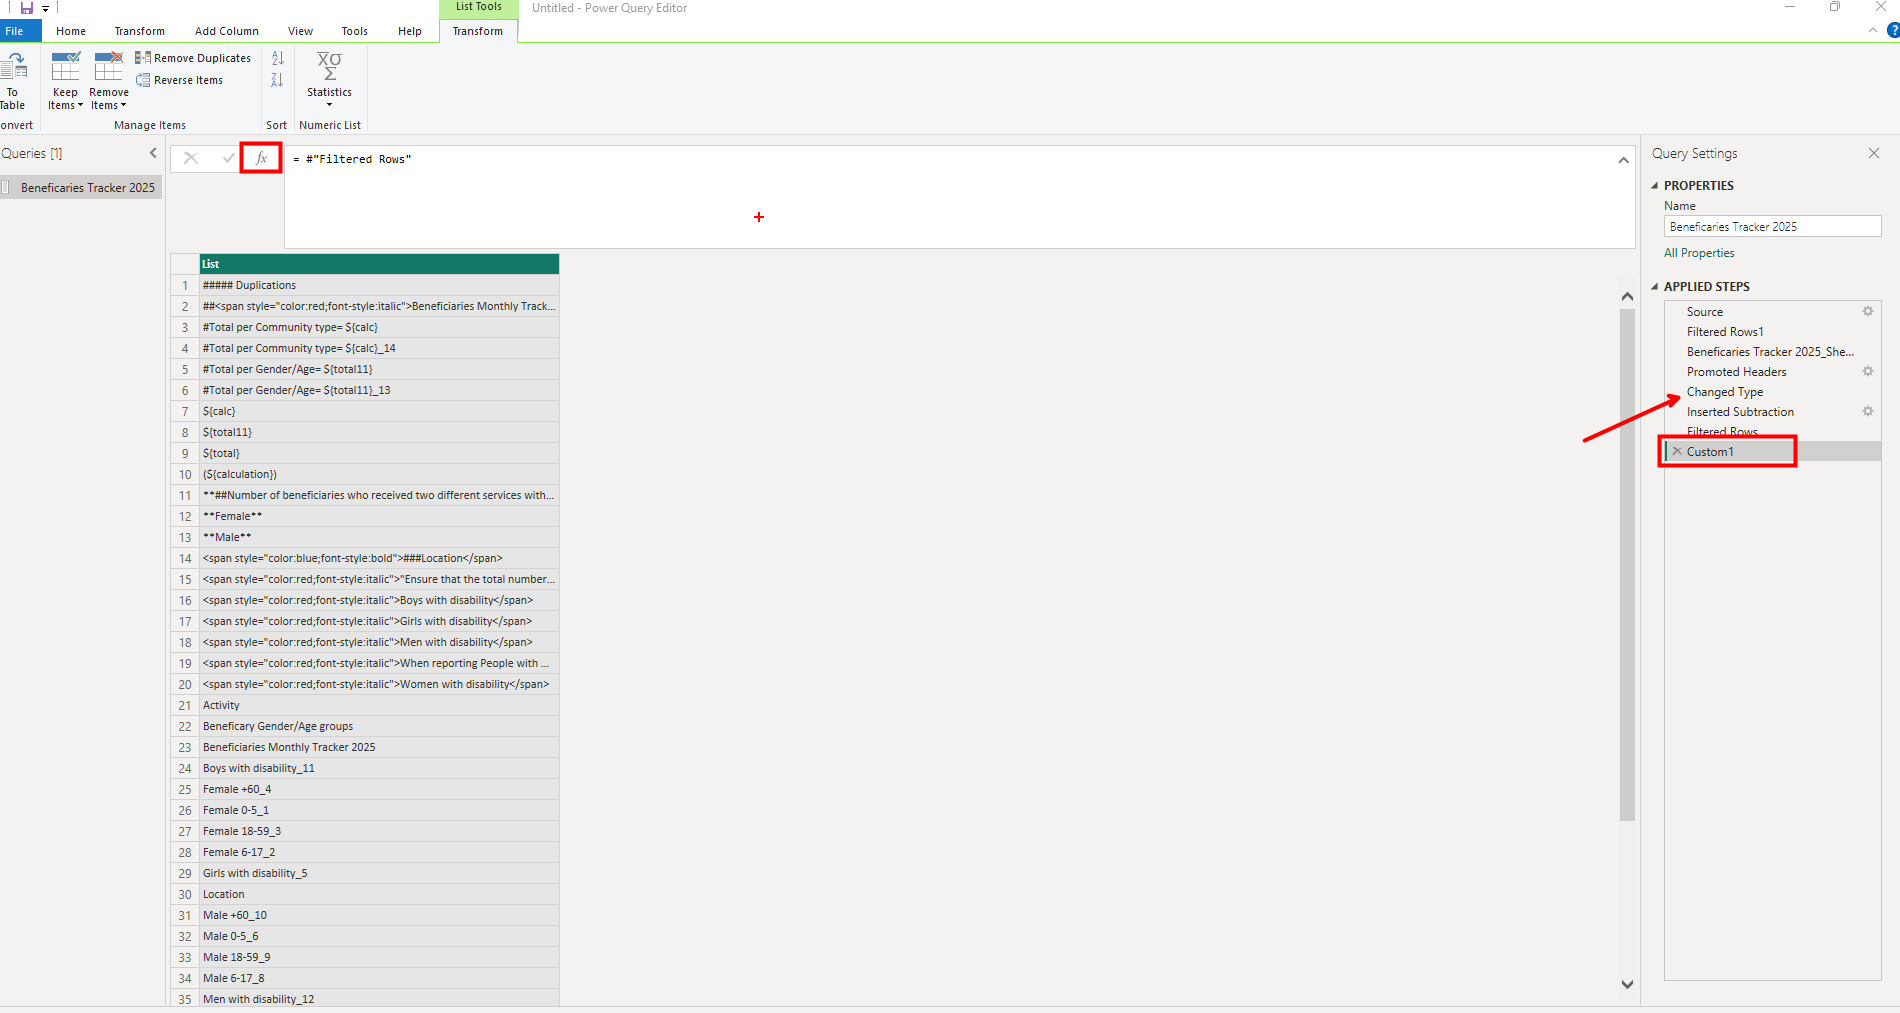
After filtering, add the column name [Column] to the formula used to add the subtraction column and also implement the filter. This will porvide a list of the columns we want to delete. Note that the insertion of the column name is case senstitive so make sure you get the casing rght.
The last step is to click on fx and add a new step. Go back to the step where we changed data types and copy the formula from the table.transform function and wrap in Table.RemoveColumns function. Click on enter to produced the refined table without entirely null columns. Hope this tip was helpful.