Aggregates are mathematical functions which aids in performing calculations on single columns and multiple rows. In effect we are trying to compress row level dimensions associated with calculations on a column. This helps us in calculating Averages, Sum, Count, Min, Max. Tableau Prep provides us more options than what I just stated.
My first week presentation at the Data School presented the opportunity to demonstrate this and that is what I want to share.
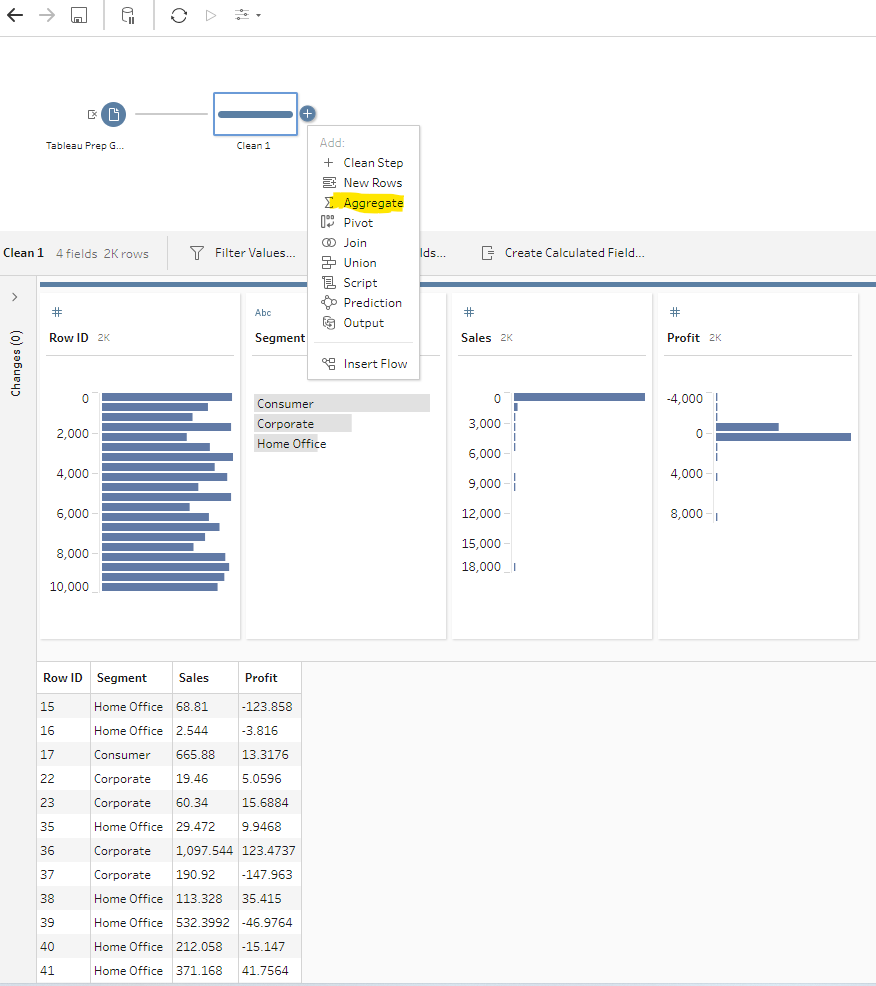
Here I have a dataset with row_id, segment, sales and profit. The goal is to calculate the Total Sales, Average Sales, and Average Profit per segment.

By selecting aggregate, I gain acces to a new interface which helps me do my Grouping (left) and Aggregations (right).

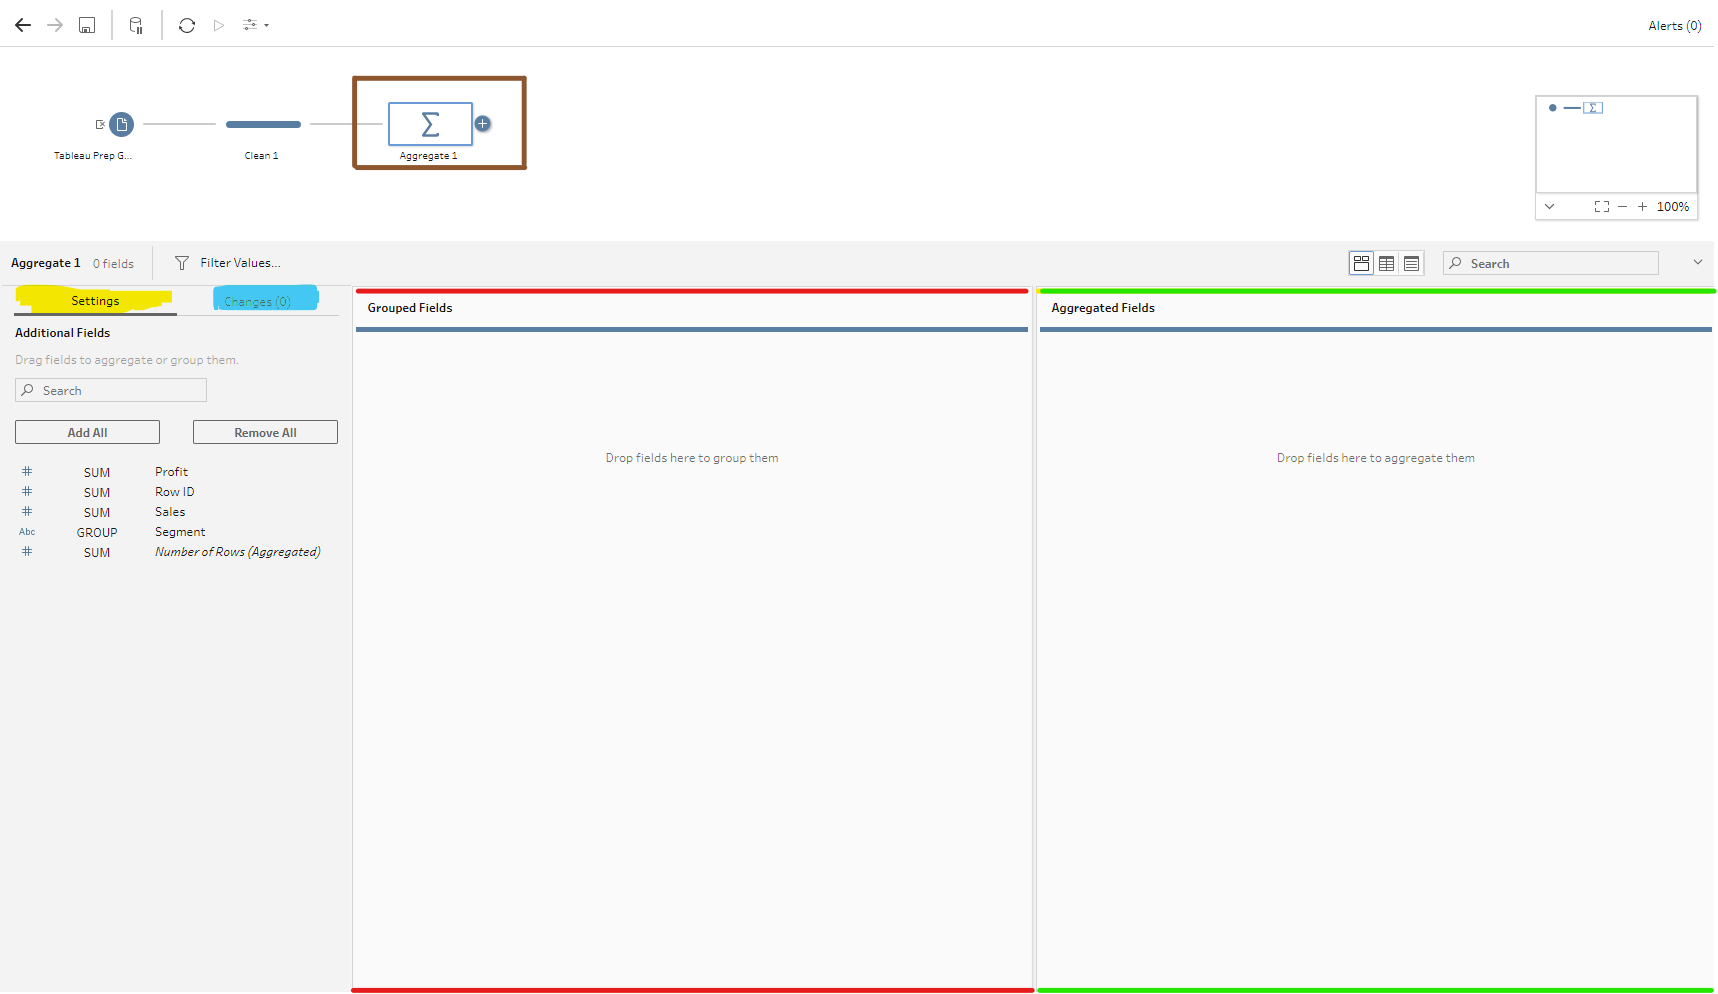
The selection of aggregation has produced the Summation sign which indicates we are doing aggregations on that step of the flow. Groupings can be done in the area bordered by red and aggregations in green. There is a settings tab highlighted in yellow which shows us what's happening to our columns on each step. Likewise, the changes tab in blue allows us to see further changes such as calculations, rename of headers etc.

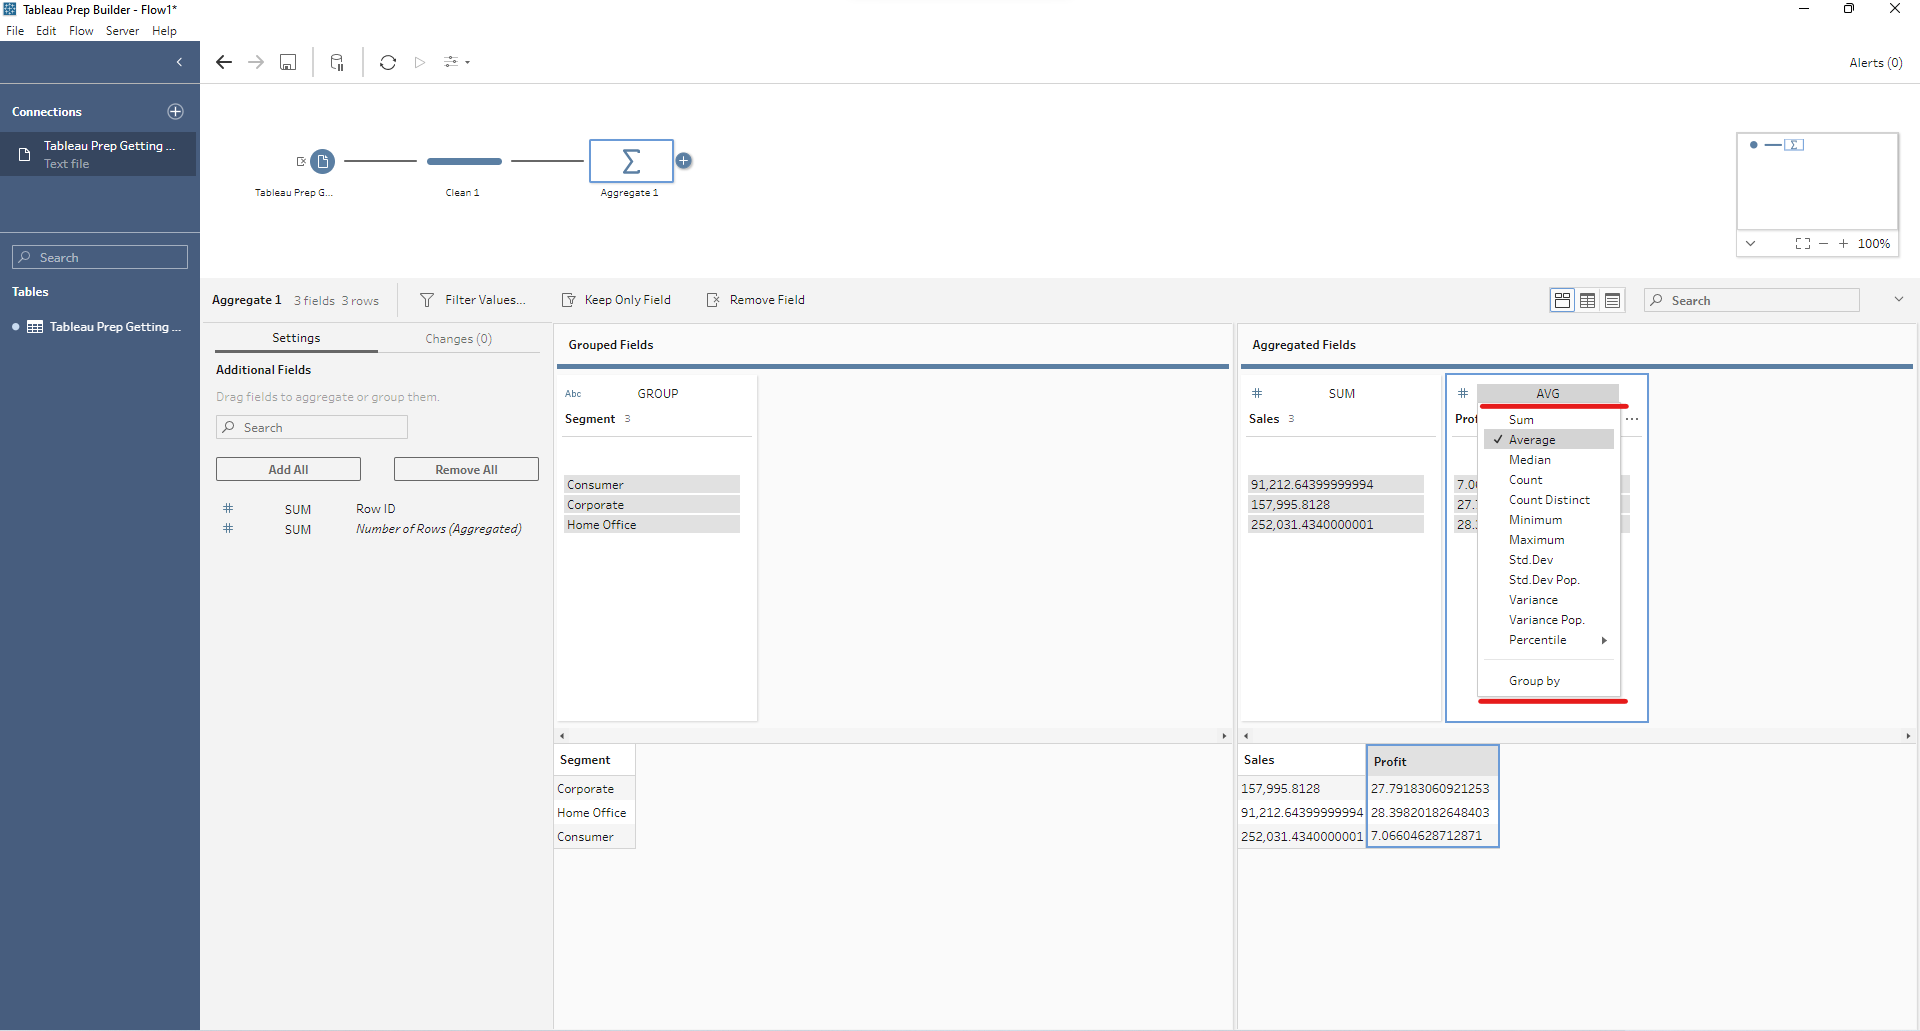
I can draw in my fields for aggreations. Dragging sales to the right shows us Total Sales for the whole entity. This is broken down into segments if I drag segments into the left. Soft filtering will then show me the total sale for each segment.

Next is the creation of my Average Profit by dragging profit into the aggregation field, clicking on SUM to open the default aggregation list in red and selecting average. In the default aggregation list, the various aggregation can be found.

Next is the creation of Average Sales but we observe there is no sales under the selection pane bounded by yellow to be used.

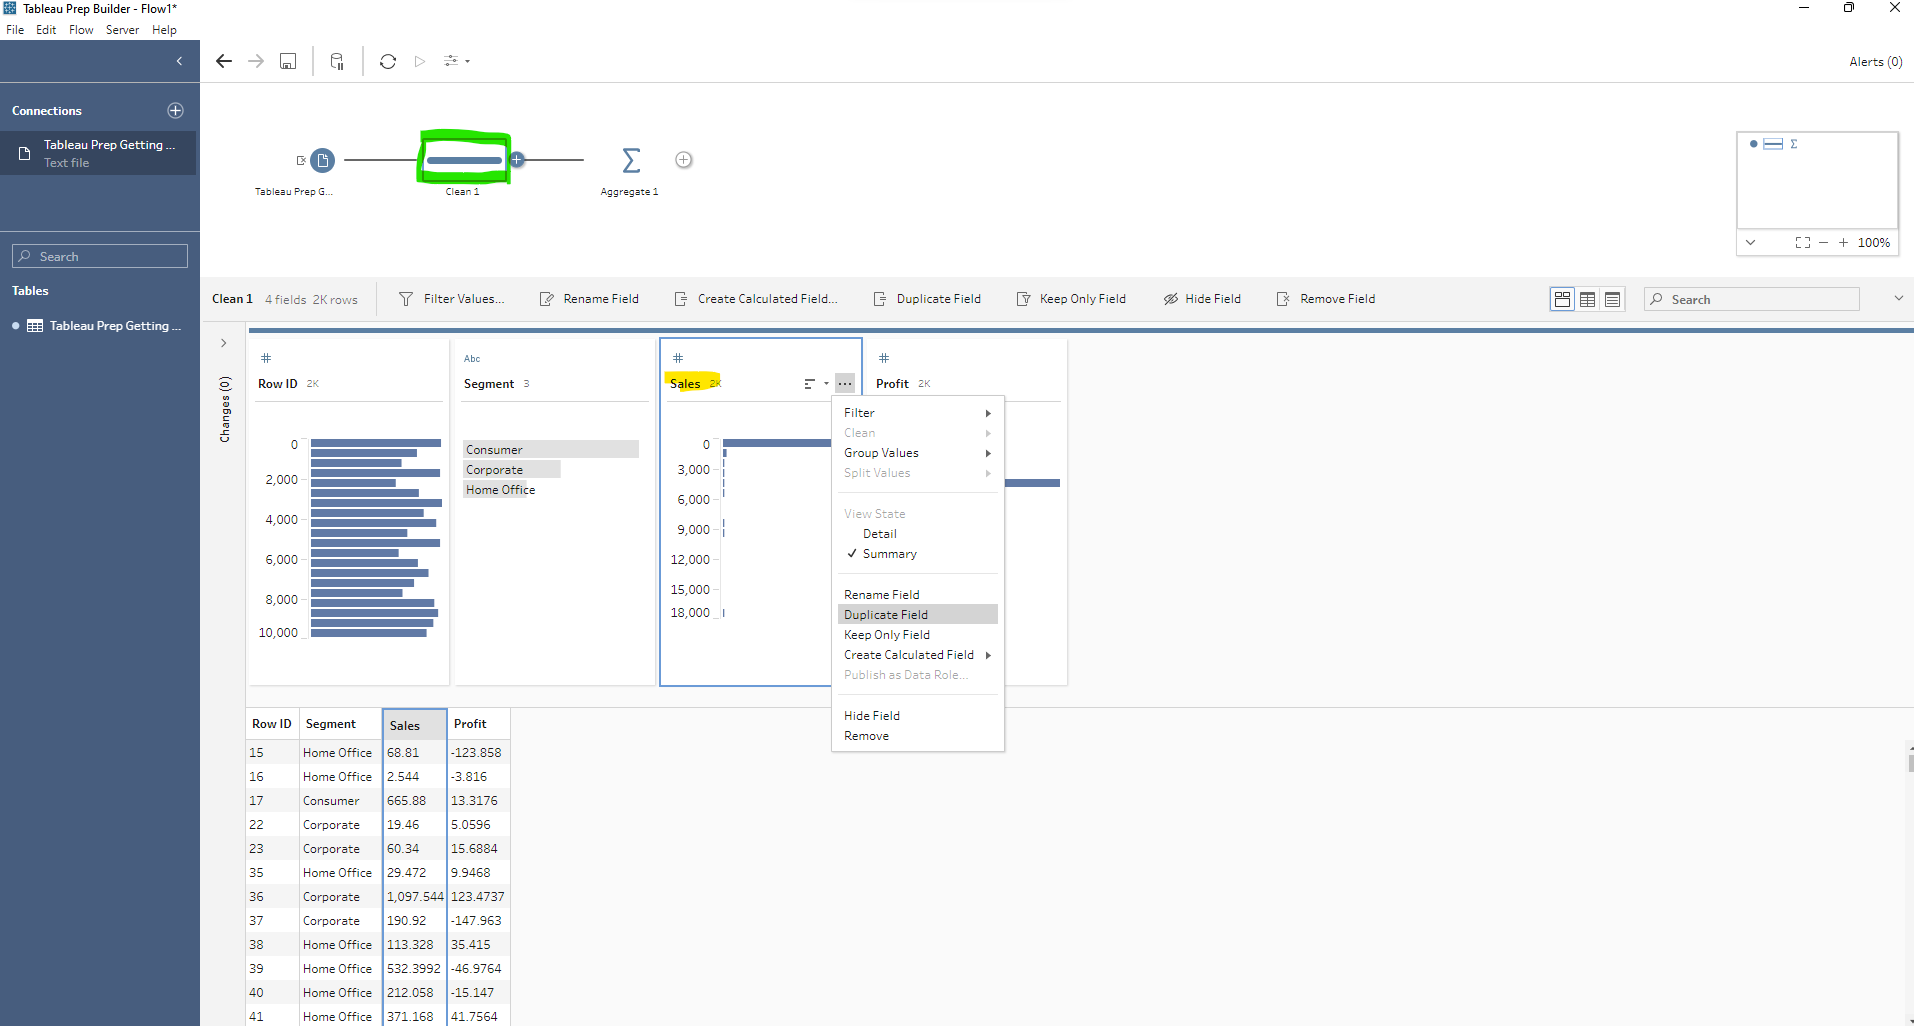
Due to this, we need to move back to the clean step in green, duplicate the sales field to get sales-1 as a new column.


The new column sales-1 can now be found under the settings pane if we click on our summation sign. This can now be dragged into the aggregation pane to create Average Sales.


Now we can rename the headers to show context and this can be done by first selecting the data grid in green and double clicking the headers to rename.

These renaming are captured under the changes pane and also on top of the summation sign for reference.

We can create another cleaning step to reposition our columns by dragging. After this is the creation of an output which could be saved as a .csv file, .xlsx file or a .hyper file. Number formatting can also be done but that will be a topic for another lecture.

